- Table of Content
- 1.e-SWAN school ...
- 2.Review of spac...
- 3.The SIDC space...
- 4.PROBA2 Observa...
- 5.International ...
- 6.Noticeable Sol...
- 7.Geomagnetic Ob...
- 8.Review of Iono...
- 9.Calendar
2. Review of space weather
3. The SIDC space Weather Briefing
4. PROBA2 Observations (13 Nov 2023 - 19 Nov 2023)
5. International Sunspot Number by SILSO
6. Noticeable Solar Events
7. Geomagnetic Observations in Belgium
8. Review of Ionospheric Activity
9. Calendar
e-SWAN school by the STCE
The e-SWAN school prior to the European Space Weather Week was fun and exciting for us, the STCE to do.
Because the participants were nice and extremely interested. Thanks to all of them!
The slides can be found here: https://events.spacepole.be/event/184/
Review of space weather
Solar Active Regions (ARs) and flares
There were 13 active regions visible throughout the week (NOAA ARs 3477 to 3490). They all had a simple alpha or beta magnetic field configuration, except for NOAA AR 3483 (beta-gamma). Four M-class flares were measured. The M-class flares originated from NOAA ARs 3485 and 3490. The strongest flare was an M1.2 from NOAA AR 3490, peaking at 05:42 UTC on 18 November.
Coronal mass ejections (CMEs)
Numerous CMEs per day occurred. One could possible impact Earth. This CME was observed on 16 November by LASCO C2 at 04:00 UTC.
Coronal Holes
Two coronal holes crossed the central meridian on 18 November, one with negative polarity at high northern latitudes and an equatorial one with positive polarity.
Proton flux levels
The 10 MeV GOES proton flux was below threshold the full week.
Electron fluxes at GEO
The greater than 2 MeV electron flux was below the 1000 pfu threshold, as measured by GOES 16 the full week. The 24 hour electron fluence was at normal levels.
Solar wind near Earth
Between November 12 PM to November 14, the solar wind at L1 was dominated by two ICMEs which were linked to the CMEs ejected from the Sun on 9 and 10 November. The solar wind speed stayed below 450 km/s with the interplanetary magnetic field reaching 15 nT. The Bz component was positive except end November 12, early November 13.
Between 15 and 17 November, the solar wind near Earth was around 400 km/s.
From 17 November PM, the speed dropped below 400 km/s.
Geomagnetism
Geomagnetic conditions reached minor storm levels globally and locally (Kp 5 and K_Bel 5) early November 13. This was due to the passage of the ICMEs. The impact of the ICMEs was limited to this period.
The rest of the week, the geomagnetic conditions were quiet to unsettled.
The SIDC space Weather Briefing
The Space Weather Briefing presented by the forecaster on duty from November 12 to 19. It reflects in images and graphs what is written in the space weather report: https://www.stce.be/briefings/20231120_SWbriefing.pdf

If you need to access the movies, contact us: stce_coordination at stce.be
PROBA2 Observations (13 Nov 2023 - 19 Nov 2023)
Solar Activity
Solar flare activity fluctuated from low to moderate during the week.
In order to view the activity of this week in more detail, we suggest to go to the following website from which all the daily (normal and difference) movies can be accessed: https://proba2.oma.be/ssa
This page also lists the recorded flaring events.
A weekly overview movie (SWAP week 712) can be found here: https://proba2.sidc.be/swap/data/mpg/movies/weekly_movies/weekly_movie_2023_11_13.mp4.
Details about some of this week's events can be found further below.
If any of the linked movies are unavailable they can be found in the P2SC movie repository here: https://proba2.oma.be/swap/data/mpg/movies/.
Saturday November 18
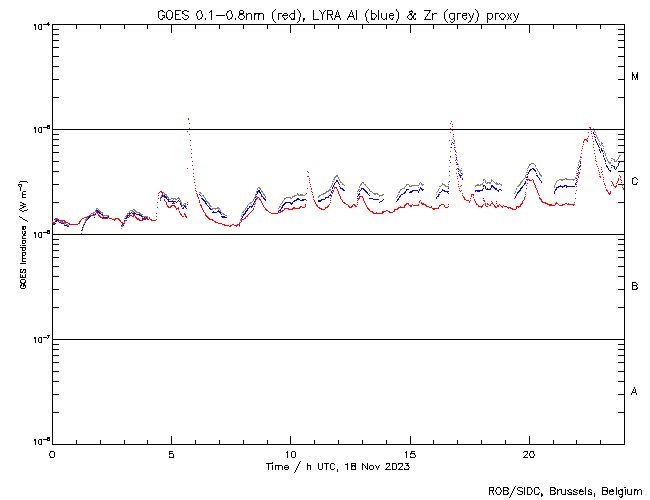
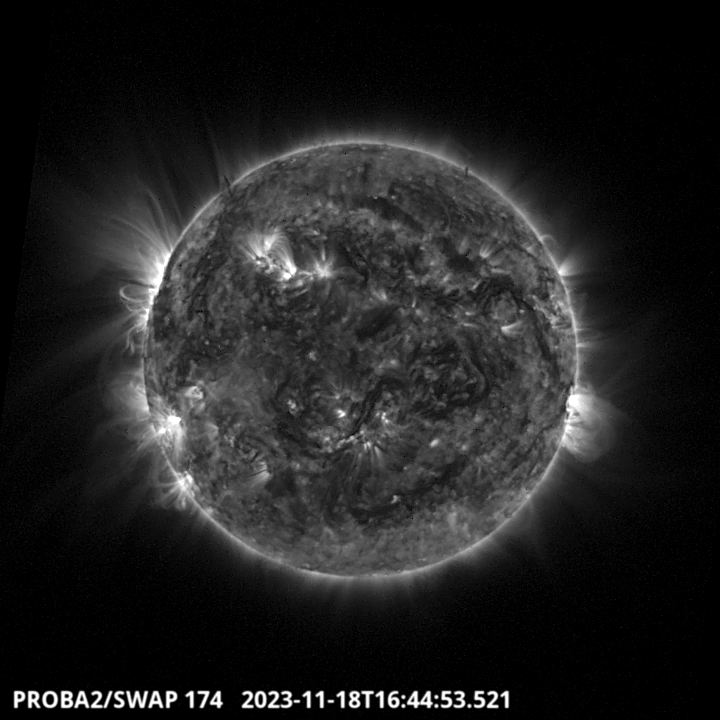
The second largest flare of this week, an M1.1 (the largest one, an M1.2, occurred during a PROBA2 occultation), was observed by LYRA (top panel) and SWAP (bottom panel). The flare peaked on 2023-Nov-18 at 16:44 UT. It occurred on the eastern limb, and it originated from NOAA AR3490, which was just rotating over the visible side of the solar disc.
Find a SWAP movie of the event here: https://proba2.sidc.be/swap/movies/20231118_swap_movie.mp4.
International Sunspot Number by SILSO
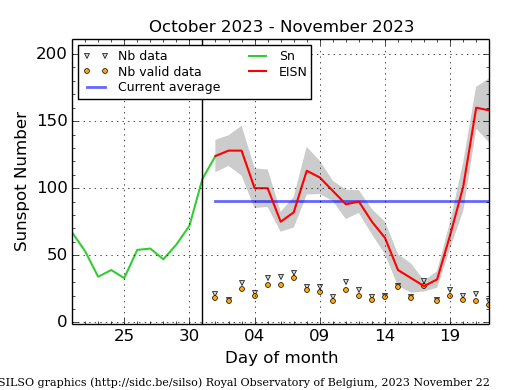
The daily Estimated International Sunspot Number (EISN, red curve with shaded error) derived by a simplified method from real-time data from the worldwide SILSO network. It extends the official Sunspot Number from the full processing of the preceding month (green line), a few days more than one solar rotation. The horizontal blue line shows the current monthly average. The yellow dots give the number of stations that provided valid data. Valid data are used to calculate the EISN. The triangle gives the number of stations providing data. When a triangle and a yellow dot coincide, it means that all the data is used to calculate the EISN of that day.
Noticeable Solar Events
| DAY | BEGIN | MAX | END | LOC | XRAY | OP | 10CM | TYPE | Cat | NOAA |
| 14 | 2258 | 2305 | 2309 | M1.0 | N | II/3 | 47 | 3485 | ||
| 18 | 0537 | 0542 | 0550 | M1.2 | 3490 | |||||
| 18 | 1634 | 1644 | 1654 | M1.1 | 3490 | |||||
| 18 | 2226 | 2234 | 2240 | M1.0 | 3490 |
| LOC: approximate heliographic location | TYPE: radio burst type |
| XRAY: X-ray flare class | Cat: Catania sunspot group number |
| OP: optical flare class | NOAA: NOAA active region number |
| 10CM: peak 10 cm radio flux |
Geomagnetic Observations in Belgium
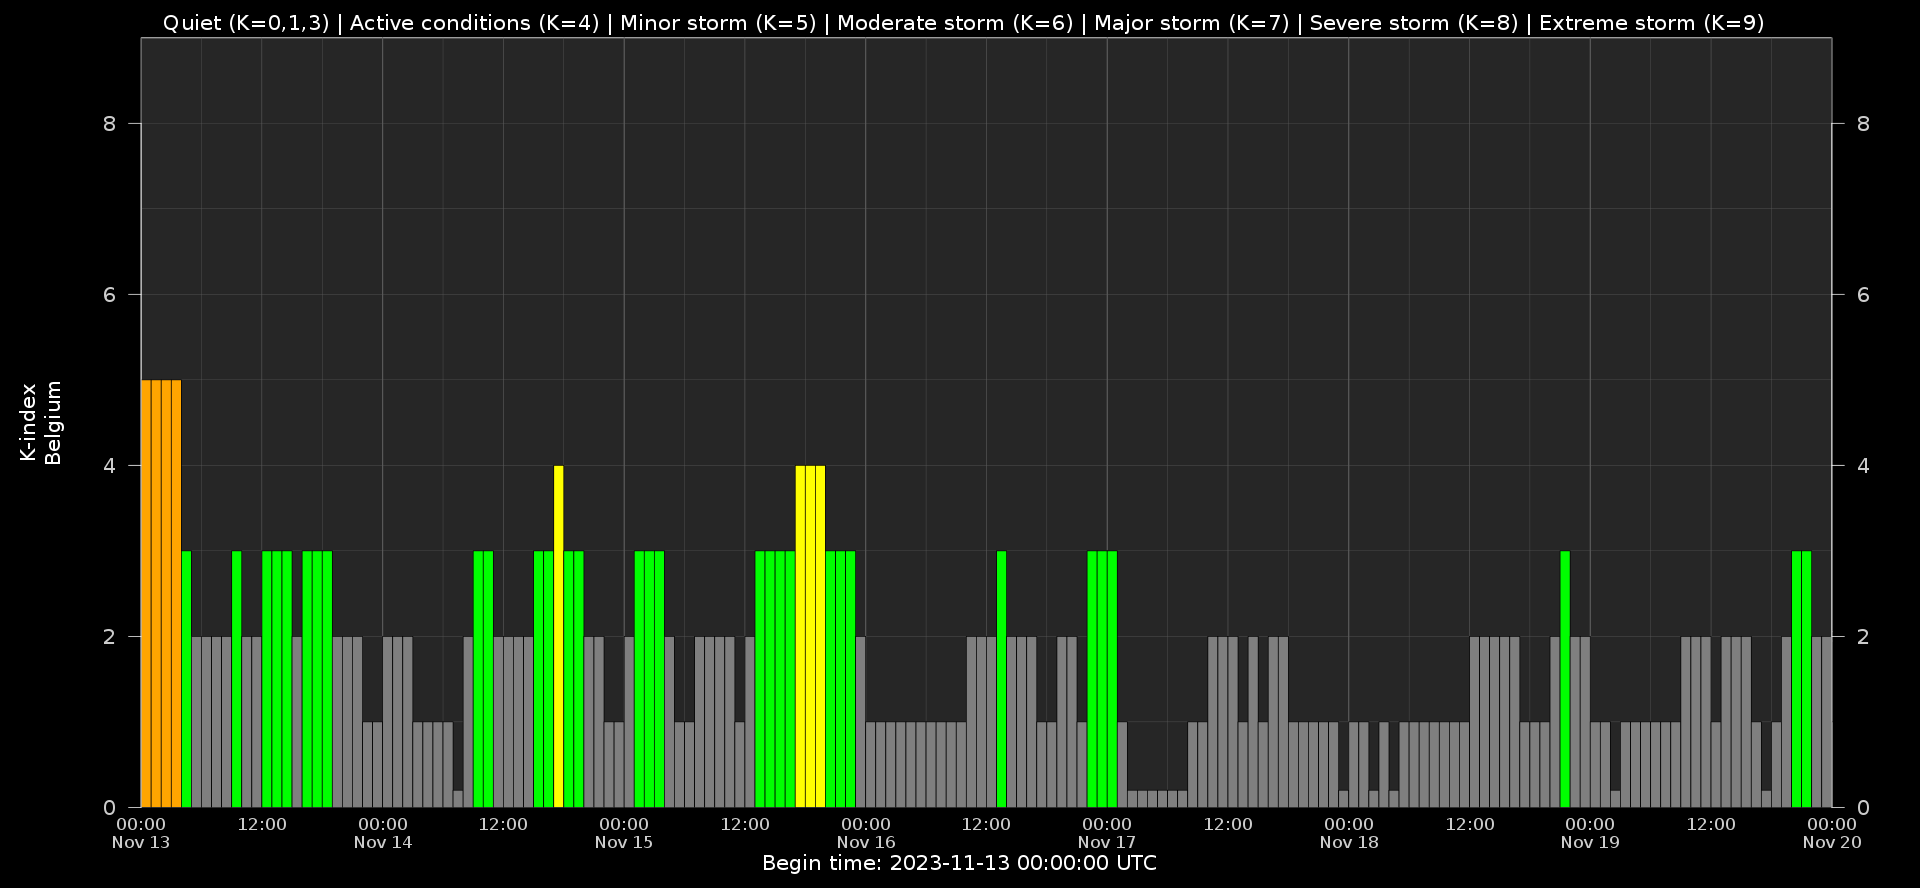
Local K-type magnetic activity index for Belgium based on data from Dourbes (DOU) and Manhay (MAB). Comparing the data from both measurement stations allows to reliably remove outliers from the magnetic data. At the same time the operational service availability is improved: whenever data from one observatory is not available, the single-station index obtained from the other can be used as a fallback system.
Both the two-station index and the single station indices are available here: http://ionosphere.meteo.be/geomagnetism/K_BEL/
Review of Ionospheric Activity
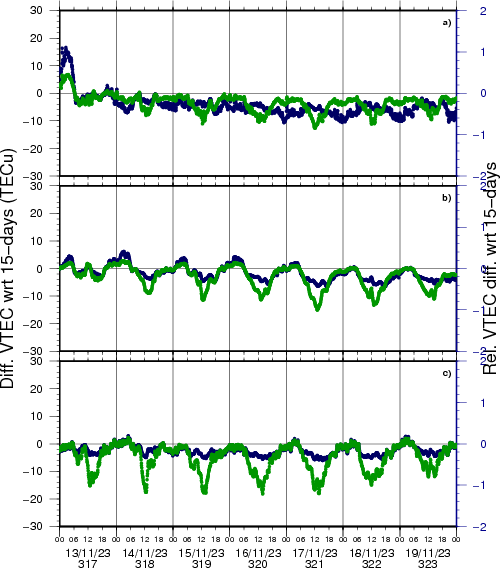
NEW! The time series below illustrates (in green) the VTEC deviation from normal quiet behaviour.
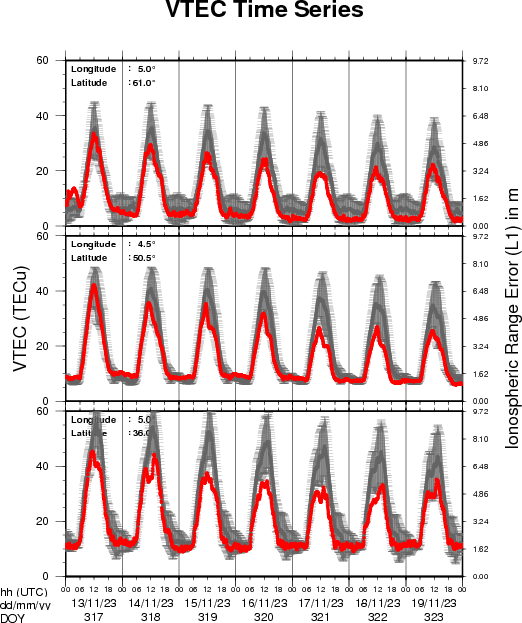
VTEC time series at 3 locations in Europe from 13 Nov 2023 till 19 Nov 2023
The top figure shows the time evolution of the Vertical Total Electron Content (VTEC) (in red) during the last week at three locations:
a) in the northern part of Europe(N 61deg E 5deg)
b) above Brussels(N 50.5deg, E 4.5 deg)
c) in the southern part of Europe(N 36 deg, E 5deg)
This top figure also shows (in grey) the normal ionospheric behaviour expected based on the median VTEC from the 15 previous days.
The time series below shows the VTEC difference (in green) and relative difference (in blue) with respect to the median of the last 15 days in the North, Mid (above Brussels) and South of Europe. It thus illustrates the VTEC deviation from normal quiet behaviour.
The VTEC is expressed in TECu (with TECu=10^16 electrons per square meter) and is directly related to the signal propagation delay due to the ionosphere (in figure: delay on GPS L1 frequency).
The Sun's radiation ionizes the Earth's upper atmosphere, the ionosphere, located from about 60km to 1000km above the Earth's surface.The ionization process in the ionosphere produces ions and free electrons. These electrons perturb the propagation of the GNSS (Global Navigation Satellite System) signals by inducing a so-called ionospheric delay.
See http://stce.be/newsletter/GNSS_final.pdf for some more explanations ; for detailed information, see http://gnss.be/ionosphere_tutorial.php
Calendar
Check out our activity calendar: activities and encounters with the Sun-Space-Earth system and Space Weather as the main theme. We provide occasions to get submerged in our world through educational, informative and instructive activities.
If you want your event in our calendar, contact us: stce_coordination at stce.be
* Nov 24, Webinar: Meet EPOS-BE, ROB, online
* Nov 26, STCE @ Dag van de Wetenschap, Planetarium, Brussels
* Dec 4-6, STCE course: Space Weather impacts on ionospheric wave propagation - focus on GNSS and HF, Brussels, Belgium - Registrations are open
* Jan 22-24, 2024, STCE Space Weather Introductory Course, Brussels, Belgium - Registrations are open
* Jan 25, 2024, post-Space Weather Introductory Course, by JMG and MeteoWing, place TBD - registration is included in the Jan SWIC
* Mar 4-5, 2024, STCE Space Weather Introductory Course, focus n aviation, online - Registrations will open soon
* Apr 22-24, 2024, STCE Space Weather Introductory Course, Brussels, Belgium - Registrations will open soon
Check: https://www.stce.be/calendar