- Table of Content
- 1.First SC25 max...
- 2.Solar Physics ...
- 3.Review of sola...
- 4.International ...
- 5.PROBA2 Observa...
- 6.Noticeable Sol...
- 7.Geomagnetic Ob...
- 8.Review of Iono...
- 9.The SIDC Space...
- 10.STCE Activitie...
2. Solar Physics and Space Weather online lecture series
3. Review of solar and geomagnetic activity
4. International Sunspot Number by SILSO
5. PROBA2 Observations
6. Noticeable Solar Events
7. Geomagnetic Observations in Belgium
8. Review of Ionospheric Activity
9. The SIDC Space Weather Briefing
10. STCE Activities
First SC25 maximum
The STCE's SC25 Tracking page (https://www.stce.be/content/sc25-tracking ) has been updated to reflect the latest evolution of some critical space weather parameters for the ongoing solar cycle 25 (SC25). It covers various aspects of space weather, from sunspot numbers over geomagnetic indices all the way to cosmic rays. The multiple graphs allow for a comparison with previous solar cycles at similar stages in their evolution.
The graph below shows the monthly and SILSO smoothed monthly sunspot number (SIDC/SILSO smoothing formula ; https://www.sidc.be/SILSO/home ) for the current and previous 2 solar cycles, SC23 and SC24. The prediction for the ongoing solar cycle 25 which started in December 2019, is displayed in green. The amplitude (115 +/-10) is based on the results from the international SC25 Prediction Panel, but in the graph the timing has been advanced to August 2024 following an update by the SC25 panel.

From March till November 2022, the monthly sunspot numbers were relatively stable between 75 and 95. Sunspot numbers then significantly increased from December 2022 onwards, with maximum monthly values reached in June (160.5) and July (160.0) 2023. The provisional smoothed monthly sunspot number has reached a first maximum of 125.2 in June 2023, which is already higher than the smoothed monthly maximum of the previous solar cycle SC24 (116.4). However, similar to SC24, it is expected that also SC25 will have a second maximum, thought to occur later in 2024, and also to be somewhat higher. The Solar Cycle Science website (http://solarcyclescience.com/forecasts.html ) has a best-fitting (single maximum) curve indicating a maximum of 135.4 for SC25 in September-October 2024, which is slightly up from 129 one year ago. The SILSO predictions for SC25 maximum (12-month window ; https://www.sidc.be/silso/ssngraphics ) are also gradually converging to a maximum between 130 and 140 in the second half of 2024, remaining well above the initial prediction by the SC25 Panel (115).
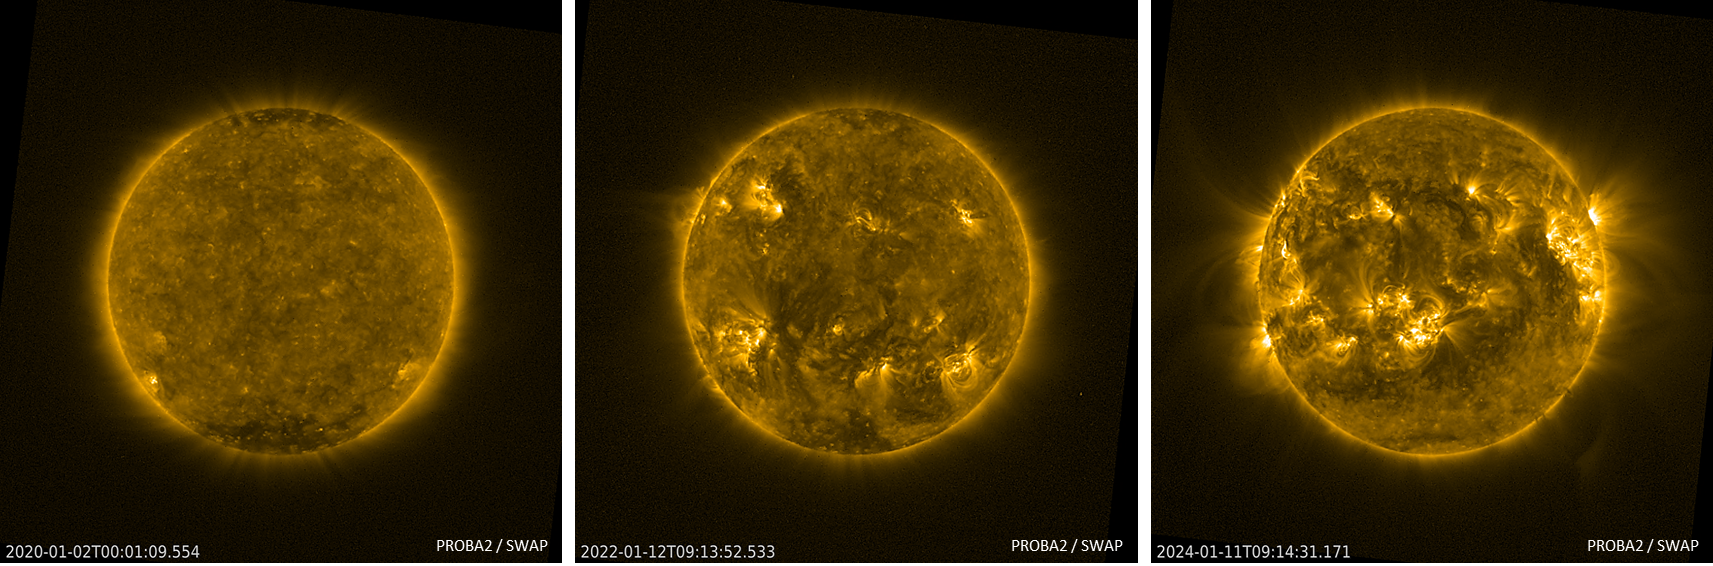
Some other space weather parameters also showed a maximum around mid-2023, such as the solar radio flux, the number of CMEs per day, and the geomagnetic Ap index (see STCE's SWx Classification page - https://www.stce.be/educational/classification ). The PROBA2/SWAP images (https://proba2.sidc.be/ssa ) above show the evolution of solar activity in extreme ultraviolet from the onset of SC25 in January 2020 until present, i.e. from solar cycle minimum until the ongoing maximum. A clip is available in the online version at https://www.stce.be/news/682/welcome.html There's one solar image per solar rotation (27 days). The increase in the number of active regions (bright areas on disk), the appearance of tall coronal structures (solar limb), and the gradual disappearance of the polar coronal holes are obvious. In the clip, the Sun seems to vary in size, due to the changing Sun-Earth distance throughout the year.
Solar Physics and Space Weather online lecture series
The STCE started a collaboration with the Addis Ababa University in Ethiopia in support of the new solar physics group of Dr. Nagessa Tilahun in the form a series of online introductory lectures on Solar Physics and Space Weather. The morning (9:30-12:00 CET) lectures are organised on a monthly basis:
• History and introduction, 27 Feb
• Sunspots and Solar Radio Astronomy, 26 Mar
• Solar Orbiter, 30 Apr
• Proba-2 and Proba-3, 28 May
• Predictions and services, 25 June
These lectures are taught at master level, especially students from developingcountries are encouraged to participate.
Practical info: anyone can register for free for each lecture separately through the webpage https://events.spacepole.be/category/4/. Click on the appropriate lecture. Registered participants will receive the zoom-link in their email-box.

Review of solar and geomagnetic activity
WEEK 1205 from 2024 Jan 29
Solar Active Regions and flares
Solar flaring activity was at low to moderate levels. There was a total of 15 active regions (ARs) observed on the visible solar disk over the week. At the start of the week, the most complex and active region was NOAA AR 3559, which produced the largest flare, an M6.8 flare with peak time 04:38 UTC January 29. A Type II radio emission associated with this event was also detected at 04:07 UTC. After this region rotated off the disk on January 30, the solar activity reduced to low levels for a few days and then increased to moderate levels again on February 02 due to an isolated M1 flare associated with NOAA AR 3571. Towards the end of the week the majority of the flaring activity was produced by NOAA 3576, which rotated onto disk over the south east limb from February 04 and produced six M-Class flares in a 12 hour period.
Coronal mass ejections
There were two Coronal Mass Ejections (CMEs) detected in the coronagraph observations that were considered to have an Earth directed component. The first was a fast halo CME, which was observed in the LASCO/C2 coronagraph imagery from 04:24 UTC on January 29. The CME has an estimated projected velocity of around 1000 km/s and was related to the M6.8-flare from NOAA AR 3559, with peak time 04:38 UTC. This CME was mostly directed to the north-west but a wider shock is visible in SOHO/LASCO-C2 data. The second CME, a faint partial halo as first observed in the SOHO/LASCO-C2 coronagraph imagery from 07:48 UTC February 01. This was associated with the long duration C3 flare from near disk centre with peak time 07:43 UTC February 01. The majority of this eruption was directed north of the Sun-Earth line. An Earth directed component was predicted but not seen in the solar wind data during the week.
Coronal Holes
A small positive polarity coronal hole in the southern hemisphere began to transit the central meridian on January 31.
Proton flux levels
The greater than 10 MeV GOES proton flux exceeded the 10pfu threshold from January 29 06:15 UTC to January 30 04:25 UTC, reaching a maximum value of 137 pfu at 18:05 UTC on January 29 as measured by GOES-18. This proton event was associated with the long duration M6.8 flare and halo CME produced by NOAA AR 3559.
Electron fluxes at GEO
The greater than 2 MeV electron flux remained below the 1000 pfu threshold. The 24h electron fluence was at nominal levels.
Solar wind
At the start of the week, the solar wind speed was slightly elevated with values around 500 km/s on January 30 and 31, due to a weak connection with a negative polarity coronal hole from the previous week. A further minor increase was observed on February 01, associated with a jump in the magnetic field from 5 to 9nT, likely associated with the January 29 halo CME. The solar wind parameters decreased and reflected a slow solar wind regime on February 02 and 03. On February 04 the interplanetary magnetic field phi angle switched into the positive sector and the magnetic field and solar wind speed increased to 10nT and 400 km/s, respectively. This increase is likely associated with the solar wind associated with the positive polarity coronal hole, which crossed the central meridian on January 31.
Geomagnetism
The geomagnetic conditions were at quiet to unsettled levels throughout the week.
International Sunspot Number by SILSO
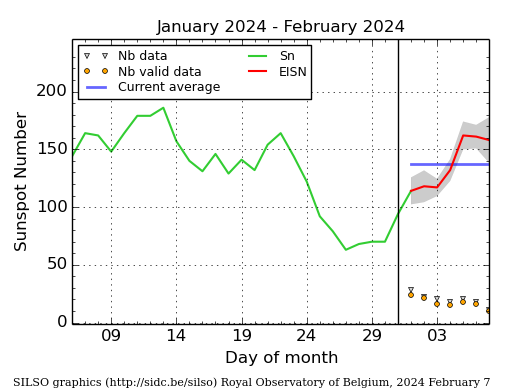
The daily Estimated International Sunspot Number (EISN, red curve with shaded error) derived by a simplified method from real-time data from the worldwide SILSO network. It extends the official Sunspot Number from the full processing of the preceding month (green line), a few days more than one solar rotation. The horizontal blue line shows the current monthly average. The yellow dots give the number of stations that provided valid data. Valid data are used to calculate the EISN. The triangle gives the number of stations providing data. When a triangle and a yellow dot coincide, it means that all the data is used to calculate the EISN of that day.
PROBA2 Observations
Solar Activity
Solar flare activity fluctuated from low to moderate during the week.
In order to view the activity of this week in more detail, we suggest to go to the following website from which all the daily (normal and difference) movies can be accessed: https://proba2.oma.be/ssa
This page also lists the recorded flaring events.
A weekly overview movie can be found here (SWAP week 723): https://proba2.sidc.be/swap/data/mpg/movies/weekly_movies/weekly_movie_2024_01_29.mp4
Details about some of this week's events can be found further below.
If any of the linked movies are unavailable they can be found in the P2SC movie repository here: https://proba2.sidc.be/swap/data/mpg/movies/
Monday Jan 29
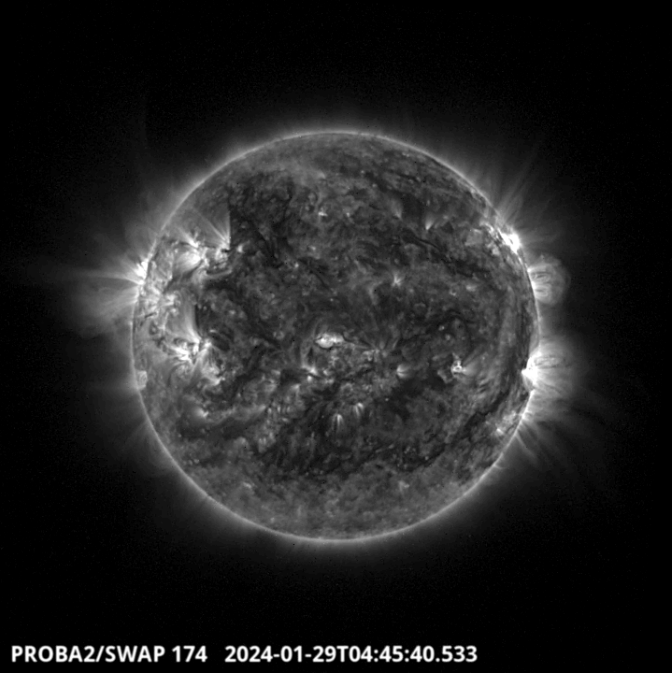
The strongest eruption of the week, a M6.8, has been produced by the AR 3559 located on the
north west side of the solar disk around 4:45 UT. Find a SWAP movie of the event here: https://proba2.sidc.be/swap/movies/20240129_swap_movie.mp4
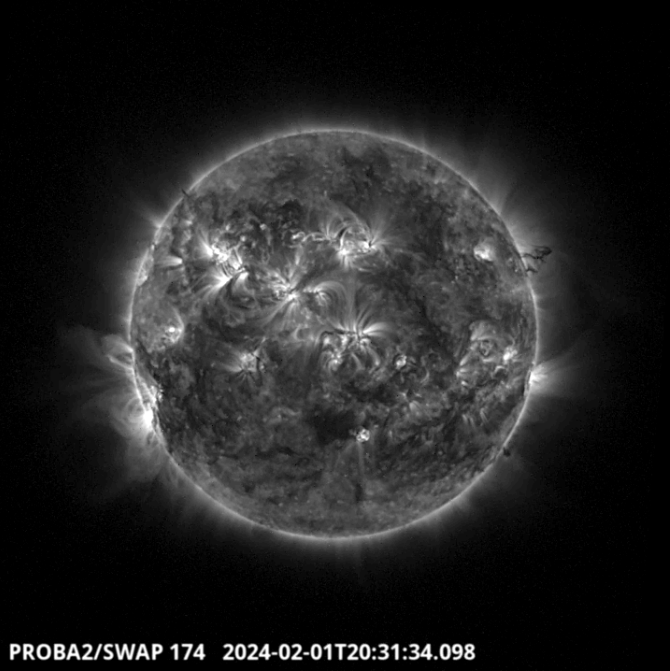
A prominence eruption has been produced on the north western limb around 20:31 UT. Find a SWAP movie of the event here: https://proba2.sidc.be/swap/movies/20240201_swap_movie.mp4
Noticeable Solar Events
| DAY | BEGIN | MAX | END | LOC | XRAY | OP | 10CM | TYPE | Cat | NOAA |
| 29 | 0129 | 0140 | 0152 | N29W61 | M1.2 | SF | III/1 | 43 | 3559 | |
| 29 | 0354 | 0438 | 0515 | N25W70 | M6.8 | SF | II/2 | 43 | 3559 | |
| 02 | 0252 | 0301 | 0305 | M1.1 | II/3 | 59 | 3571 | |||
| 04 | 1140 | 1153 | 1208 | S15E86 | M1.4 | SF | VI/2 | 3576 | ||
| 04 | 1622 | 1638 | 1646 | M1.5 | 3576 | |||||
| 04 | 1705 | 1712 | 1719 | M1.3 | 3576 | |||||
| 04 | 1816 | 1829 | 1843 | M1.1 | 56 | 3575 | ||||
| 04 | 2052 | 2057 | 2101 | M1.2 | 3576 | |||||
| 04 | 2220 | 2228 | 2234 | M2.1 | 3576 | |||||
| 04 | 2234 | 2237 | 2242 | M2.7 | 3576 |
| LOC: approximate heliographic location | TYPE: radio burst type |
| XRAY: X-ray flare class | Cat: Catania sunspot group number |
| OP: optical flare class | NOAA: NOAA active region number |
| 10CM: peak 10 cm radio flux |
Geomagnetic Observations in Belgium
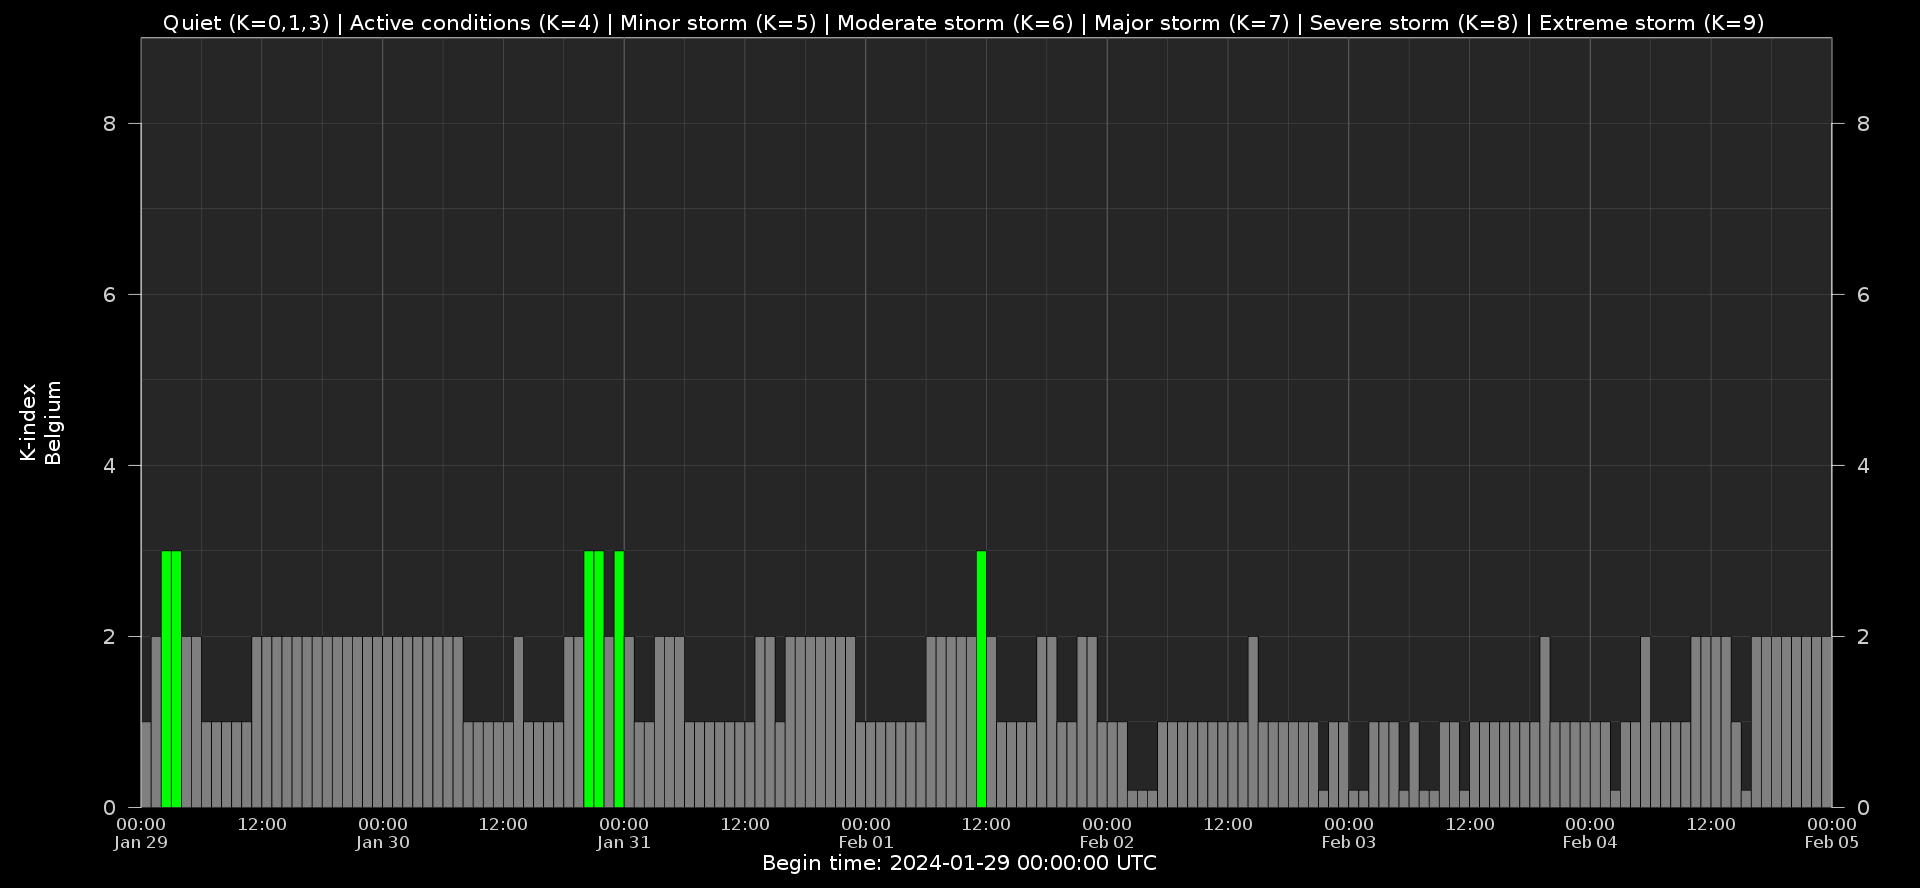
Local K-type magnetic activity index for Belgium based on data from Dourbes (DOU) and Manhay (MAB). Comparing the data from both measurement stations allows to reliably remove outliers from the magnetic data. At the same time the operational service availability is improved: whenever data from one observatory is not available, the single-station index obtained from the other can be used as a fallback system.
Both the two-station index and the single station indices are available here: http://ionosphere.meteo.be/geomagnetism/K_BEL/
Review of Ionospheric Activity
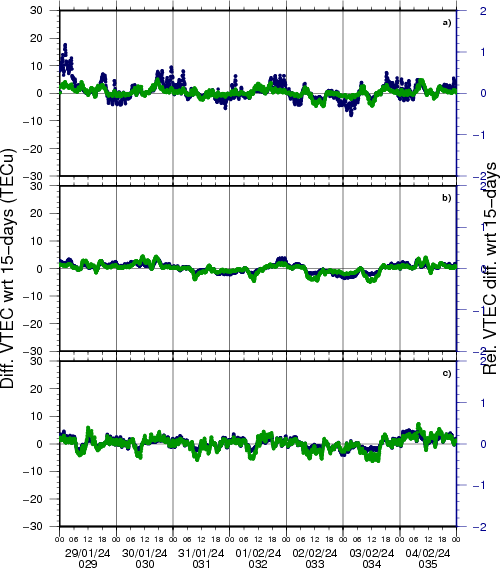
NEW! The time series below illustrates (in green) the VTEC deviation from normal quiet behaviour.
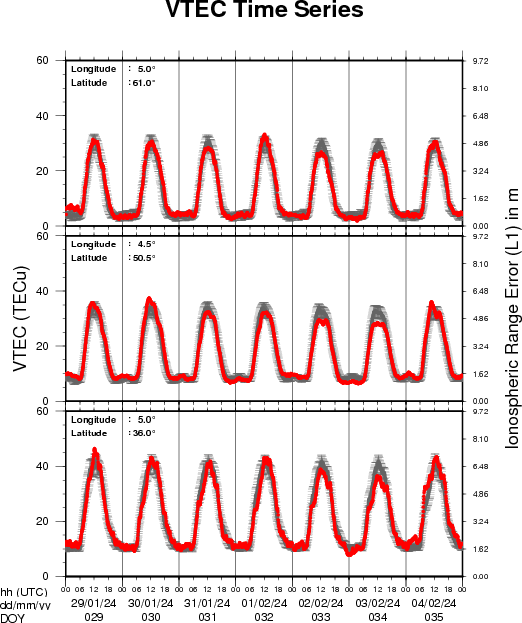
VTEC time series at 3 locations in Europe from 29 Jan 2024 till 4 Feb 2024
The top figure shows the time evolution of the Vertical Total Electron Content (VTEC) (in red) during the last week at three locations:
a) in the northern part of Europe(N 61deg E 5deg)
b) above Brussels(N 50.5deg, E 4.5 deg)
c) in the southern part of Europe(N 36 deg, E 5deg)
This top figure also shows (in grey) the normal ionospheric behaviour expected based on the median VTEC from the 15 previous days.
The time series below shows the VTEC difference (in green) and relative difference (in blue) with respect to the median of the last 15 days in the North, Mid (above Brussels) and South of Europe. It thus illustrates the VTEC deviation from normal quiet behaviour.
The VTEC is expressed in TECu (with TECu=10^16 electrons per square meter) and is directly related to the signal propagation delay due to the ionosphere (in figure: delay on GPS L1 frequency).
The Sun's radiation ionizes the Earth's upper atmosphere, the ionosphere, located from about 60km to 1000km above the Earth's surface.The ionization process in the ionosphere produces ions and free electrons. These electrons perturb the propagation of the GNSS (Global Navigation Satellite System) signals by inducing a so-called ionospheric delay.
See http://stce.be/newsletter/GNSS_final.pdf for some more explanations; for more information, see https://gnss.be/SpaceWeather
The SIDC Space Weather Briefing
The Space Weather Briefing presented by the forecaster on duty from January 29 to February 4. It reflects in images and graphs what is written in the space weather report: https://www.stce.be/briefings/20240205_SWbriefing.pdf

If you need to access the movies, contact us: stce_coordination at stce.be
STCE Activities
Check out our activity calendar: activities and encounters with the Sun-Space-Earth system and Space Weather as the main theme. We provide occasions to get submerged in our world through educational, informative and instructive activities.
If you want your event in our calendar, contact us: stce_coordination at stce.be
* February 27, Solar physics and Space Weather: history and introduction, online course - Registrations are open on https://www.stce.be/
* Mar 4-5, 2024, STCE Space Weather Introductory Course, focus on aviation, online - Registrations are open on https://www.stce.be/
* March 26, Solar physics and Space Weather: Sunspots and Solar Radio Astronomy , online course - Registrations are open on https://www.stce.be/
* Apr 22-24, 2024, STCE Space Weather Introductory Course, Brussels, Belgium - Registrations are open on https://www.stce.be/
* April 30, , Solar physics and Space Weather: Solar Orbiter Spacecraft, online course - Registrations are open on https://www.stce.be/
* May 28, , Solar physics and Space Weather: Proba-2 and Proba-3, online course - Registrations are open on https://www.stce.be/
* June 25, , Solar physics and Space Weather: predictions and services, online course - Registrations are open on https://www.stce.be/
More info needed? Contact us: stce_coordination at stce.be
Check: https://www.stce.be/calendar