- Table of Content
- 1.Teamwork
- 2.Feel and see -...
- 3.PITHIA-NRF new...
- 4.Review of spac...
- 5.International ...
- 6.Noticeable Sol...
- 7.PROBA2 Observa...
- 8.Geomagnetic Ob...
- 9.The SIDC space...
- 10.Review of Iono...
- 11.STCE courses a...
2. Feel and see - Parker Solar Probe and Solar Orbiter team up
3. PITHIA-NRF news
4. Review of space weather
5. International Sunspot Number by SILSO
6. Noticeable Solar Events
7. PROBA2 Observations (18 Mar 2024 - 24 Mar 2024)
8. Geomagnetic Observations in Belgium
9. The SIDC space weather briefing
10. Review of Ionospheric Activity
11. STCE courses and lectures
Teamwork
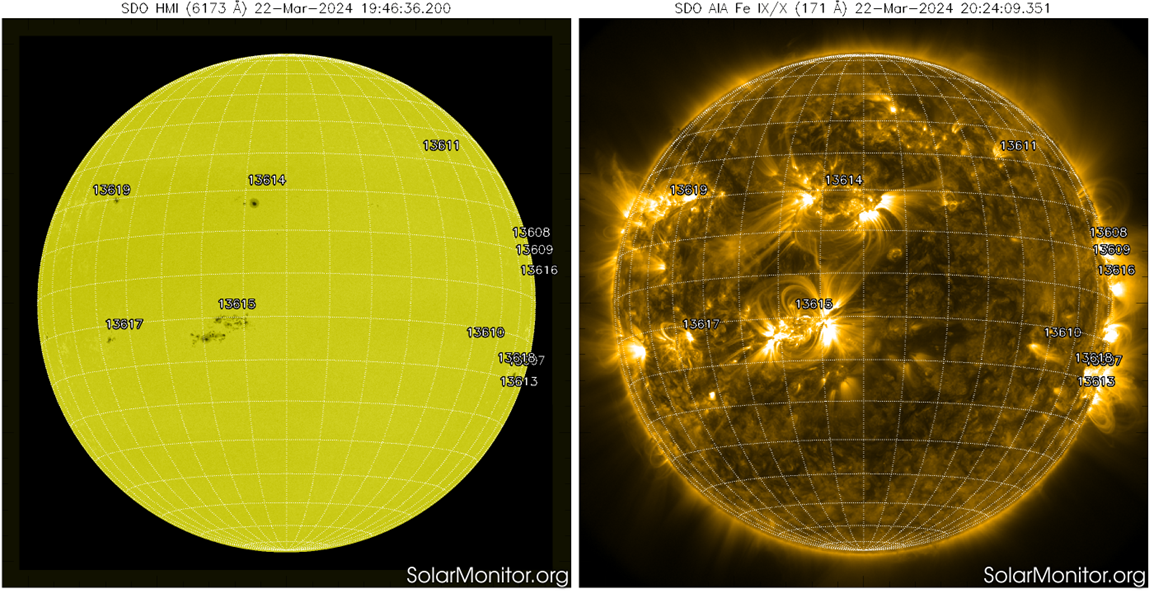
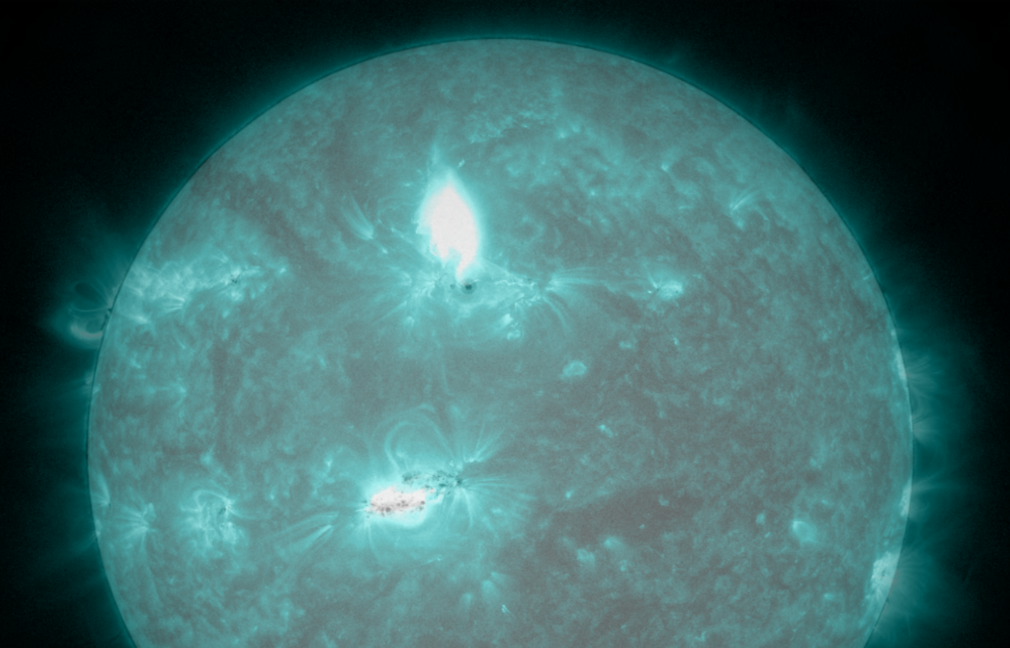
NOAA 3614 is the return of NOAA 3590, the largest sunspot region so far this solar cycle and the source of 3 X-class flares during its previous transit over the solar disk (see the discussions in the STCE news items at https://www.stce.be/news/687/welcome.html and https://www.stce.be/news/688/welcome.html ). On 23 March, it produced a long-duration X1.1 flare peaking at 01:33UTC. It was accompanied by a strong flare over NOAA 3615, the currently largest and most complex sunspot region on the solar disk. This is called a sympathetic flare, with more info on this kind of features in this newsitem (https://www.stce.be/news/249/welcome.html ). The images underneath show the active regions in white light and extreme ultraviolet (EUV; SDO/AIA 171 - https://sdo.gsfc.nasa.gov/data/aiahmi/ ) highlighting the magnetic links (coronal loops) connecting both active regions prior to the eruption. It is followed by an EUV image of the Sun in muti-million degrees (AIA 131) overlaid on a white light image showing the flares going on at the time of the peak of the X1 flare and their location with respect to the sunspot regions. Clips are available in the online version of the associated newsflash at https://www.stce.be/news/692/welcome.html , and shows the eruptions, the coronal wave and the post-eruption coronal loops ("arcade").
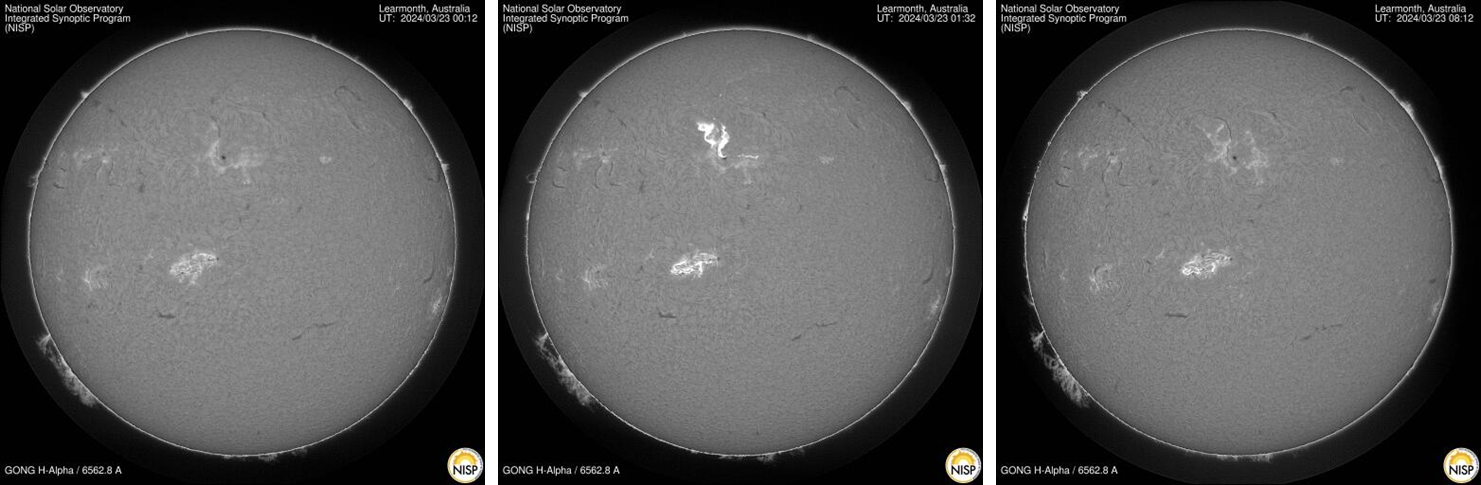
The X-class flare was triggered by the eruption of an unstable filament to the north of NOAA 3614's main spot. This filament has also been the location of a weaker (C5.8) but certainly equally impressive solar flare on 21 March, as shown in the online clip at "cold" temperatures of around 80.000 degrees (AIA 304). From the H-alpha images underneath (NSO/GONG - Learmonth - https://gong2.nso.edu/products/tableView/table.php?configFile=configs/hAlpha.cfg ), it is clear that this filament has reformed after the X1 eruption and thus may still be the source of another strong flare during the coming days.
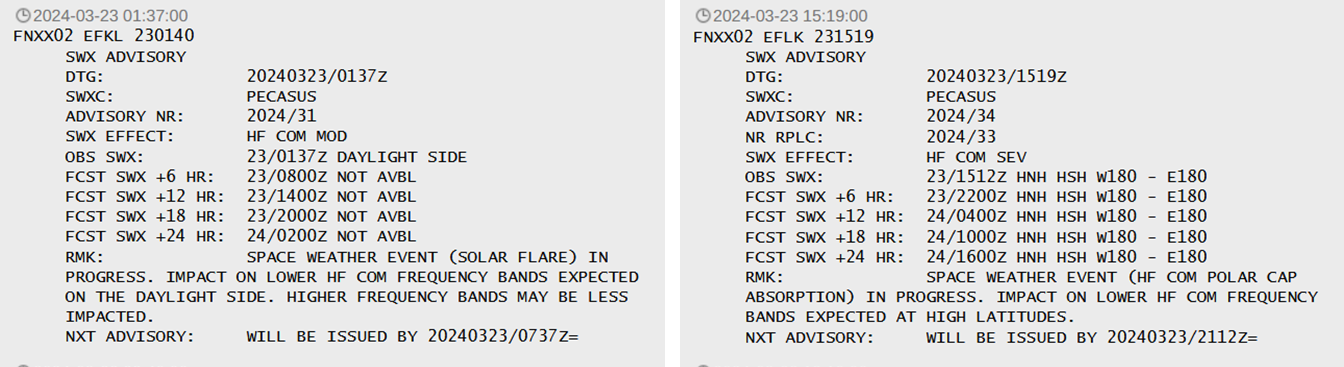
The strong 23 March eruption was associated with a proton event that started at 08:15UTC. It has become the strongest proton event so far this solar cycle, and reached a maximum of 956 pfu at 18:20UTC (GOES-18 ; https://www.swpc.noaa.gov/products/goes-proton-flux ). PECASUS (https://pecasus.eu/ ) has sent several advisories for disturbed High Frequency (3-30 MHz) radio communications resp. for the dayside during the X1 flare, and later during the day for the polar regions as a result of the proton event ("Polar Cap Absorption").
Relatively mild radio bursts were recorded at all observed radio frequencies (NOAA/USAF - https://www.swpc.noaa.gov/products/solar-and-geophysical-event-reports ). A type II radio burst (STCE SWx classification page - https://www.stce.be/educational/classification#radio ) indicated the presence of a coronal mass ejection (CME). A full halo CME was subsequently observed in coronagraphic imagery (SOHO/LASCO - http://sohowww.nascom.nasa.gov/data/realtime-images.html ) starting at 01:36UTC, and with a true speed of around 1500 km/s.
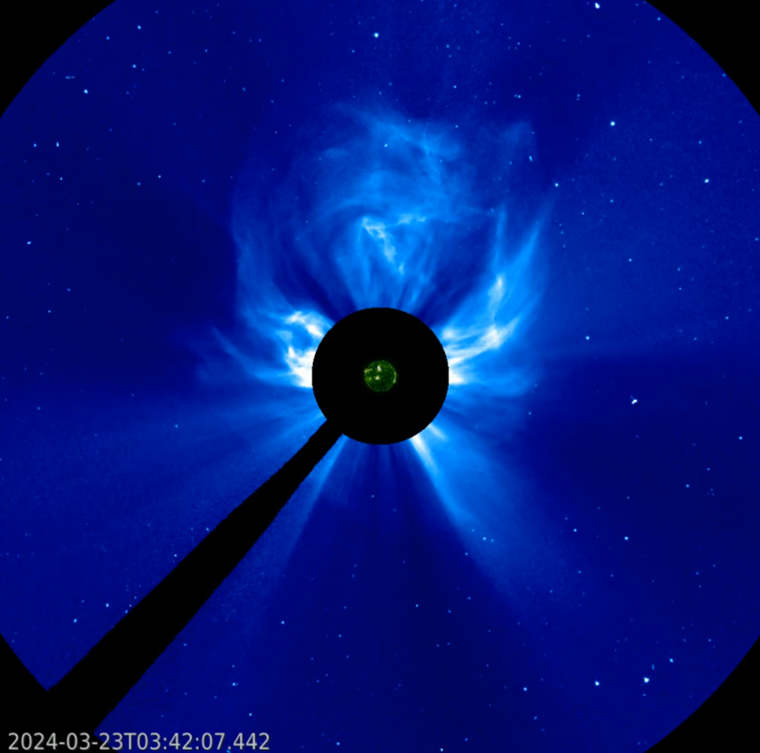
On its way to Earth, this fast interplanetary CME passed by Solar Orbiter around 13:30UTC on 23 March (Imperial College - https://www.imperial.ac.uk/space-and-atmospheric-physics/ ) indicating an early arrival at Earth a day later. DSCOVR (https://www.swpc.noaa.gov/products/real-time-solar-wind ) recorded indeed a shock in the solar wind parameters on 24 March at 14:11UTC (ACE - https://izw1.caltech.edu/ACE/ASC/DATA/Shocks/shocks.html ). It was followed by a storm sudden commencement (SSC) recorded by magnetometer stations around the world. Also the Dourbes Geophysical Observatory in Belgium recorded an SSC at 14:37UTC (chart in the online version; Intermagnet/BGS: https://imag-data.bgs.ac.uk/GIN_V1/GINForms2 ). The already enhanced solar wind speed jumped from values near 550 km/s to values around 800 km/s. The vertical component of the Interplanetary Magnetic Field (IMF) turned strongly southward and reached -27 nT during the first hour of the ICME passage. The Bz component then turned mostly positive for the subsequent hours, with the proper magnetic cloud (the "CME core") arriving around 18:30UTC.
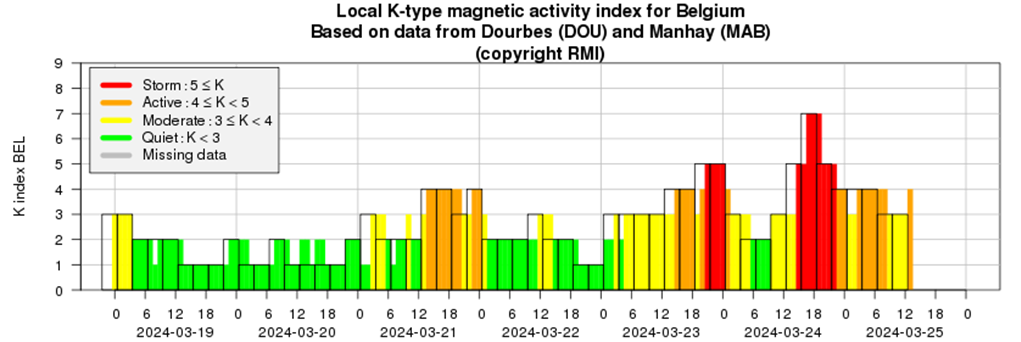
The provisional Kp index was at severe levels (8+) during the 15-18UTC interval (Potzdam GFZ ; https://kp.gfz-potsdam.de/en/), the K-BEL (Dourbes ; http://ionosphere.meteo.be/geomagnetism/K_BEL/ ) reported a strong geomagnetic storm (7) during the same interval. Because of the evolution of the solar wind parameters, geomagnetic activity remained at severe storm levels for only a single interval and had returned already back to active levels by the end of the day. Kp wise, this storm was of the same intensity as the 23-24 April 2023 storm (8+), but in terms of Dst it remained well below that (resp. -130 nT vs -213 nT).
For a severe geomagnetic storm, the NOAA scale (https://www.swpc.noaa.gov/noaa-scales-explanation ) indicates that protective systems of power grids at higher latitudes may see some trippings and require some voltage corrections, satellites may suffer from charging or drag effects, and HF communications and GNSS applications may be impacted. Geostationary satellites such as GOES experienced magnetopause crossings as the ICME pushed the magnetopause inside the geostationary orbits, thus exposing these satellites to the turbulent solar wind in the magnetosheath (GOES-16 ; https://www.swpc.noaa.gov/products/goes-magnetometer ). PECASUS (https://pecasus.eu/ ) has sent several advisories for disturbed High Frequency (3-30 MHz) radio communications due to auroral absorption and post-storm depression (higher HF frequencies not available).
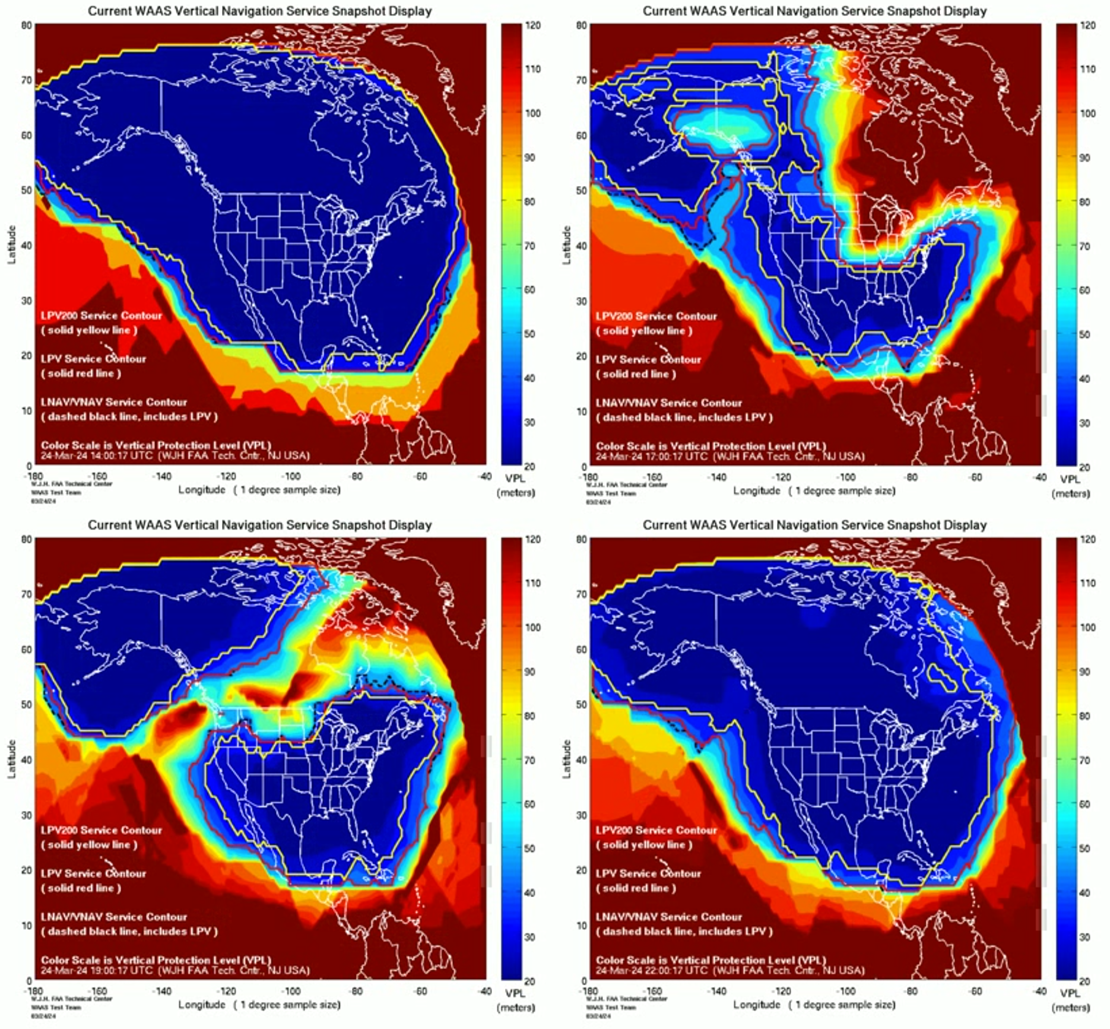
Also several advisories for disturbed Global Navigation Satellite Systems (GNSS) have been sent. The compilation underneath shows that some of these applications did not reach their typical accuracy over North-America (WAAS - https://www.nstb.tc.faa.gov/realtime-plots.html ) during the most intense phase of the geomagnetic storm. Blue colours mean small errors, red/brown means significantly degraded accuracy. LPV-200 (Localizer Performance with Vertical guidance) delivers accurate information on an aircraft's approach to a runway with the use of GNSS positioning technology. The result is lateral and angular vertical guidance without the need for visual contact with the ground until an aircraft is 200 feet (60 meters) above the runway (see EUSPA - https://www.euspa.europa.eu/news/egnos-lpv-200-enables-safer-aircraft-landings ). Clearly, this GNSS application was significantly disturbed over Canada and Alaska for a few hours.
Polar lights were photographed from the UK, Australia and New Zealand (50 degrees geomagnetic latitude), but remained far from the grandeur of the March (https://www.stce.be/news/638/welcome.html ) and April (https://www.stce.be/news/642/welcome.html ) 2023 aurora.
Feel and see - Parker Solar Probe and Solar Orbiter team up
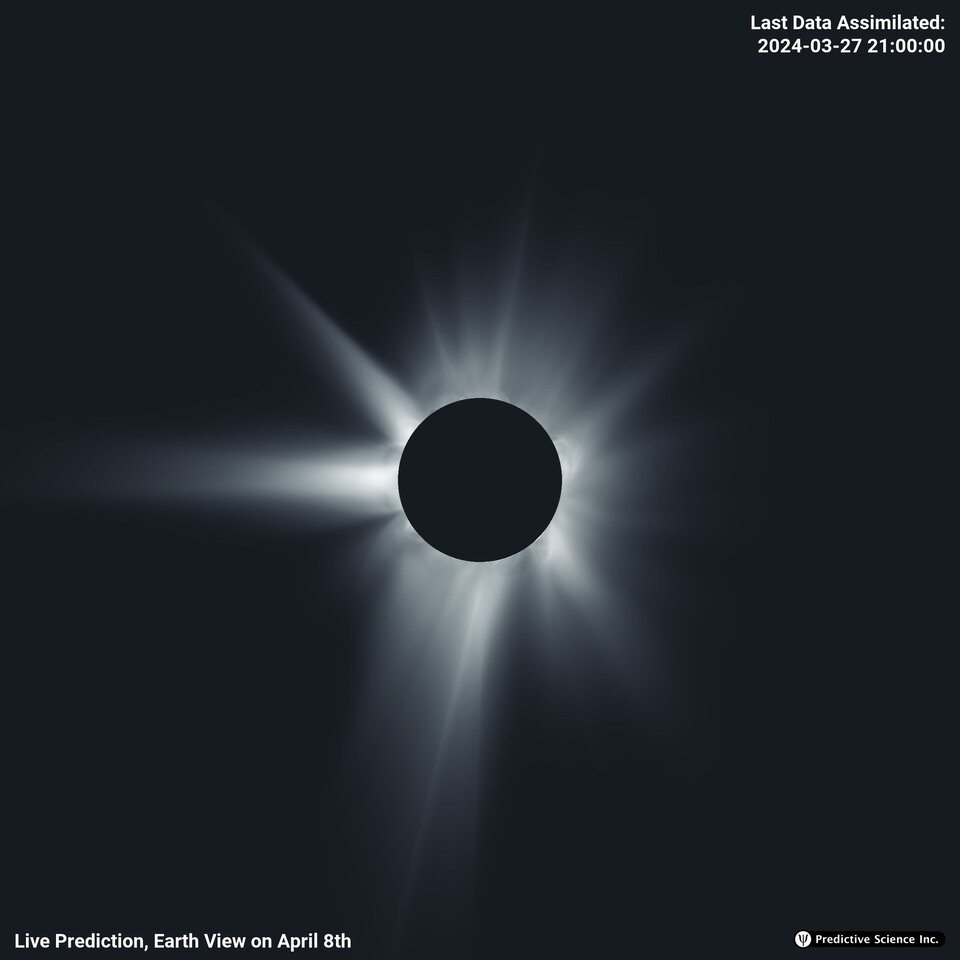
The spacecrafts Parker Solar Probe and Solar Orbiter team up as they are in a position in space where they can complement each others observations. Parker Solar Probe can make in situ measurements of the solar wind at a distance of only 7.3 million km from the Sun (which is very very close), while Solar Orbiter can see from a distance what is happening at that position. In this way, two senses are combined: feel and see.
Andrei Zhukov from the STCE has a particular interest in this unique observation campaign. He hopes to feel and see the birth of a coronal mass ejection.
What Solar Orbiter is seeing at this moment, will also be used to predict how the corona will look like during the total solar eclipse of April 8 2024.
Exciting!
Check it out: https://www.esa.int/Science_Exploration/Space_Science/Solar_Orbiter/ESA_and_NASA_team_up_to_study_solar_wind
PITHIA-NRF news
Plasmasphere ionosphere thermosphere acces to services, data and research facilities - interested?
Yes, check out the 5th newsletter of PITHIA-NRF: https://pithia-nrf.eu/pithia-nrf-users/newsletters

Review of space weather
Solar Active Regions (ARs) and flares
Solar flaring activity reached very high levels on 23 Mar as an X1.1 flare was registered at 01:33 UTC. It also reached high levels on 20 Mar as an M7 was detected at 07:36 UTC and on 24 Mar as nine M-class flares were observed. In total 1 X-class flare and 25 M-class flares were registered. NOAA Active Region (AR) 3614 (magnetic configuration Beta, Catania sunspot group 21) produced the X-class flare and an M1 on 18 Mar. Most of the M-class flaring activity was registered from NOAA 3615 (first with magnetic configuration Beta-Gamma and then Beta-Gamma-Delta, Catania sunspot group 22), including an M7 flare on 20/3 07:36 UTC.
Coronal mass ejections
A halo Coronal Mass Ejection (CME) was registered in LASCO-C2/SOHO images on 23 Mar. It was associated with the X1.1 flare. The ejecta was exceptionally fast and arrived in the Earth's environment on 24 Mar.
Coronal Holes
A Coronal Hole (CH) with negative polarity crossed the solar central meridian on 21 Mar.
Proton flux levels
A major proton event took place starting from 23 Mar. The greater than 10 MeV proton flux started increasing at 23 Mar 04:00 UTC and crossed the 10 pfu alert threshold level at 08:25 UTC the same day. It became a major event when it crossed the 100 pfu threshold level later that day at 14:10 UTC. It peaked twice, the first time at 23 Mar 18:25 UTC at 870 pfu and the second time at 24 Mar 12:25 UTC at 880 pfu, as measured by GOES 16. The flux dropped below the 100 pfu level at 24 Mar 19:45, but remain above the 10 pfu threshold for the rest of the past week.
Electron fluxes at GEO
The greater than 2 MeV electron flux, as measured by the GOES-16 satellite, was bellow the 1000 pfu threshold throughout the past week. The 24h electron fluence was at nominal levels during the same period.
Solar wind
On 18 Mar the Solar Wind conditions registered a short-lived disturbance that was either due to a stealth CME or a compression region caused by a faster stream compressing a slower stream ahead of it. The SW speed increased from 300 km/s to 400 km/s, the total interplanetary magnetic field (Bt) varied between 2 nT and 11 nT, and its North-South component (Bz) fluctuated between -11 nT and 5 nT. The interplanetary magnetic field phi angle was directed both towards and away from the Sun during the disturbance.
The conditions returned to the slow SW regime the next day only to be excited again with the arrival of a CME on 21 Mar that lasted until 22 Mar 17:30 UTC. The SW speed increased again from 300 km/s to 400 km/s, Bt varied between 1 nT and 15 nT, and Bz fluctuated between -12 nT and 11 nT. The interplanetary magnetic field phi angle was directed both towards and away from the Sun during the same period.
A High Speed Stream (HSS), associated with the CH crossing of the 21 Mar, arrived later on 22 Mar 23:00 UTC. It caused the SW speed to increase to 500 km/s, while Bt was constant at 10 nT and Bz at 5 nT. The interplanetary magnetic field phi angle was directed away from the Sun during the event.
A fast forward shock ahead of the halo CME of 23 Mar reached the Earth's environment at 24 Mar 14:11 UTC. The solar wind speed jumped from 628 km/s to 821 km/s and the Bt jumped from 11 nT to 17 nT and started to fluctuate reaching a maximum value of 34 nT at 24 Mar 16:05 UTC. Initially, between 14:30 and 15:50 UTC, the Bz component was mostly negative with a minimum value of -27 nT and then from 15:50 UTC turned mostly positive. The Bt started to decrease slowly from 31 nT at 19:30 UTC. After the initial shock, the solar wind speed increased further and reached a maximum value of 880 km/s at 24 Mar 18:21 UTC and remained above 800 km/s for the rest of the day.
Geomagnetism
At the start of the past week, geomagnetic conditions were globally and locally quiet to unsettled (NOAA Kp 0+ to 3+ and K BEL 1 to 3) until the arrival of the CME of 21 Mar. Minor storm conditions were registered globally (NOAA Kp 5 at 12:00-18:00 UTC and Kp 5- at 18:00-21:00 UTC) as a result, but during the same period the local conditions only reached active to unsettled levels (K BEL 4 at 12:00-18:00 UTC and at 21:00-24:00 UTC).
The conditions went back to quiet to unsettled levels globally (NOAA Kp 1+ to 3-) from 22 Mar 03:00 UTC to 23 Mar 03:00 UTC, while locally the quiet to unsettled levels (K BEL 1 to 3) lasted from 22 Mar 00:00 UTC to 23 Mar 12:00 UTC.
A new period of globally minor storm conditions started at 23 Mar 03:00 UTC (NOAA Kp 5 03:00-06:00 UTC, 5- 06:00-09:00 UTC and 18:00-21:00 UTC) that reached the moderate storm level (NOAA Kp 6-) at 21:00-24:00 UTC and dropped to minor storm (NOAA Kp 5-) at 24 Mar 00:00-03:00 UTC. Locally minor storm conditions (K BEL 5) where only observed that day during the 18:00-24:00 UTC period.
The arrival of the fast halo CME on 24 Mar caused a further major increase to the geomagnetic conditions. At the global level, moderate storm conditions were first registered (NOAA Kp 6 at 12:00-15:00 UTC), which increased to the severe storm level (NOAA Kp 8) for a short period (15:00-18:00 UTC) as they fast subsided to moderate storm (NOAA Kp 6+) at 18:00-21:00 UTC and active levels (NOAA Kp 4) at 21:00-24:00 UTC. At the local level, minor storm conditions (K BEL 5) were recorded at 12:00-15:00 UTC, that were increased to major storm (K BEL 7) at 15:00-18:00 and then were reduced to minor storm conditions (K BEL 5) at 18:00-21:00 UTC.
International Sunspot Number by SILSO
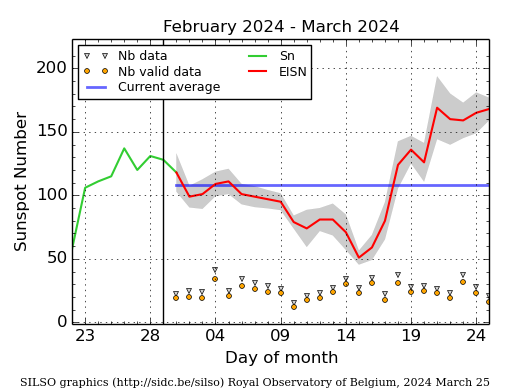
The daily Estimated International Sunspot Number (EISN, red curve with shaded error) derived by a simplified method from real-time data from the worldwide SILSO network. It extends the official Sunspot Number from the full processing of the preceding month (green line), a few days more than one solar rotation. The horizontal blue line shows the current monthly average. The yellow dots give the number of stations that provided valid data. Valid data are used to calculate the EISN. The triangle gives the number of stations providing data. When a triangle and a yellow dot coincide, it means that all the data is used to calculate the EISN of that day.
Noticeable Solar Events
| DAY | BEGIN | MAX | END | LOC | XRAY | OP | 10CM | TYPE | Cat | NOAA |
| 18 | 0321 | 0332 | 0345 | M2.7 | III/1 | 3612 | ||||
| 18 | 0406 | 0414 | 0424 | M1.0 | 21 | 3614 | ||||
| 18 | 1902 | 1919 | 1928 | M6.7 | 3615 | |||||
| 19 | 0224 | 0229 | 0238 | M1.4 | 22 | 3615 | ||||
| 19 | 2317 | 2327 | 2332 | S16E57 | M2.1 | SN | 22 | 3615 | ||
| 20 | 0723 | 0736 | 0747 | S10E51 | M7.4 | 3B | 22 | 3615 | ||
| 20 | 2246 | 2255 | 2300 | M1.9 | 22 | 3615 | ||||
| 22 | 2018 | 2032 | 2045 | S13E22 | M4.2 | 2B | 22 | 3615 | ||
| 22 | 2120 | 2122 | 2125 | S14E18 | M1.1 | SN | 22 | 3615 | ||
| 23 | 0058 | 0133 | 0221 | N27E8 | X1.1 | 2F | VI/2CTM/1II/2 | 21 | 3614 | |
| 23 | 0647 | 0655 | 0659 | S13E4 | M1.1 | SF | 22 | 3615 | ||
| 23 | 0701 | 0709 | 0726 | M2.4 | 22 | 3615 | ||||
| 23 | 0726 | 0738 | 0747 | M3.1 | 22 | 3615 | ||||
| 23 | 1122 | 1129 | 1136 | S15E10 | M1.0 | SF | CTM/1 | 22 | 3615 | |
| 23 | 1236 | 1247 | 1256 | S15E9 | M1.3 | 1B | 22 | 3615 | ||
| 23 | 1304 | 1311 | 1320 | M1.1 | 22 | 3615 | ||||
| 23 | 1331 | 1337 | 1344 | M1.9 | III/2 | 22 | 3615 | |||
| 23 | 1351 | 1402 | 1415 | M5.3 | 22 | 3615 | ||||
| 23 | 1449 | 1453 | 1458 | M1.5 | 22 | 3615 | ||||
| 23 | 1501 | 1513 | 1517 | M3.8 | 22 | 3615 | ||||
| 23 | 1517 | 1522 | 1527 | M3.7 | ||||||
| 23 | 1622 | 1651 | 1707 | M2.8 | 22 | 3615 | ||||
| 23 | 2330 | 2349 | 0003 | S12E1 | M2.4 | 2N | 22 | 3615 | ||
| 24 | 0112 | 0125 | 0130 | M1.4 | 22 | 3615 | ||||
| 24 | 0143 | 0154 | 0157 | S14E0 | M2.1 | 2N | 22 | 3615 | ||
| 24 | 0157 | 0205 | 0209 | M2.3 | CTM/1 | 22 | 3615 | |||
| 24 | 0209 | 0218 | 0229 | M2.7 | 22 | 3615 | ||||
| 24 | 0559 | 0606 | 0610 | S14W3 | M2.2 | 1B | 22 | 3615 | ||
| 24 | 0736 | 0751 | 0806 | S14W3 | M1.3 | 2N | III/1 | 22 | 3615 | |
| 24 | 1210 | 1218 | 1222 | S14W5 | M1.1 | 1N | 22 | 3615 | ||
| 24 | 1227 | 1234 | 1239 | S13W7 | M1.0 | SF | 22 | 3615 | ||
| 24 | 1300 | 1313 | 1328 | M1.2 | CTM/1 | 22 | 3615 |
| LOC: approximate heliographic location | TYPE: radio burst type |
| XRAY: X-ray flare class | Cat: Catania sunspot group number |
| OP: optical flare class | NOAA: NOAA active region number |
| 10CM: peak 10 cm radio flux |
PROBA2 Observations (18 Mar 2024 - 24 Mar 2024)
Solar Activity
Solar flare activity fluctuated from low to high during the week.
In order to view the activity of this week in more detail, we suggest to go to the following website from which all the daily (normal and difference) movies can be accessed: https://proba2.oma.be/ssa
This page also lists the recorded flaring events.
A weekly overview movie (SWAP week 730) can be found here: https://proba2.sidc.be/swap/data/mpg/movies/weekly_movies/weekly_movie_2024_03_18.mp4.
Details about some of this week's events can be found further below.
If any of the linked movies are unavailable they can be found in the P2SC movie repository here: https://proba2.oma.be/swap/data/mpg/movies/.
Saturday March 23
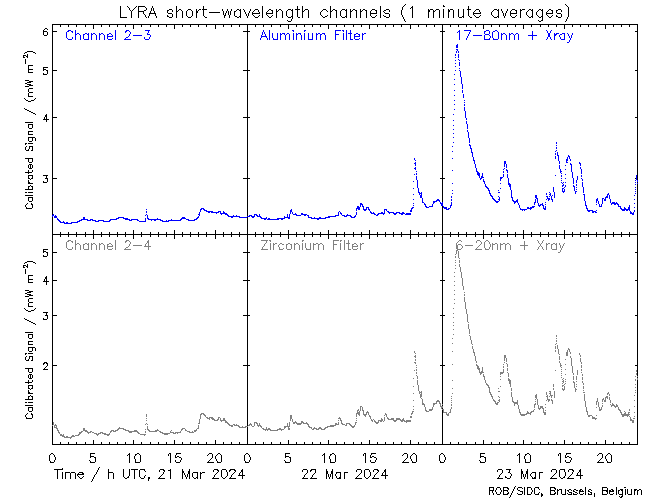
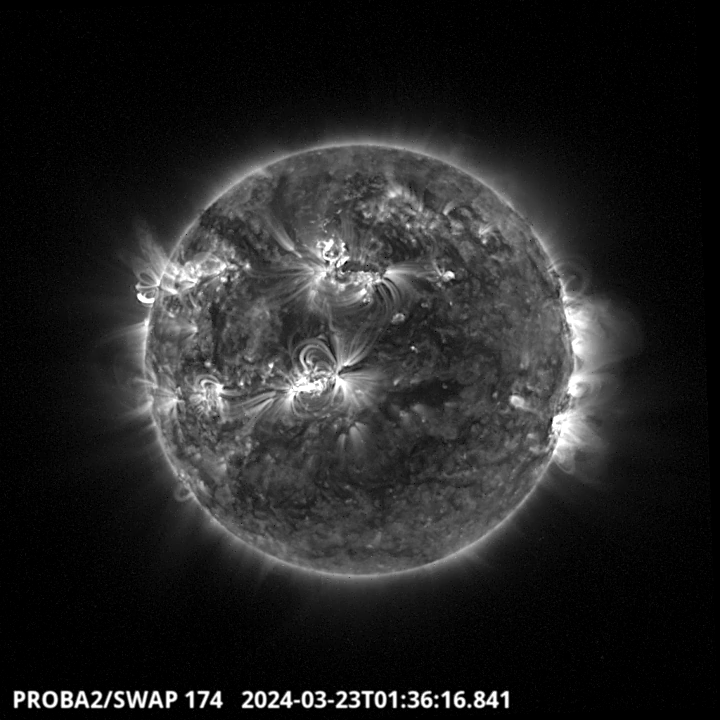
The largest flare of this week was an X1.1, and it was observed by LYRA (top panel) and SWAP (bottom panel). The flare peaked on 2024-Mar-23 at 01:33 UT. It occurred on the northern hemisphere close to the central meridian, and it originated from NOAA AR3614.
Find a SWAP movie of the event here: https://proba2.sidc.be/swap/movies/20240323_swap_movie.mp4.
Geomagnetic Observations in Belgium
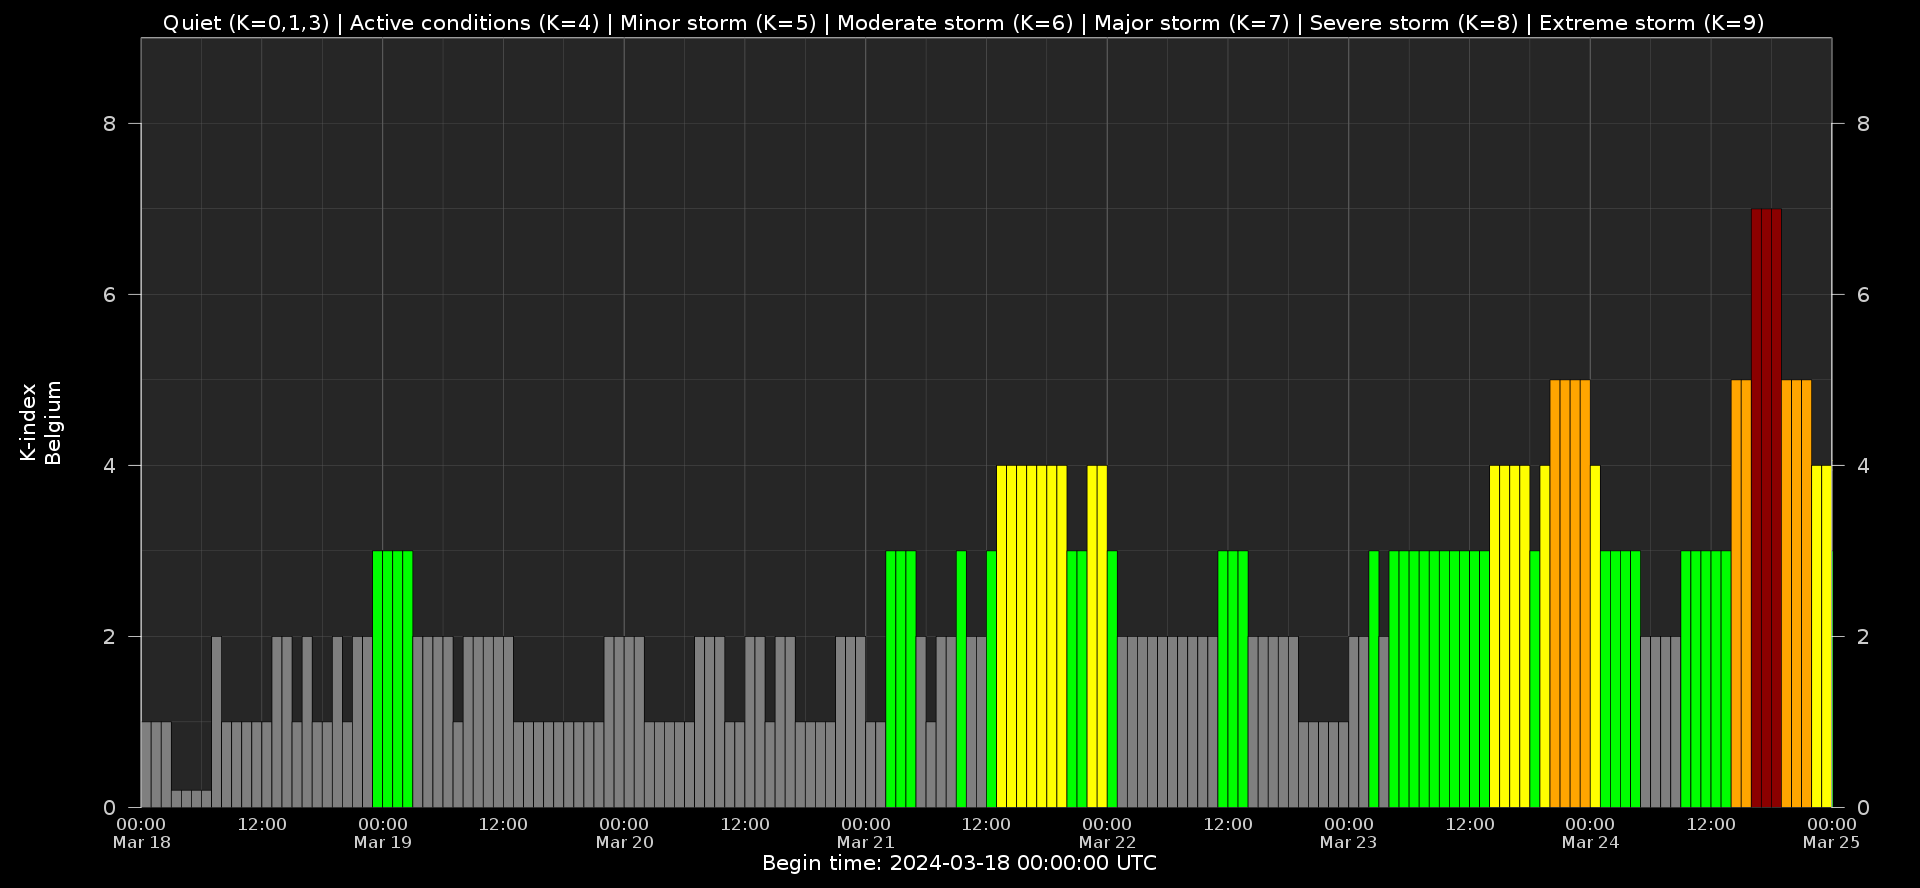
Local K-type magnetic activity index for Belgium based on data from Dourbes (DOU) and Manhay (MAB). Comparing the data from both measurement stations allows to reliably remove outliers from the magnetic data. At the same time the operational service availability is improved: whenever data from one observatory is not available, the single-station index obtained from the other can be used as a fallback system.
Both the two-station index and the single station indices are available here: http://ionosphere.meteo.be/geomagnetism/K_BEL/
The SIDC space weather briefing
The forecaster on duty presented the SIDC briefing that gives an overview of space weather from Mar 17 to 24.
The pdf of the presentation can be found here: https://www.stce.be/briefings/20240325_SWbriefing.pdf
Review of Ionospheric Activity
NEW! The time series below illustrates (in green) the VTEC deviation from normal quiet behaviour.

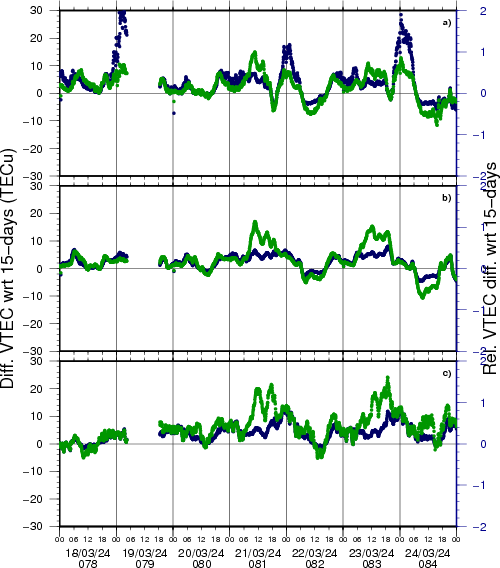
VTEC time series at 3 locations in Europe from 18 Mar 2024 till 24 Mar 2024
The top figure shows the time evolution of the Vertical Total Electron Content (VTEC) (in red) during the last week at three locations:
a) in the northern part of Europe(N 61deg E 5deg)
b) above Brussels(N 50.5deg, E 4.5 deg)
c) in the southern part of Europe(N 36 deg, E 5deg)
This top figure also shows (in grey) the normal ionospheric behaviour expected based on the median VTEC from the 15 previous days.
The time series below shows the VTEC difference (in green) and relative difference (in blue) with respect to the median of the last 15 days in the North, Mid (above Brussels) and South of Europe. It thus illustrates the VTEC deviation from normal quiet behaviour.
The VTEC is expressed in TECu (with TECu=10^16 electrons per square meter) and is directly related to the signal propagation delay due to the ionosphere (in figure: delay on GPS L1 frequency).
The Sun's radiation ionizes the Earth's upper atmosphere, the ionosphere, located from about 60km to 1000km above the Earth's surface.The ionization process in the ionosphere produces ions and free electrons. These electrons perturb the propagation of the GNSS (Global Navigation Satellite System) signals by inducing a so-called ionospheric delay.
See http://stce.be/newsletter/GNSS_final.pdf for some more explanations; for more information, see https://gnss.be/SpaceWeather
STCE courses and lectures
Courses and presentations with the Sun-Space-Earth system and Space Weather as the main theme. We provide occasions to get submerged in our world through educational, informative and instructive activities.
* April 4, STCE seminar, Korean Space Weather Center: action for Space Weather, Brussels, Belgium
* April 22-24, STCE Space Weather Introductory Course, Brussels, Belgium - Registrations are open
* April 26, Public presentation Proba-3: a solar eclipse maker, MIRA, Grimbergen
* April 30, Solar physics and Space Weather: Proba-2 and Proba-3, online course - Registrations are open
* May 3, STCE seminar, An Echo of the Sun, Brussels, Belgium
* May 6, An Echo of the Sun, PhD defense Pepa Ivanova, Brussels, Belgium
* May 13, lecture by the STCE, From physics to forecasting, ESA Space Weather Training Course 2024, Euro Space Center, Redu, Belgium
* may 14, STCE Seminar, Segmentation, grouping and classification of sunspots from ground-based observations using deep learning methods, Brussels, Belgium
* May 13 - 17, lectures by the STCE, solar and heliospheric weather; magnetosphere, ionosphere, aviation, and ground based impact, Course Operational Space Weather Fundamentals, L'Aquila, Italy
* May 18, Public presentation, The PROBA-3 Mission: Artificial Total Solar Eclipse in Space, FotonFest, Urania, Hove, Belgium
* May 28, Solar physics and Space Weather: Solar Orbiter Spacecraft, online course - Registrations are open
* June 9, Public presentation Total Eclipse of the Sun, Helios, Averbode, Belgium
* June 25, Solar physics and Space Weather: predictions and services, online course - Registrations are open
* June 27, STCE annual meeting, Brussels, Belgium
* June 28, public presentation Help! Het stormt in de ruimte!?, Wetenschappelijke middagen, Brussels, Belgium
To register for a course or lecture, check the page of the STCE Space Weather Education Center: https://www.stce.be/SWEC
If you want your event in the STCE newsletter, contact us: stce_coordination at stce.be