- Table of Content
- 1.Earth under at...
- 2.PROBA2 Observa...
- 3.Space Weather ...
- 4.Review of sola...
- 5.Noticeable Sol...
- 6.The Internatio...
- 7.Review of geom...
- 8.Geomagnetic Ob...
- 9.Review of iono...
- 10.Future Events
2. PROBA2 Observations (4 Sep 2017 - 10 Sep 2017)
3. Space Weather Briefing
4. Review of solar activity
5. Noticeable Solar Events (4 Sep 2017 - 10 Sep 2017)
6. The International Sunspot Number
7. Review of geomagnetic activity
8. Geomagnetic Observations at Dourbes (4 Sep 2017 - 10 Sep 2017)
9. Review of ionospheric activity (4 Sep 2017 - 10 Sep 2017)
10. Future Events
Earth under attack
The sunspot group that caused the space weather trouble in the previous days is still in a furious mood. On September 10, 16:06 UT it produced an X8.9 light flash - an extreme flare.
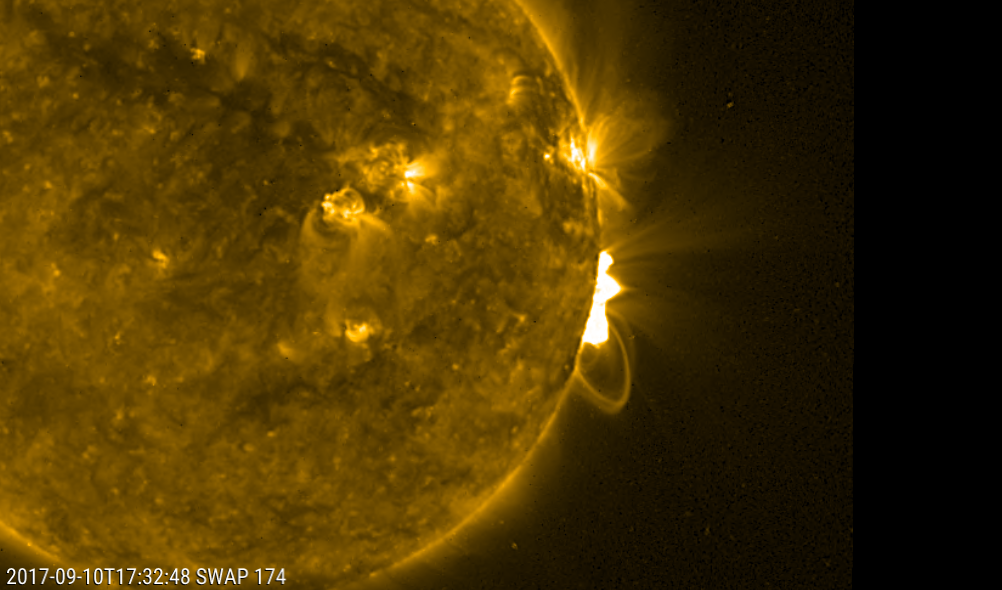
The PROBA2 team captured the light flash in a movie showing the Sun in extreme UV. Click on the picture and you will get there. Check the movie: http://www.stce.be/movies/swap_X8_2_2017_08_02_logos_compressed.mp4
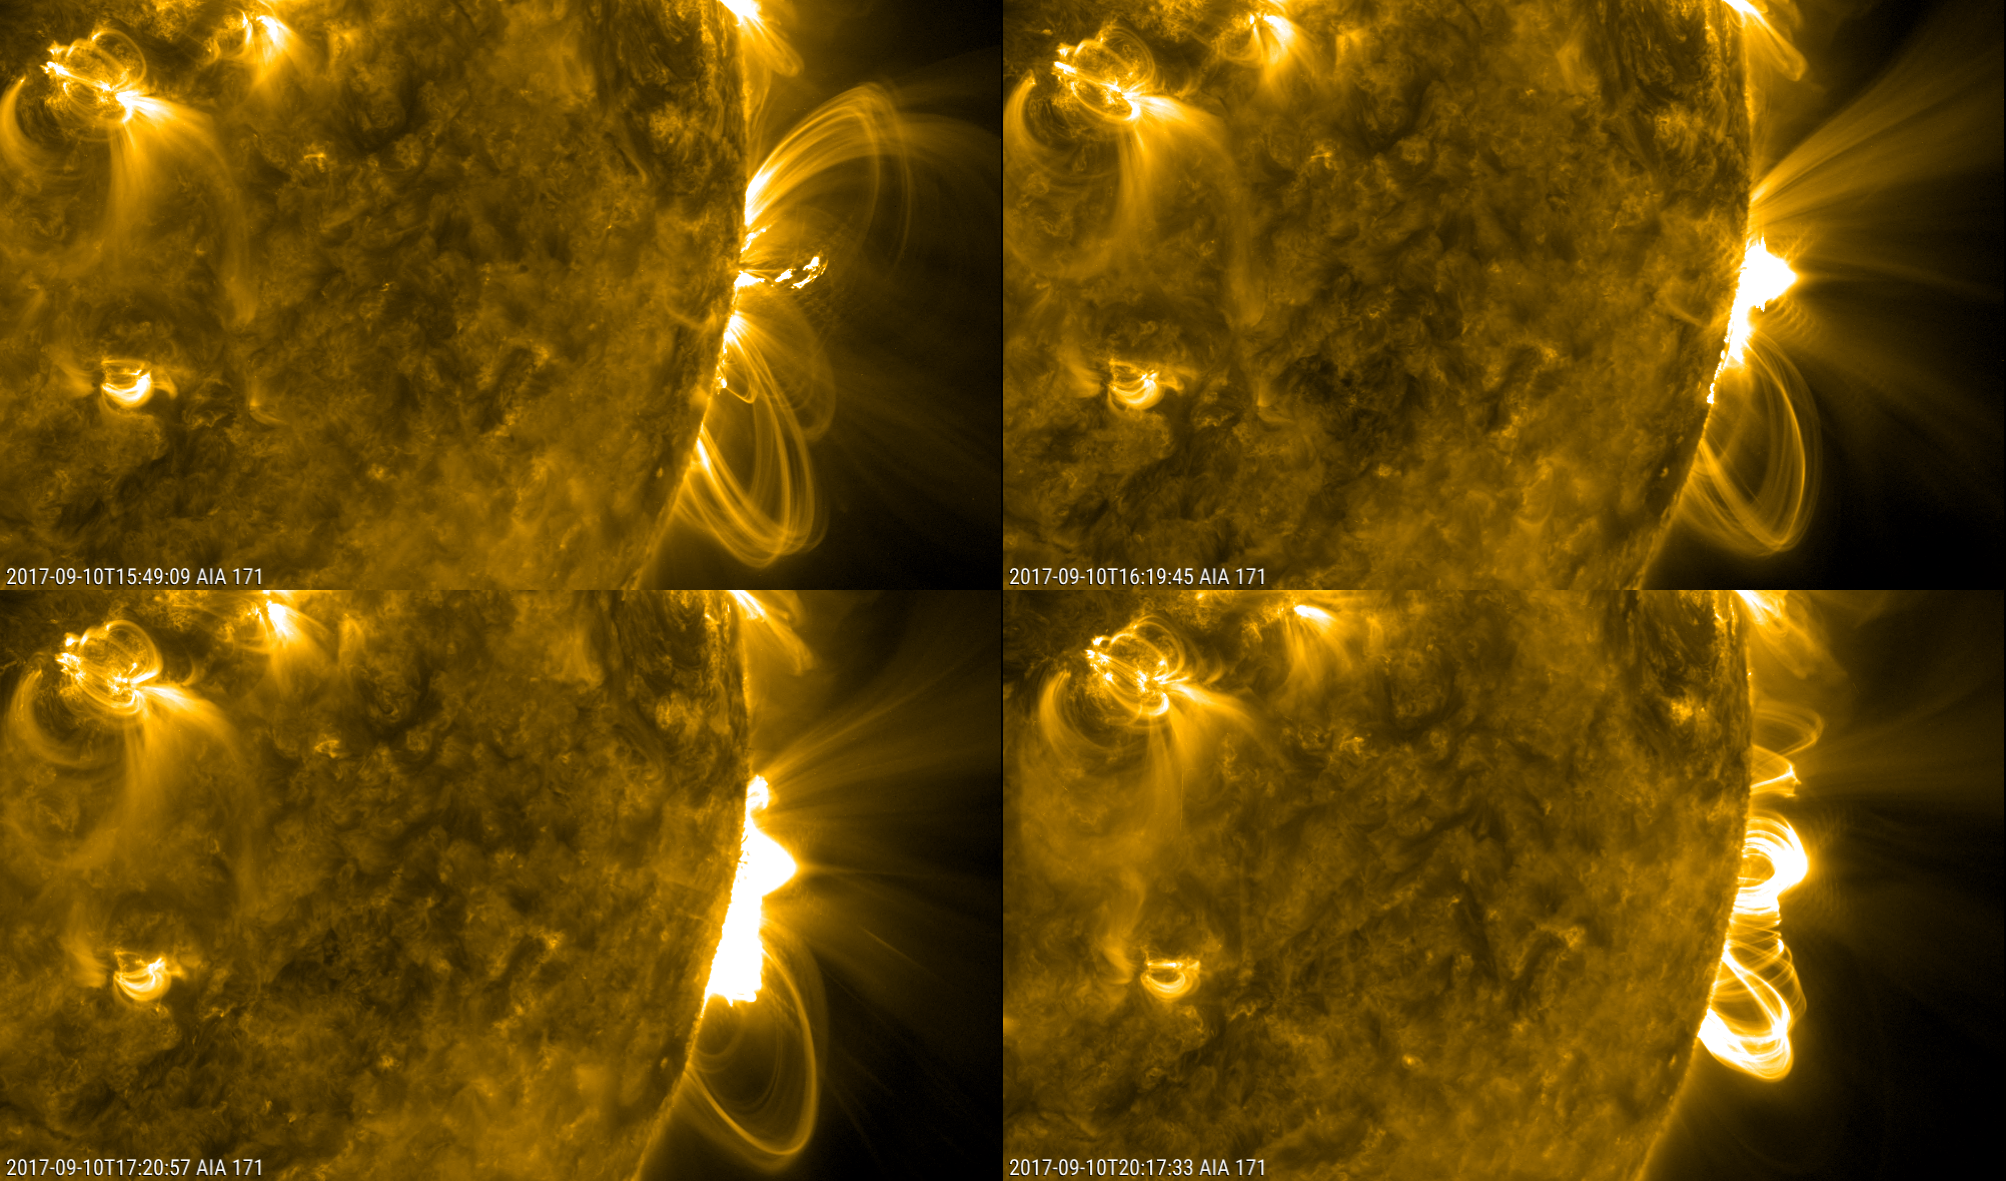
The telescope AIA onboard of SDO made these pictures in the extreme UV. Click on the image for a larger version.
At the same time, a plasma cloud was blown into space with a speed of probably more than 2500 km/s. For comparison, the speed of the cloud that left the Sun on September 6 was around 1100-1200 km/s. Since this cloud is ejected not fully in the direction of the Earth, we will experience a glancing blow from it. Nevertheless, the plasma cloud will cause a geomagnetic storm. How strong? We will see. The SIDC forecast centre expects it tomorrow, September 12, first part of the UT day!
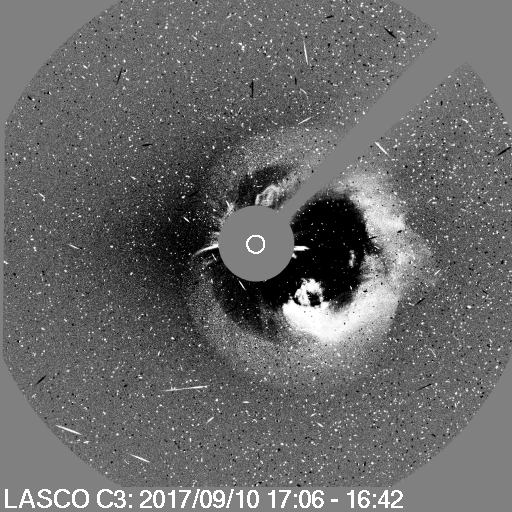
This is what the cloud looks like in difference images of the articificial eclipse maker LASCO onboard of the spacecraft SOHO. It is a difference image: two images at a different time are substracted to highlight what has changed in the meantime. LASCO shows you the space environment close to the Sun.
More proof that the Sun is hot-tempered these days? Next to the light and mass solar storms, the Sun threw a particle storm into our direction. The dots in the image above are those particles when they hit the telescope LASCO. The particles follow the magnetic highways towards the south or north pole of the Earth where they can penetrate our atmosphere. The energy of these particles was in this case so high that they caused a Ground Level Event. A GLE occurs when at the Earth's surface an increased level of radiation is measured. At least 5 stations reported a GLE. The reporting stations are located at a high latitude, for example in Oulu, Finland. Dourbes, Belgium didn't measure a GLE. A GLE is exceptional. Luckily this GLE is a small event as it adds only a little extra to the usual radiation dose on for example transpolar flights.
PROBA2 Observations (4 Sep 2017 - 10 Sep 2017)
Solar Activity
Solar flare activity fluctuated between moderate and very high during the week.
In order to view the activity of this week in more detail, we suggest to go to the following website from which all the daily (normal and difference) movies can be accessed: http://proba2.oma.be/ssa
This page also lists the recorded flaring events.
A weekly overview movie can be found here (SWAP week 389).
http://proba2.oma.be/swap/data/mpg/movies/weekly_movies/weekly_movie_2017_09_04.mp4
Details about some of this week’s events, can be found further below.
If any of the linked movies are unavailable they can be found in the P2SC movie repository here
http://proba2.oma.be/swap/data/mpg/movies/
Monday Sep 04
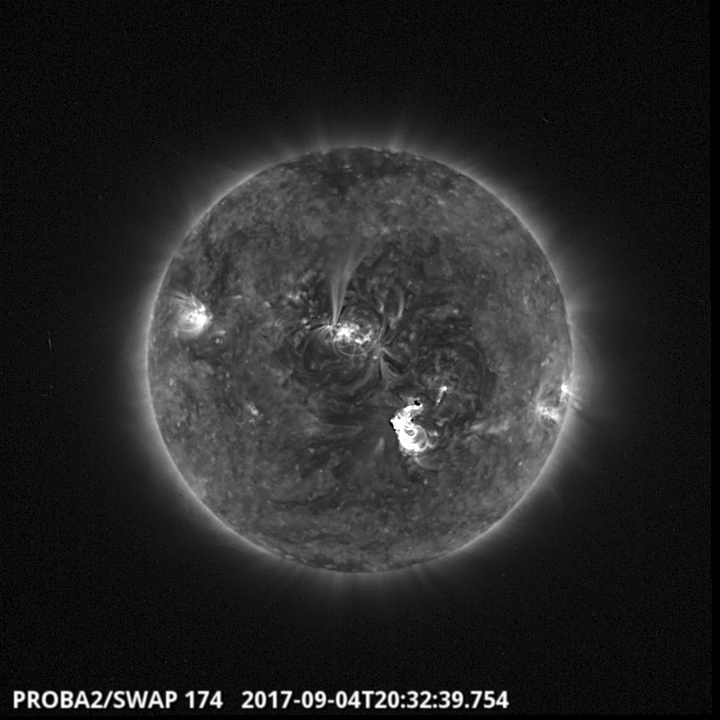
An M5.5 flare peaking at 18:48 UTC on 2017-Sep-04, was produced by NOAA active region 2673 in the South west part of the Sun, and can be seen in the SWAP image above. This active region, 2673, dominated the activity for the whole week. Find a movie of the events here (SWAP movie)
http://proba2.oma.be/swap/data/mpg/movies/20170904_swap_movie.mp4
Wednesday Sep 06
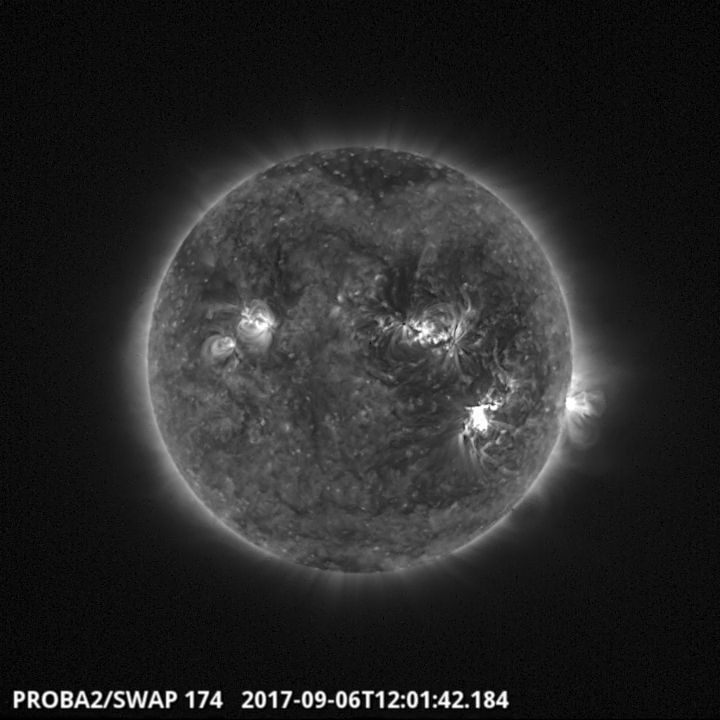
The Sun produced a strong solar X9.3 class flare on 2017-Sep-6. This flare occurred in NOAA AR 2673 peaking at 12:02 UT in the North-West part of the Sun with a full halo CME. It was preceded by many other strong flares, including an X2.2 class flare peaking at 09:10 UT.
The X9.3 class flare is the strongest observed since 2006-Dec-5, when a X9.0 class flare was observed. Since PROBA2 was only launched in 2009, this means that this is the strongest flare that has ever been observed by the solar instruments SWAP and LYRA on-board the satellite. Find a movie of the events here (SWAP movie)
http://proba2.oma.be/swap/data/mpg/movies/20170906_swap_movie.mp4
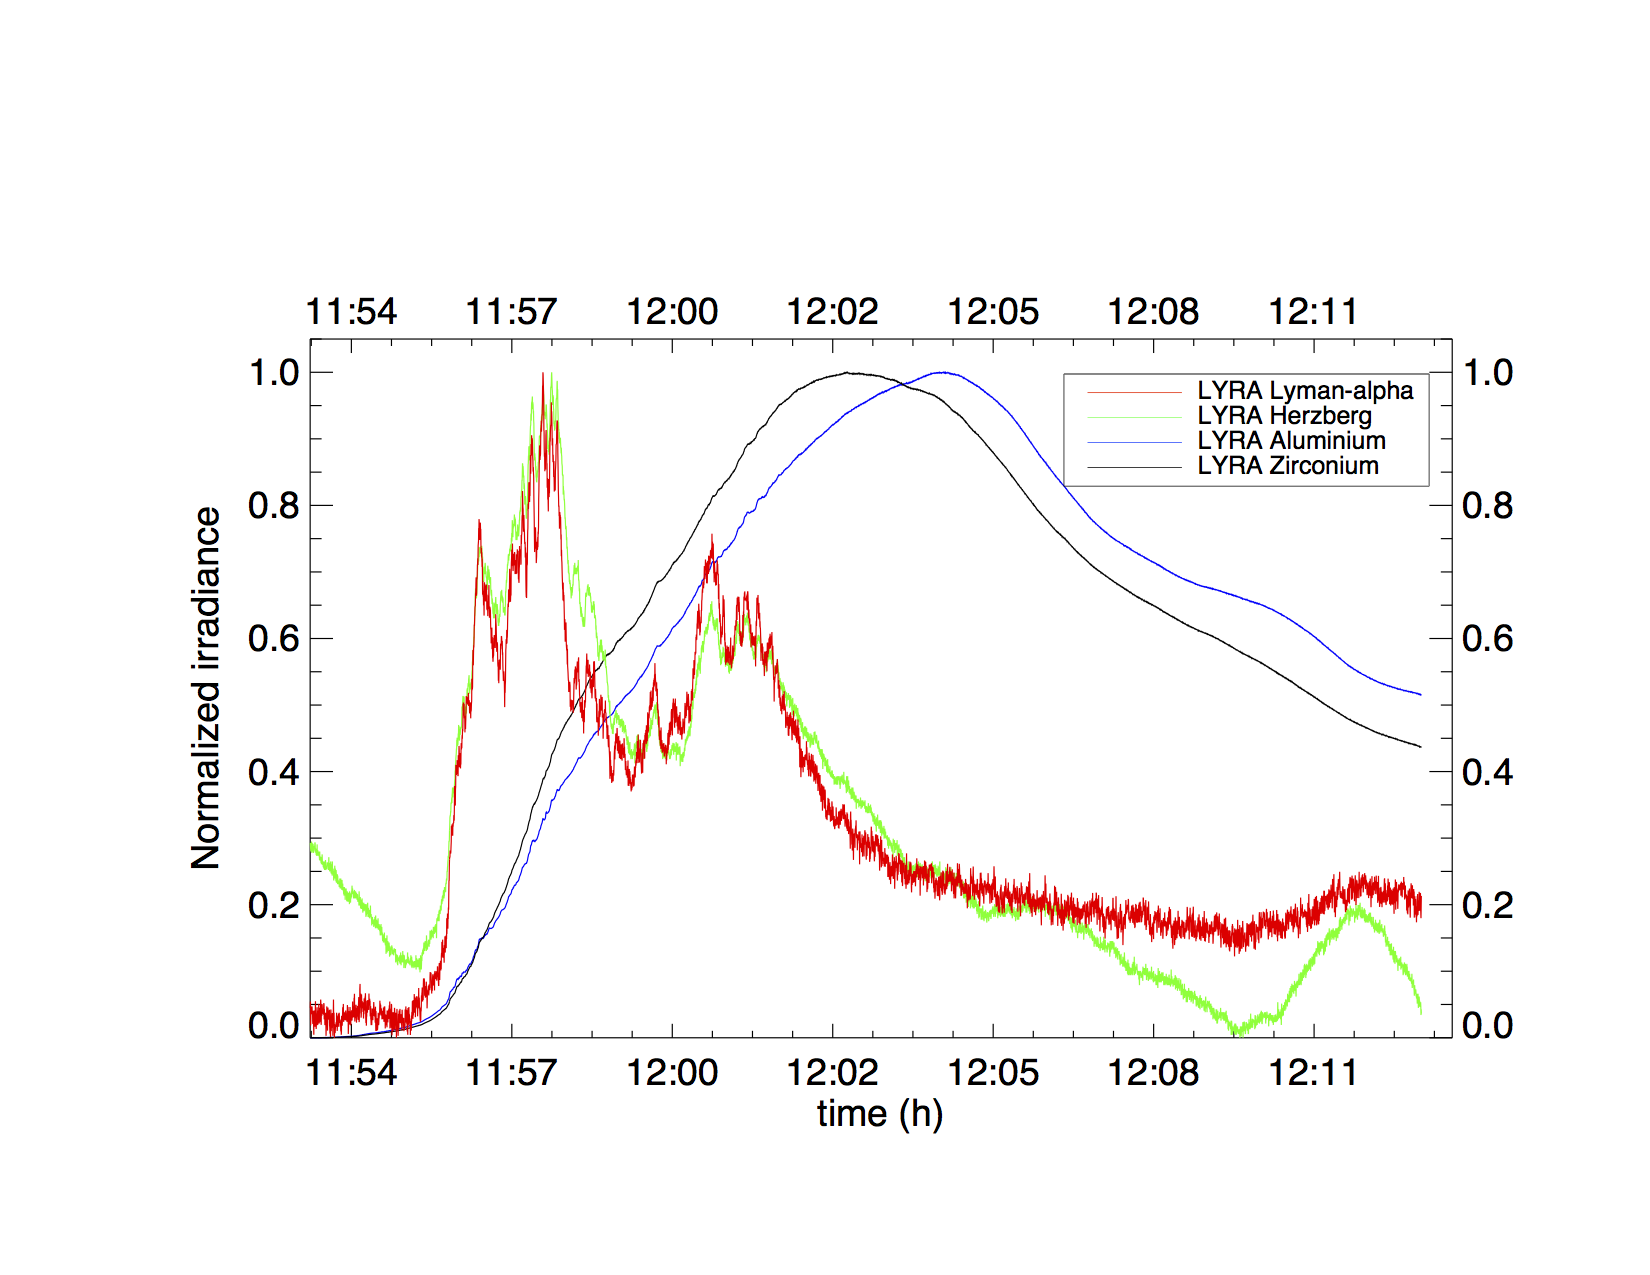
The image above shows the LYRA observations of the X9.3 flare in 4 different wavelength channels. This unique dataset will certainly be studied with great interest by the LYRA team. Find more explanation here
http://proba2.oma.be/HerzbergFlare
Sunday Sep 10
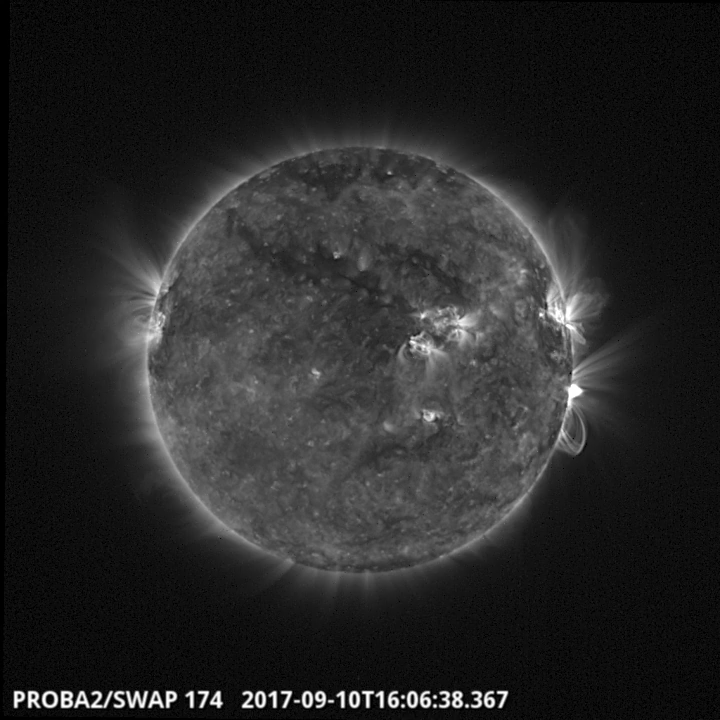
The Sun produced a strong X8.2 flare on 2017-Sep-10. This flare occurred in NOAA AR 2673 peaking at 12:02 UTC at the West limb of the Sun with a full CME halo. Find a movie of the event here (SWAP movie)
http://proba2.oma.be/swap/data/mpg/movies/20170910_swap_movie.mp4
Space Weather Briefing
The Space Weather Briefing presented by the forecaster on duty from September 4 to 10. It reflects in images and graphs what is written in the Solar and Geomagnetic Activity report. The movies are also available, click on the links below.
page with movies: http://www.stce.be/movies/2017094-10SWBriefing/
Review of solar activity
Recent Space Weather events find their origin in an active region on the Sun that is known as Catania sunspot group 46 or NOAA active region 2673. On September 3 the region was still a fairly regular region of magnetic type Beta. However, it grew rapidly and evolved quickly into a magnetically complex structure (Beta-Gamma and later Beta-Gamma-Delta) over the next days.
In a first episode of activity over September 4 and 5 it produced multiple M flares, the strongest of which was an M5.5 flare peaking at 20:33UT September 4.
Associated to this M5.5 flare a full halo CME was visible in SoHO LASCO C2 images. The images show a first ejection front from 19:00 UT onwards which is predominantly directed towards the South West. From 20:36UT an additional front is first visible in the South but it expands to a full halo CME afterwards. These are probably two separate eruptions but both are related to the activity in Catania group 46 (NOAA Active region 2673). The second eruption can be related to the dimming seen to the East of the region ahead of the M5.5 flare. Analysis of the coronagraph data indicates that the projected speed of the first ejection measures between 500 and 1000 km/s while the projected speed of the second faster ejection is close to 1500km/s. The arrival of the associated CME shock front at Earth location was expected around UT noon September 6, but eventually arrived only later that day.
As a result of the M5.5 flare and the associated CME initiation, the >10MeV proton flux levels started rising from around 23:00UT September 4, passing the event threshold level of 10pfu at 00:40UT September 5 and later also passed the 100 pfu level around 7:20UT September 5. The higher energy (>50 Mev) proton fluxes showed little or no increase at that time.
The region appeared to become relatively inactive for a while late September 5, but this was just the prelude to the X2.2 flare that it generated peaking at 9:10UT September 6. This was later followed by an X9.3 flare peaking at 12:02UT September 6 (the X9.3 magnitude was recorded by NOAA/GOES15 while it was recorded as X10 by NOAA/GOES13). This was the first X9 flare since 2006-12-05, and the most recent flare stronger than that of September 6 was the X17 flare of 2005-9-7 (exactly 12 years ago). The X9.3 flare was associated with strong radio bursts over a wide range of the frequency spectrum, while EUV images show an on disk dimming and an EUV wave. All these phenomena are indicative of a CME initiation, that was later confirmed by SoHO/LASCO coronagraph images. Coronagraph images show the presence of an asymmetric but full halo CME associated to the X9.3 flare. The CME is first visible in SoHO/LASCO C2 images at 12:24UT in the South West. The measured projected speed based on SoHO/LASCO images is around 1100-1200 km/s. Also in STEREO-A/COR2 images the CME is visible as a full halo. The arrival of the CME front at Earth location was expected around UT noon September 8, but eventually arrived much earlier just before midnight September 7-8. Following the X9.3 flare and the associated CME initiation, flux levels for >10MeV protons rose to maxima near 350 pfu. Also higher energy protons were slightly elevated after the X9.3 flare with fluxes of >100MeV protons reaching around 0.6 pfu but quickly recovering to background values.
After this peak of activity the region afterwards continued to produce some strong M flares, as well as an X1.3 flare peaking at 14:36UT September 7. All of the CMEs related to that activity were limited in angular extent and directed towards the West. Around midnight September 8-9 the >10MeV proton flux dropped below the event threshold of 10 pfu.
However, even though the region reached the West limb around noon September 10, it still produced another strong X flare of magnitude X8.2 peaking at 16:06UT September 10 (the X8.2 magnitude was recorded by NOAA/GOES15 while it was recorded as X8.9 by NOAA/GOES13). The flare was associated with an EIT wave, halo CME and a shock wave which had a projected speed of about 2900 km/s. A steep increase of the proton fluxes was observed, with >10 MeV, >50 MeV as well as >100MeV passing the 10pfu event threshold.
Noticeable Solar Events (4 Sep 2017 - 10 Sep 2017)
| DAY | BEGIN | MAX | END | LOC | XRAY | OP | 10CM | TYPE | Cat | NOAA |
| 04 | 0536 | 0549 | 0605 | S10W4 | M1.2 | 1F | 46 | 2673 | ||
| 04 | 1511 | 1530 | 1533 | S6W13 | M1.5 | 1N | 100 | 46 | 2673 | |
| 04 | 1805 | 1822 | 1831 | M1.0 | 46 | 2673 | ||||
| 04 | 1846 | 1937 | 1952 | M1.7 | IV/1 | 46 | 2673 | |||
| 04 | 1959 | 2002 | 2006 | M1.5 | 46 | 2673 | ||||
| 04 | 2028 | 2033 | 2037 | S11W16 | M5.5 | 3B | 46 | 2673 | ||
| 04 | 2210 | 2214 | 2219 | M2.1 | 46 | 2673 | ||||
| 05 | 0103 | 0108 | 0111 | M4.2 | 46 | 2673 | ||||
| 05 | 0342 | 0351 | 0404 | M1.0 | 46 | 2673 | ||||
| 05 | 0433 | 0453 | 0507 | M3.2 | IV/2 | 46 | 2673 | |||
| 05 | 0633 | 0640 | 0643 | M3.8 | 46 | 2673 | ||||
| 05 | 1737 | 1743 | 1751 | S9W24 | M2.3 | 1N | 46 | 2673 | ||
| 06 | 0857 | 0910 | 0917 | S7W33 | X2.2 | SF | 410 | VI/1 | 46 | 2673 |
| 06 | 1153 | 1202 | 1210 | S8W33 | X9.3 | 2B | 14000 | III/2IV/2VI/1II/2 | 46 | 2673 |
| 06 | 1551 | 1556 | 1603 | S9W38 | M2.5 | 3N | 46 | 2673 | ||
| 06 | 1921 | 1930 | 1935 | M1.4 | 46 | 2673 | ||||
| 06 | 2333 | 2339 | 2344 | M1.2 | ||||||
| 07 | 0459 | 0502 | 0508 | S7W45 | M2.4 | 1F | 46 | 2673 | ||
| 07 | 0949 | 0954 | 0958 | S8W47 | M1.4 | 1N | 260 | V/2III/2IV/2 | 46 | 2673 |
| 07 | 1011 | 1015 | 1018 | M7.3 | 810 | V/2 | 46 | 2673 | ||
| 07 | 1420 | 1436 | 1455 | S11W49 | X1.3 | 2B | 1600 | II/1 | 46 | 2673 |
| 07 | 2350 | 2359 | 0014 | M3.9 | 46 | 2673 | ||||
| 08 | 0219 | 0224 | 0229 | S9W54 | M1.3 | 1F | 46 | 2673 | ||
| 08 | 0339 | 0343 | 0345 | S6W55 | M1.2 | SF | 46 | 2673 | ||
| 08 | 0740 | 0749 | 0758 | S10W57 | M8.1 | 2B | 69 | 46 | 2673 | |
| 08 | 1509 | 1547 | 1604 | S8W68 | M2.9 | 1N | III/2 | 46 | 2673 | |
| 08 | 2333 | 2345 | 2356 | M2.1 | IV/1VI/1 | 46 | 2673 | |||
| 09 | 0414 | 0428 | 0443 | S13W69 | M1.1 | SF | 46 | 2673 | ||
| 09 | 1050 | 1104 | 1142 | S14W74 | M3.7 | SF | III/2 | 46 | 2673 | |
| 09 | 2204 | 2353 | 0041 | S7W74 | M1.1 | SF | 450 | II/2III/1 | 46 | 2673 |
| 10 | 1535 | 1606 | 1631 | X8.2 | 1900 | IV/2III/2II/1 | 46 | 2673 |
| LOC: approximate heliographic location | TYPE: radio burst type |
| XRAY: X-ray flare class | Cat: Catania sunspot group number |
| OP: optical flare class | NOAA: NOAA active region number |
| 10CM: peak 10 cm radio flux |
The International Sunspot Number
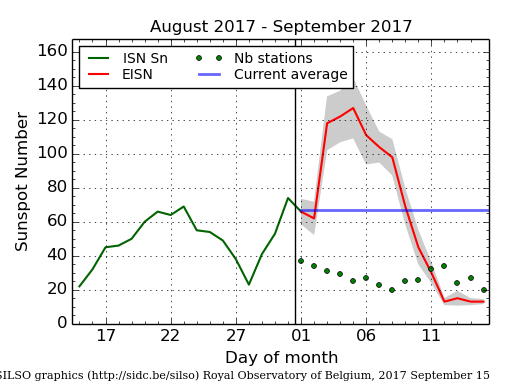
The daily Estimated International Sunspot Number (EISN, red curve with shaded error) derived by a simplified method from real-time data from the worldwide SILSO network. It extends the official Sunspot Number from the full processing of the preceding month (green line). The plot shows the last 30 days (about one solar rotation). The horizontal blue line shows the current monthly average, while the green dots give the number of stations included in the calculation of the EISN for each day.
Review of geomagnetic activity
Solar wind conditions started the week returning to nominal conditions after last weeks coronal hole high speed stream. However, they first somewhat unexpectedly became increased again September 4. Total magnetic field climbed to values of up to 9nT with Bz variable but seeing peaks down to -7nT. After midnight September 4-5, total field recovered to nominal values below 4nT. Solar wind speed showed a steady increase towards peak values of over 600 km/s around 1:20UT September 5.
Afterwards solar wind speed declined slowly to a minimum of 420km/s before at 23:08UT September 6 solar wind conditions became elevated due to the somewhat later than expected arrival of the September 4 CME. Solar wind speed jumped to just over 600km/s and total magnetic field jumped initially to 9nT, later increasing further to 16nT. Solar wind speed remained just below 600km/s in the wake of that CME, and Bz only saw some brief periods of negative Bz with peaks down to -11nT.
At 22:29UT September 7, another shock then marked the arrival of the September 6 CME. Solar wind speed jumped to over 620 km/s and increased further afterwards to speeds between 700-800 km/s. Total magnetic field jumped to 23nT, later reaching 34nT. Bz was strongly and persistently negative for the 3 hours following the shock with a peak down to -33nT. From around 11:15UT September 8, a new period of pronounced negative Bz (starting at -17nT) set in, which continued throughout the slow but steady decline in magnetic field strength. Eventually a slow return to solar wind speed of around 550km/s followed on September 10.
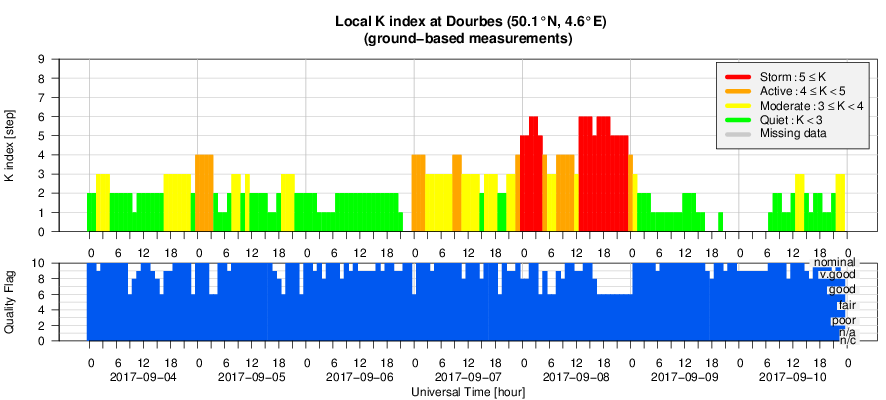
Geomagnetic conditions reached active to minor geomagnetic storm levels due to the renewed influence of the high speed stream (local K Dourbes 4 and NOAA Kp 5 for an isolated period). Only active conditions were reported at the arrival of the September 4 CME. The arrival of the September 6 CME however, caused some periods of severe geomagnetic storms (NOAA Kp 8) at both episodes of prolonged negative Bz. Locally only moderate storm levels were reported (K Dourbes 6).
Geomagnetic Observations at Dourbes (4 Sep 2017 - 10 Sep 2017)
Review of ionospheric activity (4 Sep 2017 - 10 Sep 2017)
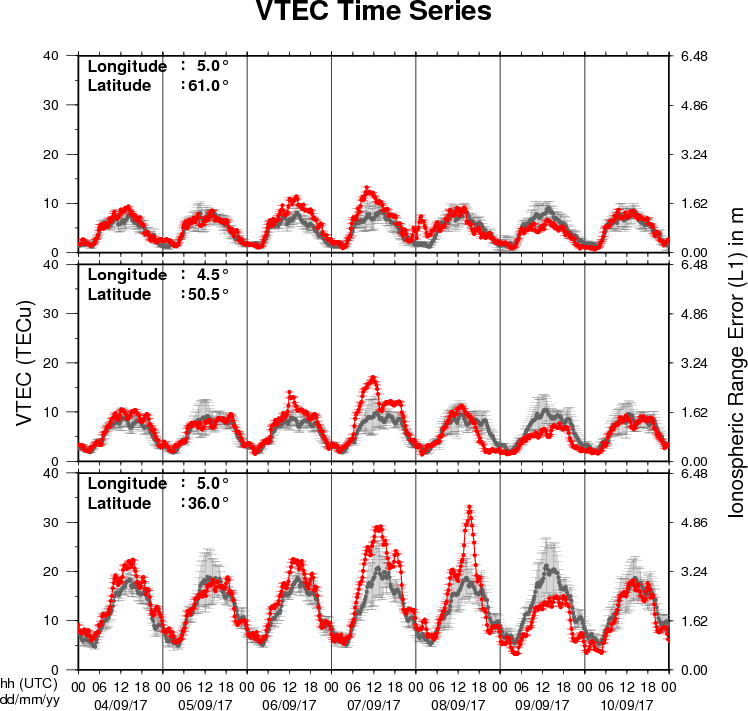
The figure shows the time evolution of the Vertical Total Electron Content (VTEC) (in red) during the last week at three locations:
a) in the northern part of Europe(N61°, 5°E)
b) above Brussels(N50.5°, 4.5°E)
c) in the southern part of Europe(N36°, 5°E)
This figure also shows (in grey) the normal ionospheric behaviour expected based on the median VTEC from the 15 previous days.
The VTEC is expressed in TECu (with TECu=10^16 electrons per square meter) and is directly related to the signal propagation delay due to the ionosphere (in figure: delay on GPS L1 frequency).
The Sun's radiation ionizes the Earth's upper atmosphere, the ionosphere, located from about 60km to 1000km above the Earth's surface.The ionization process in the ionosphere produces ions and free electrons. These electrons perturb the propagation of the GNSS (Global Navigation Satellite System) signals by inducing a so-called ionospheric delay.
See http://stce.be/newsletter/GNSS_final.pdf for some more explanations ; for detailed information, see http://gnss.be/ionosphere_tutorial.php
Future Events
For more details, see http://www.spaceweather.eu/en/event/future
International Workshop on Solar, Heliospheric & Magnetospheric Radioastronomy in Meudon, France
Start : 2017-11-06 - End : 2017-11-10
Jean-Louis Steinbeg has been one of the major pioneers in
radioastronomy. Co-founder of the Nançay Observatory, he
has actively participated to, an inspired a large number of radio
instruments on many international space missions. Jean-Louis
Steinberg is the founder of the Space Radioastronomy laboratory of
the Paris Observatory in 1963. Later on, this laboratory widened
its science interests and became the DESPA (1971) and then the
current LESIA (2002) which is one of the major space sciences
laboratories in France. The aim of this workshop is to cover the
science topics which Jean-Louis Steinberg has promoted during his
career, focusing on Solar, Heliospheric & Magnetospheric
radioastronomy & physics. This will be done by covering both
observations from either ground facilities (NDA, RH, LOFAR, Artemis
etc ...) or space missions (ISSEE, Ulysses, WIND, CLUSTER, STEREO,
CASSINI, JUNO etc ...) and models/theories. A series of invited
talks is also foreseen to cover the new developments in the
discipline which may come with the future facilities such as Solar
Orbiter, Solar Probe Plus, JUICE, JUNO, LOFAR+, SKA etc ....
This workshop will also be the opportunity to remember both the
extraordinary personal & professional lifes of Jean-Louis
Steinberg especially for new generation of scientists. At the
occasion of this workshop it is also expected that the Building 16
(historical Space Sciences building) on the Meudon campus will be
renamed "Building Jean-Louis Steinberg".
Website:
https://jlsworkshop.sciencesconf.org/
European Space Weather Week 14
Start : 2017-11-27 - End : 2017-12-01
The ESWW is the main annual event in the European Space Weather
calendar. It is the European forum for Space Weather as proven by
the high attendance to the past editions. The agenda will be
composed of plenary/parallel sessions, working meetings and
dedicated events for service end-users. The ESWW will again adopt
the central aim of bringing together the diverse groups in Europe
working on different aspects of Space Weather.
Website:
http://www.stce.be/esww14/