- Table of Content
- 1.Butterfly's wi...
- 2.STCE on instag...
- 3.Review of sola...
- 4.The Internatio...
- 5.PROBA2 Observa...
- 6.Review of geom...
- 7.Geomagnetic Ob...
- 8.The SIDC Space...
- 9.Review of iono...
- 10.STCE in action...
2. STCE on instagram
3. Review of solar activity
4. The International Sunspot Number by Silso
5. PROBA2 Observations (5 Apr 2021 - 11 Apr 2021)
6. Review of geomagnetic activity
7. Geomagnetic Observations at Dourbes
8. The SIDC Space Weather Briefing
9. Review of ionospheric activity (5 Apr 2021 - 11 Apr 2021)
10. STCE in action: upcoming events
Butterfly's wings
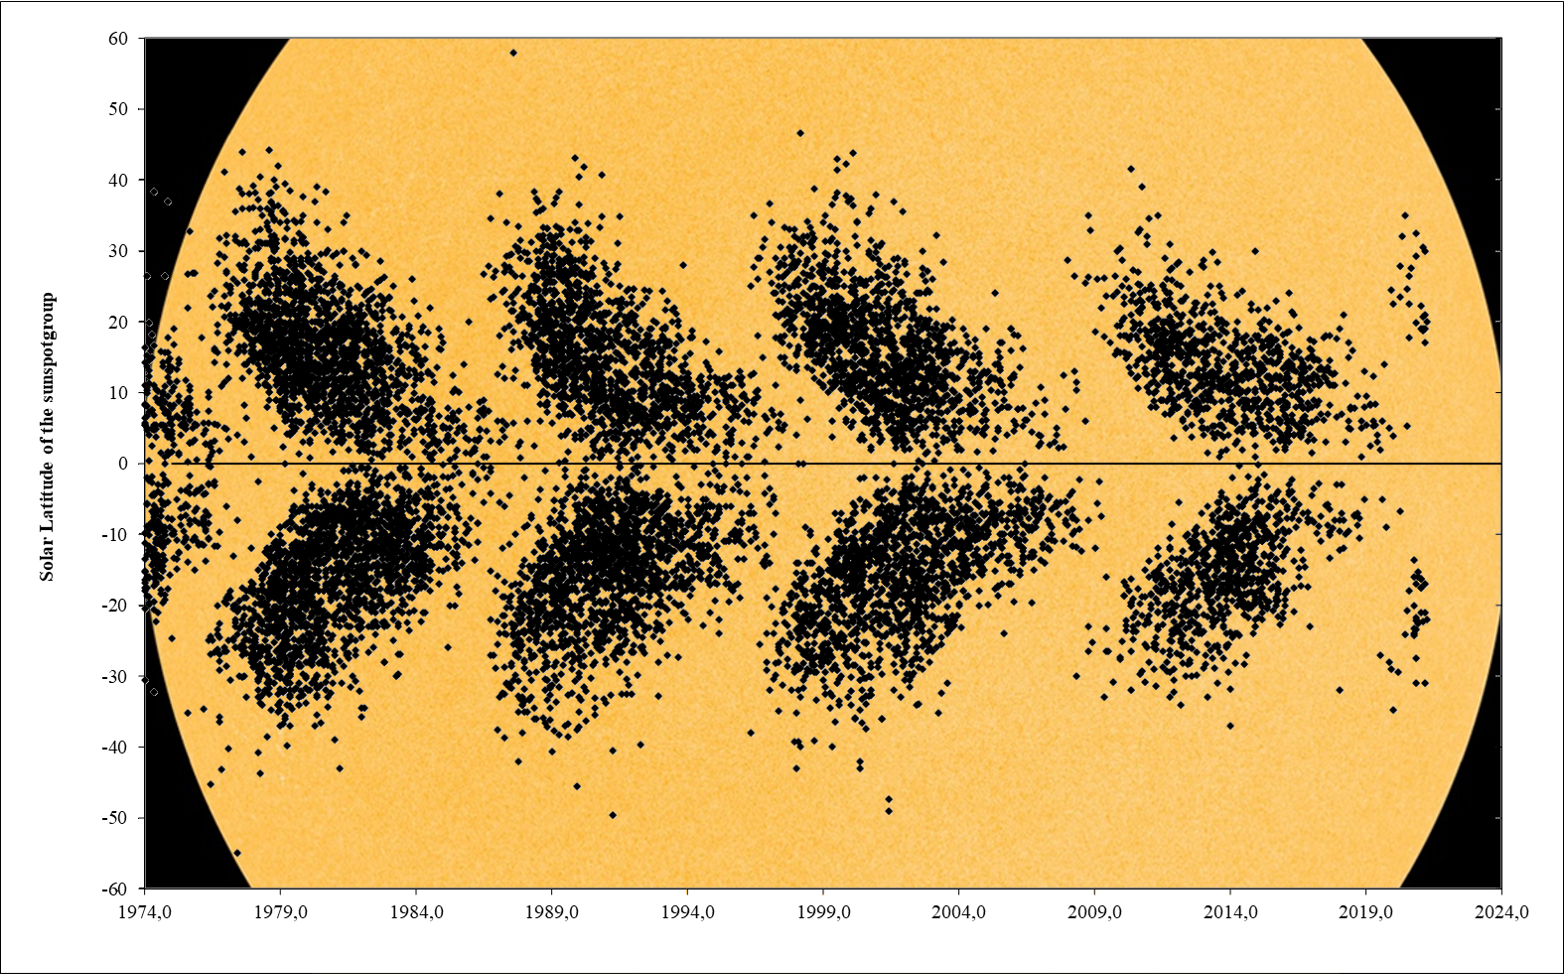
Solar cycle 25 (SC25) continues its glorious march to solar maximum, with 7 new groups both in January and March 2021. The sunspot regions were more or less evenly spread over both solar hemispheres, with a slightly more dominant southern hemisphere that has also displayed most of the largest sunspot regions so far. The distribution of the sunspot groups can be seen in the so-called butterfly diagram underneath, displaying for each month since 1974 the latitude of every individual sunspot group (NOAA number - See the Solar Cycle Science website at http://solarcyclescience.com/activeregions.html ) that has appeared. It clearly shows that during the period of solar cycle minimum, the sunspot groups appear ever closer to the solar equator, gradually becoming smaller and disappearing while the sunspots of the new solar cycle manifest themselves again at high latitudes. As the pattern resembles the wings of a butterfly, it is called a butterfly diagram. The first such butterfly diagram was published by E. Walter Maunder in the Monthly Notices of the Royal Astronomical Society in 1904 (https://ui.adsabs.harvard.edu/abs/1904MNRAS..64..747M/abstract ). The sunspot groups that have emerged over the last few months all belong to the new SC25 and continue to reveal more of the outer tips of the new butterfly's wings. The highest latitude reached by sunspot groups in SC25 so far is 35 degrees, both in the northern (NOAA 12764, June 2020) as in the southern (NOAA 12755, January 2020) solar hemisphere.
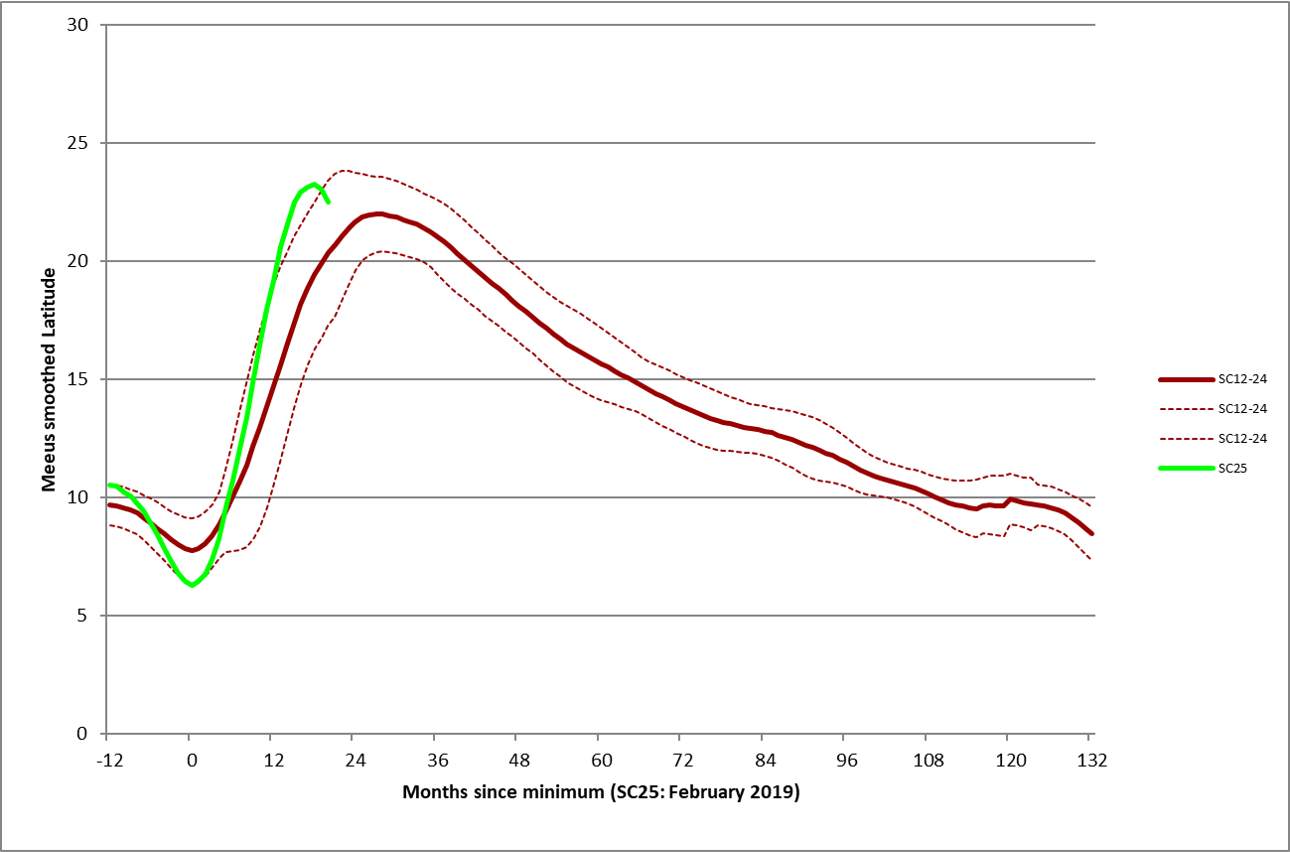
Though the sunspot region values for March/April 2021 are only preliminary/incomplete, the smoothed average latitude of the sunspot groups seems to have already reached its maximum. The graph underneath shows the smoothed average latitude of the sunspot regions from SC12 to 24 (brown; the thin dashed lines show the standard deviations), and for SC25 (green). The SC12-24 and SC25 latitudes are fit such that the months of lowest smoothed latitudes coincide (month "0"). SC25 latitude reached a minimum in February 2019 (6.3 degrees, so the active regions emerged very close to the solar equator), and seems to have peaked in August 2020 (23.3 degrees). The peak seems to have occured slightly earlier and to be slightly higher than the average SC12-14 values, but there's nothing out of the ordinary. The values can't be used for forecasting the upcoming amplitude of SC25 (no significant correlations), however, in the past, the timing when the smoothed average latitude reaches 16 degrees has been used to predict the timing of the solar cycle maximum (e.g. Schatten 2002 - https://agupubs.onlinelibrary.wiley.com/doi/full/10.1029/2002JA009404 ). Based on the SC12-24 values, the smoothed average latitude descends under 16 degrees 58 months after its smoothed minimum. Also, this 16 degrees threshold happens to be reached 3 months before the solar cycle maximum (with an uncertainty of 10 months). Thus, SC25 may reach its maximum in March 2024 (February 2019 + 58 + 3 months), with an uncertainty of 10 months and assuming that the average latitude of the SC25 sunspot groups closely tracks the average SC12-24 values (brown curve). So for the moment, this sunspot latitude forecast provides only an idea of the timing of SC25 maximum, it's still a bit too early to make a firm prediction.
STCE on instagram
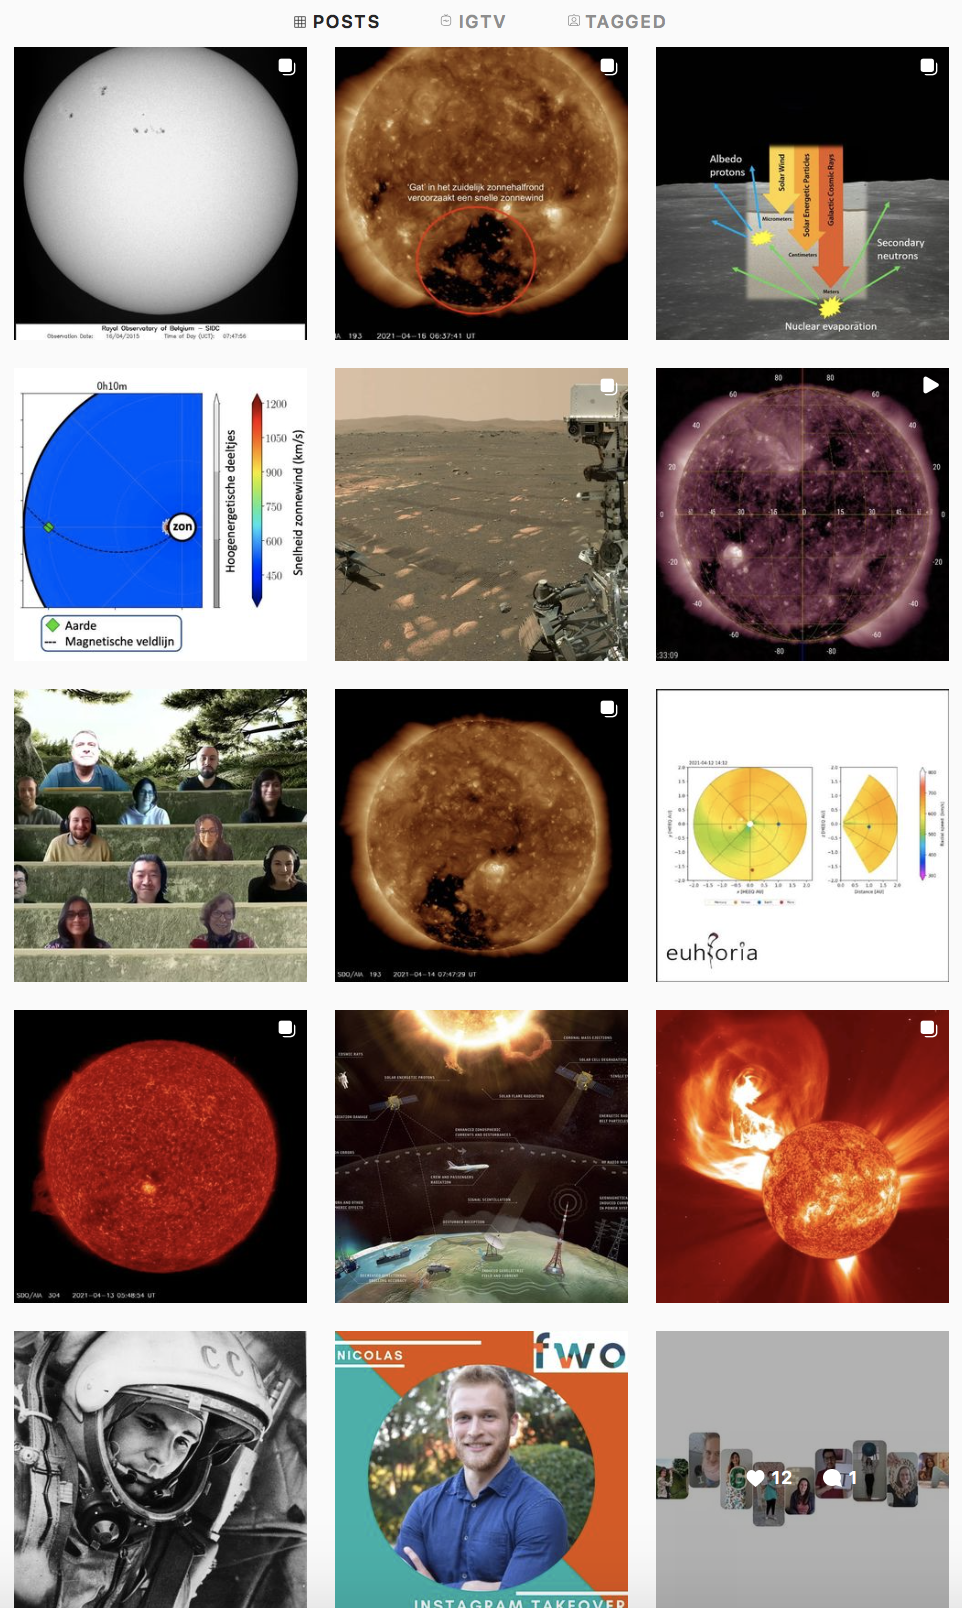
Nicolas Wijsen (KULeuven) working on EUHFORIA, a computer model of the heliosphere, was asked to take over the fwovlaanderen instagram account. On April 12, it was the day of space travel. The STCE provided info about the impact of solar storms and space weather, how we deal with particle radiation, how the visible sunspots evolved and compared them with the past, we gave a daily space weather update, ... All you need to take into account if you are going to space, to the moon, to Mars.
The take over ends on April 16 in the evening.
Check it out https://www.instagram.com/fwovlaanderen/
Review of solar activity
Solar activity was very low. Active region NOAA AR 2813 crossed the solar disk. Two regions emerged and decayed without being associated with sunspots. At the end of the week, a region on the SE quadrant was present, with an accompanying sunspot. The active regions did not produce any significant flares.
A Coronal Mass Ejection (CME) seen in STEREO-COR2 coronagraphic imagery from 2021-03-31 03:38UT reached Earth on April 7.
The greater than 10 MeV proton flux was at nominal values.
The greater than 2 MeV remained below the 1000 pfu alert threshold.
The greater than 2 MeV electron fluence was at nominal levels over the past week.
The International Sunspot Number by Silso
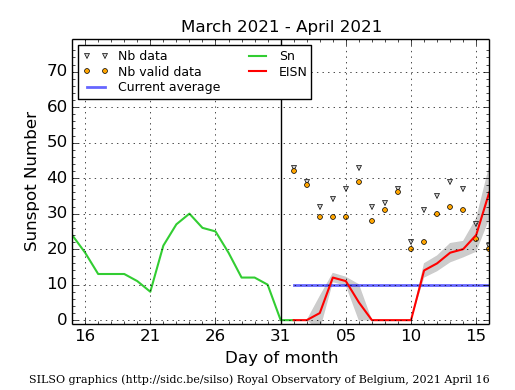
The daily Estimated International Sunspot Number (EISN, red curve with shaded error) derived by a simplified method from real-time data from the worldwide SILSO network. It extends the official Sunspot Number from the full processing of the preceding month (green line), a few days more than one solar rotation. The horizontal blue line shows the current monthly average. The yellow dots gives the number of stations that provided valid data. Valid data are used to calculate the EISN. The triangle gives the number of stations providing data. When a triangle and a yellow dot coincide, it means that all the data is used to calculate the EISN of that day.
PROBA2 Observations (5 Apr 2021 - 11 Apr 2021)
Solar Activity
Solar flare activity was very low during the week.
In order to view the activity of this week in more detail, we suggest to go to the following website from which all the daily (normal and difference) movies can be accessed: https://proba2.oma.be/ssa
This page also lists the recorded flaring events.
A weekly overview movie can be found here (SWAP week 576): https://proba2.sidc.be/swap/data/mpg/movies/weekly_movies/weekly_movie_2021_04_05.mp4
Details about some of this week's events can be found further below.
If any of the linked movies are unavailable they can be found in the P2SC movie repository here: https://proba2.oma.be/swap/data/mpg/movies/
Sunday Apr 11
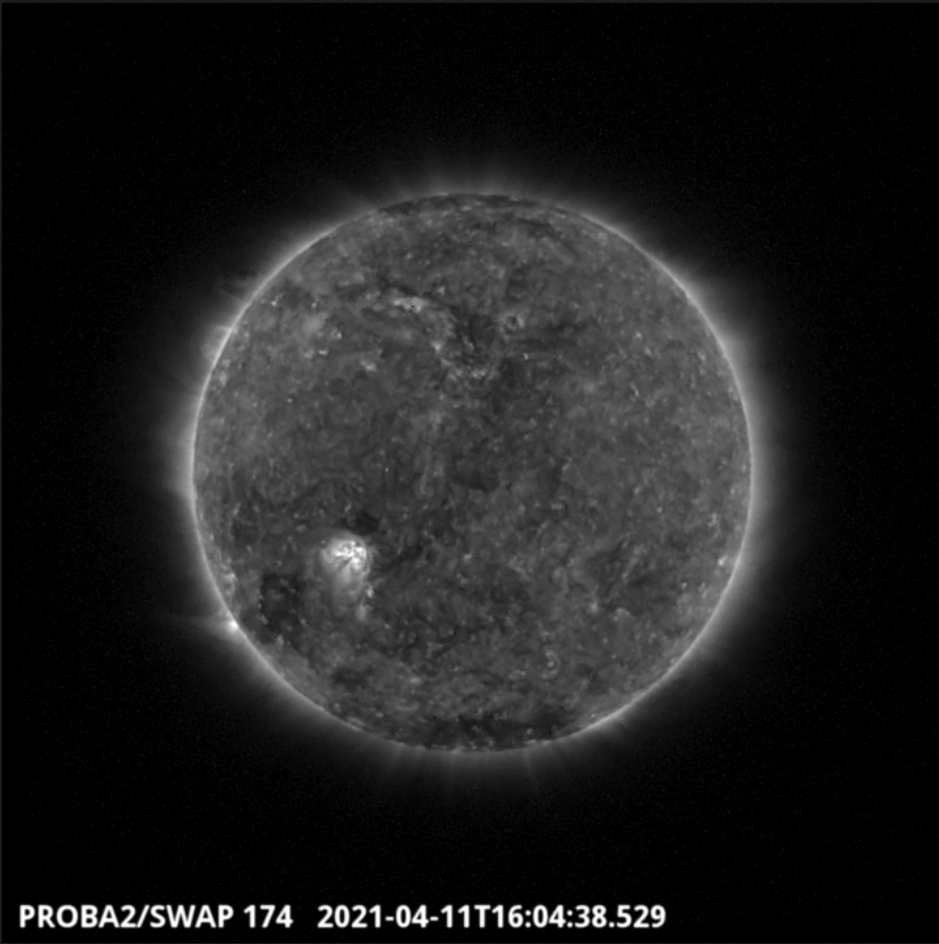
A filament eruption was observed by SWAP on the south-east limb of the solar disk on 2021-Apr-11, as shown in the SWAP image above taken at 16:04 UT.
Find a movie of the entire day here https://proba2.sidc.be/swap/movies/20210411_swap_movie.mp4 (SWAP movie).
Review of geomagnetic activity
At the beginning of the week, the solar wind was slow and carried only a week magnetic field.
About April 5, before noon what seems to be the effects of the CME of Mar 31, caused a minor increase in the total magnetic field strength. The speed of the solar wind did not vary. By the end of April 6, the magnetic field imbedded in the solar wind had returned became less strong.
From April 7, the Earth was under the influence of a positive polarity coronal hole (CH) that began to traverse the central meridian on April 3. The Co-rotating interaction region (CIR) carried a magnetically strong wind up to 15nT, Bz had a minimum value of -13 nT. The fast solar wind following the CIR reached a maximum of 525 km/s.
Late April 11, the Earth was under the influence of the negative polarity coronal hole (CH) that began to traverse the central meridian on April 8. On April 11, the solar wind speed was still below 400 km/s.
Geomagnetic activity reached minor storm levels (Kp 5) on April 7 due to the high-speed stream arriving on April 7.
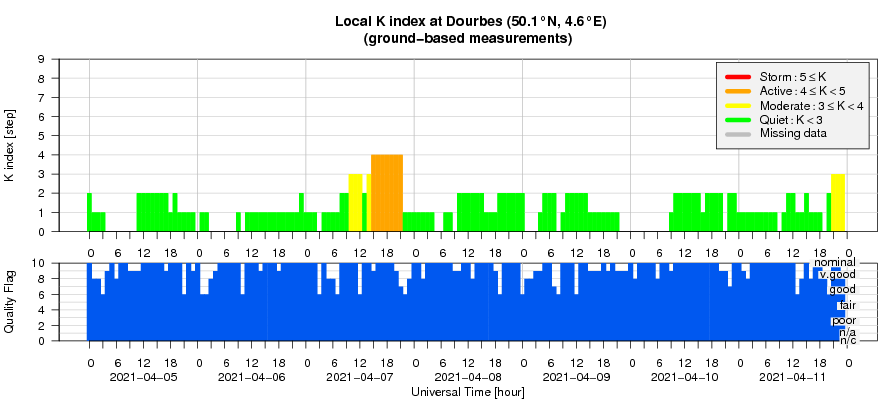
Unsettled conditions were recorded on April 5 and April 11, due to the effects of an ICME and the coronal hole stream respectively. The first caused Kp=3 and the latter K Dourbes=3.
Geomagnetic Observations at Dourbes
The SIDC Space Weather Briefing
The Space Weather Briefing presented by the forecaster on duty from April 4 to 11. It reflects in images and graphs what is written in the Solar and Geomagnetic Activity report.
A pdf-version: https://www.stce.be/briefings/20210412_SWbriefing.pdf
The movie: https://www.stce.be/briefings/20210412_SWbriefing.m4v
Review of ionospheric activity (5 Apr 2021 - 11 Apr 2021)
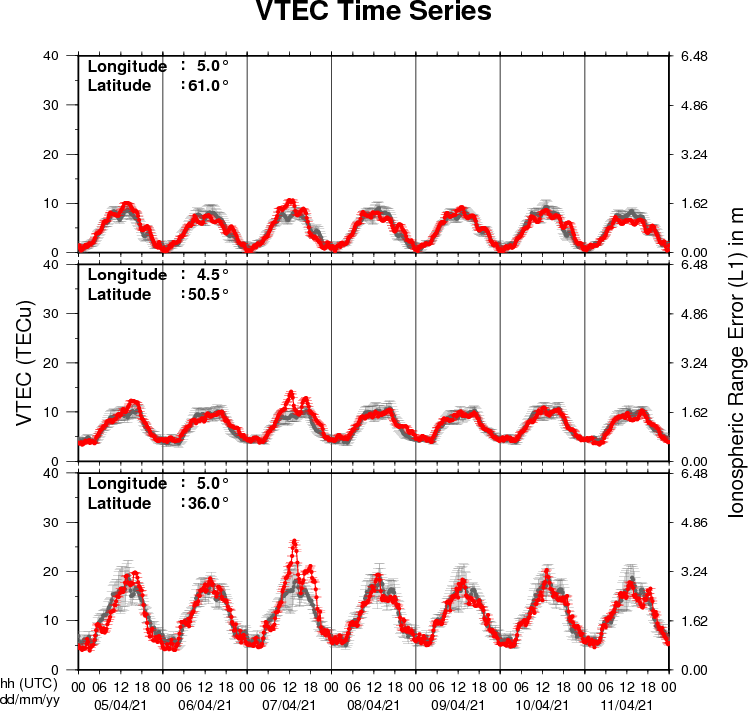
The figure shows the time evolution of the Vertical Total Electron Content (VTEC) (in red) during the last week at three locations:
a) in the northern part of Europe(N61°, 5°E)
b) above Brussels(N50.5°, 4.5°E)
c) in the southern part of Europe(N36°, 5°E)
This figure also shows (in grey) the normal ionospheric behaviour expected based on the median VTEC from the 15 previous days.
The VTEC is expressed in TECu (with TECu=10^16 electrons per square meter) and is directly related to the signal propagation delay due to the ionosphere (in figure: delay on GPS L1 frequency).
The Sun's radiation ionizes the Earth's upper atmosphere, the ionosphere, located from about 60km to 1000km above the Earth's surface.The ionization process in the ionosphere produces ions and free electrons. These electrons perturb the propagation of the GNSS (Global Navigation Satellite System) signals by inducing a so-called ionospheric delay.
See http://stce.be/newsletter/GNSS_final.pdf for some more explanations ; for detailed information, see http://gnss.be/ionosphere_tutorial.php
STCE in action: upcoming events
Check out our activity calendar: activities and encounters with space weather as main theme. We provide occasions to get submerged in the space weather world through educational, informative and instructive activities.
Due to COVID, these activities and events are organised online.
April 23 - seminar: The coronal temperature distribution produced by the DYN model
May 17,18,20,21: SWx introductory course (registration is not open yet)
Details on: https://www.stce.be/calendar