- Table of Content
- 1.First proton e...
- 2.Eclipse challe...
- 3.Review of sola...
- 4.PROBA2 Observa...
- 5.The Internatio...
- 6.Review of geom...
- 7.Geomagnetic Ob...
- 8.The SIDC Space...
- 9.Review of iono...
2. Eclipse challenge
3. Review of solar activity
4. PROBA2 Observations (24 May 2021 - 30 May 2021)
5. The International Sunspot Number by Silso
6. Review of geomagnetic activity
7. Geomagnetic Observations at Dourbes (24 May 2021 - 30 May 2021)
8. The SIDC Space Weather Briefing
9. Review of ionospheric activity (24 May 2021 - 30 May 2021)
First proton event of SC25
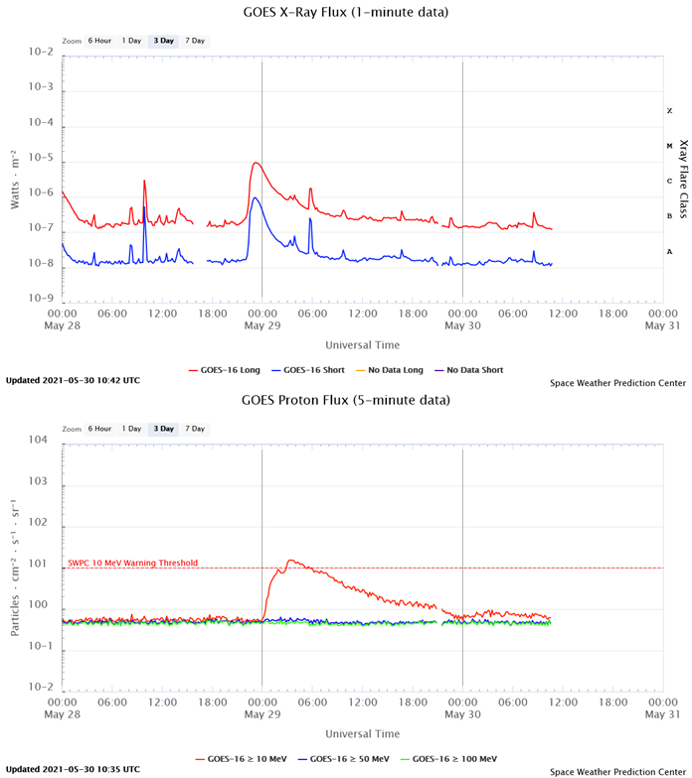
The first proton event of solar cycle 25 (SC25) took place on 29 May. Following a long duration C9.4 flare that peaked at 23:13UT on 28 May, the proton flux reached the 10 pfu alert threshold on 29 May at 03:00UT, peaked at 03:20UT (15 pfu, with 1 pfu = 1 proton / cm2 s sr), and ended at 05:40UT. This was a weak event, reaching only S1 on the NOAA scale, i.e. a minor solar radiation storm (see https://www.swpc.noaa.gov/noaa-scales-explanation ). It was barely noticeable in e.g. coronagraphic imagery. Also, the fluxes of protons with higher energies (>= 50 MeV , >= 100 MeV) remained at their background values.
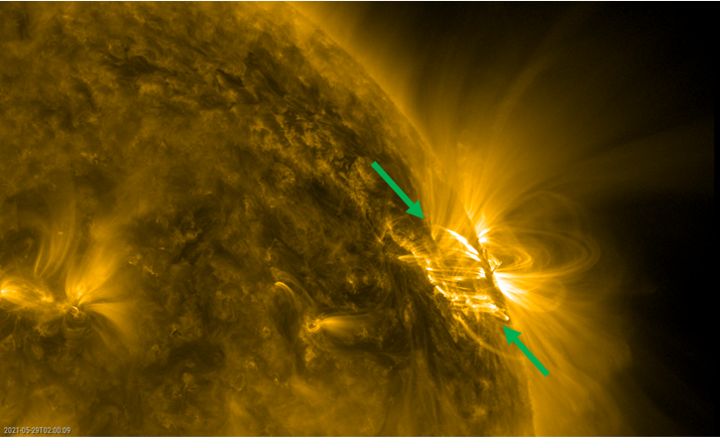
The source of this C-class flare and associated proton event was active region NOAA 2824, a small and decaying sunspot region located N21W63 at the time of the eruption. Its location in the western hemisphere favored a good magnetic connection with the Earth, a typical situation for proton events. An arcade, a series of post-eruption coronal loops could be seen rising over the blast site (see the annotated image in the SDO/AIA 171 imagery). A coronal mass ejection with a plane-of-the-sky speed around 880 km/s (CACTus - http://www.sidc.oma.be/cactus/ ) was observed off the west limb in SOHO and STEREO-A coronagraphic imagery. An earth-directed component could not be excluded and may affect the earth environment on 1-2 June.

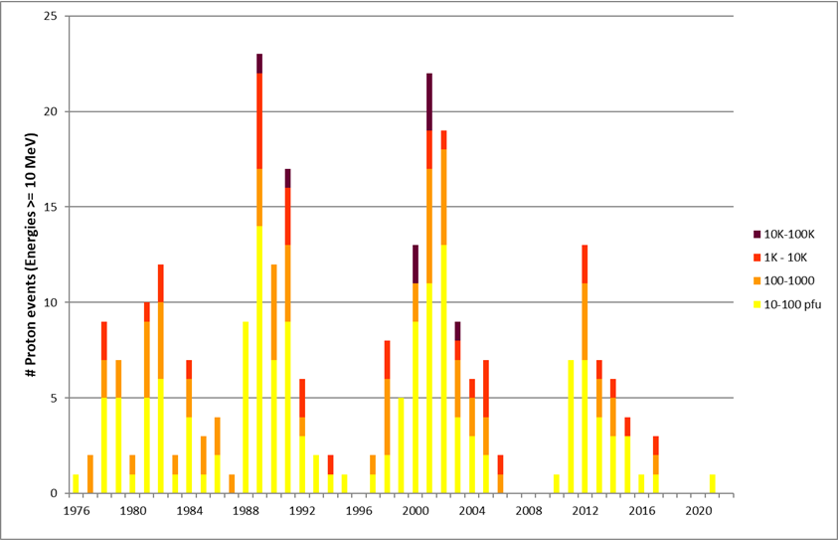
This is the first proton event since 10-11 September 2017, and the first for SC25. Underneath per year the number of proton events binned per peak intensity corresponding to the NOAA scales S1 to S4 (based on the NASA/GSFC list at https://umbra.nascom.nasa.gov/SEP/ ). There hasn't been any S5 event (peak flux > 100.000 pfu) since systematic GOES measurements started in 1976. More information on the intensity, classification and space weather effects of proton events is in this STCE Newsitem at https://www.stce.be/news/233/welcome.html
Eclipse challenge
On June 10 2021, a solar eclipse will take place. You can watch the spectacle when you are on the right place, at the right time and when the weather allows. But our telescope SWAP onboard the satellite PROBA2 will anyway witness the solar eclipse, a few times even and regardless the weather.
Specially for this occasion, we organise a contest. We have a quiz in store for you. The correct answers will be hidden in the EUV images made by SWAP during the solar eclipse.

Do your own Poirot image processing to discover more about SWAP's personality and win a VIP treatment on the PROBA2 premises.This activity runs as long as you need to discover the messages.
How, when, where, what, ... follow it on the PROBA2 website: https://proba2.sidc.be/EclipseChallenge
The USET team in Uccle will also broadcast the solar eclipse, if the weather permits.
Happy research!
Review of solar activity
Beta-gamma regions NOAA 2824 and 2826 produced 15 C flares from May 26 to 29. The GOES X-ray background flux stayed below B4. The brightest flare was a C9.4 flare released by region 2824, which peaked at 23:13 UT on May 28. This flare was associated with a dimming detected by Solar Demon and a CME towards the West first observed in LASCO C2 imagery at 23:12 UT, with an estimated speed around 840 km/s and a half cone angle of about 50 degrees.
A proton event started around 0h UT on May 29, related to the C9.4 flare and associated CME. The greater than 10 MeV proton flux reached a maximum of about 16 pfu around 03:20 UT, and proton flux levels went below the 10 pfu threshold around 05:50 UT.
The greater than 2 MeV electron flux and the greater than 2 MeV electron fluence were near or above the moderate level threshold from May 24 to 26.
PROBA2 Observations (24 May 2021 - 30 May 2021)
Solar Activity
Solar flare activity fluctuated from very low to low during the week.
In order to view the activity of this week in more detail, we suggest to go to the following website from which all the daily (normal and difference) movies can be accessed: https://proba2.oma.be/ssa
This page also lists the recorded flaring events.
A weekly overview movie can be found here (SWAP week 583) https://proba2.oma.be/swap/data/mpg/movies/weekly_movies/weekly_movie_2021_05_24.mp4.
Details about some of this week's events can be found further below.
If any of the linked movies are unavailable they can be found in the P2SC movie repository here https://proba2.oma.be/swap/data/mpg/movies/
Friday May 28
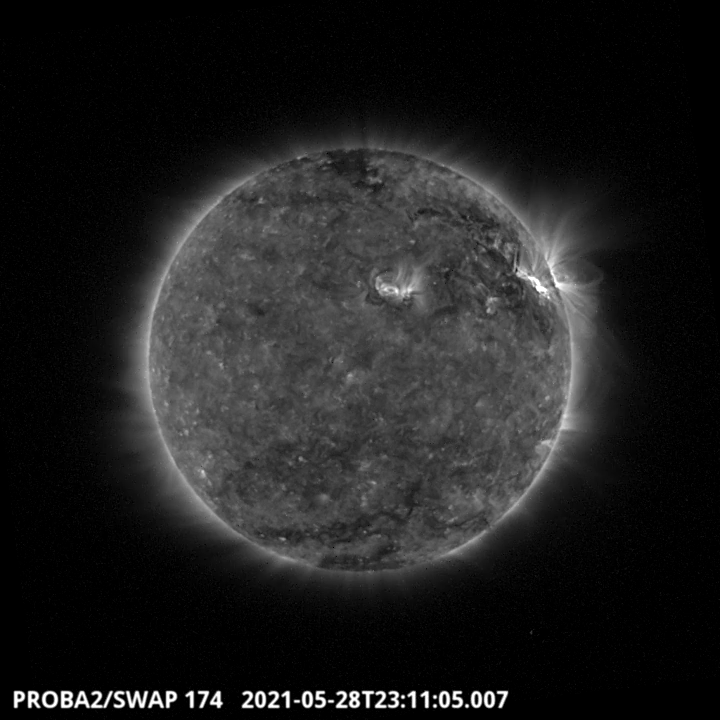
Flows are visible on the North-West part of the solar disk around 23:11 UT on the SWAP image above. They correspond to the biggest event of the week, a C9.4 flare produced by the NOAA active region 2824. Find a movie of the events here (SWAP movie) https://proba2.oma.be/swap/data/mpg/movies/20210528_swap_movie.mp4
The International Sunspot Number by Silso
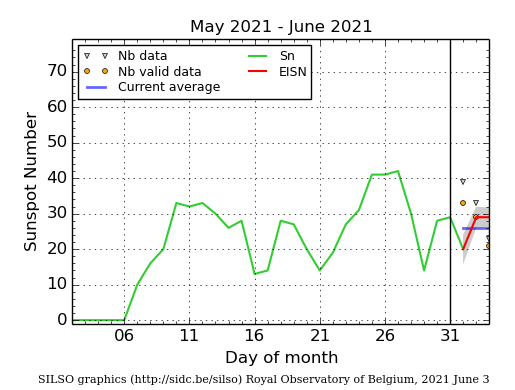
The daily Estimated International Sunspot Number (EISN, red curve with shaded error) derived by a simplified method from real-time data from the worldwide SILSO network. It extends the official Sunspot Number from the full processing of the preceding month (green line), a few days more than one solar rotation. The horizontal blue line shows the current monthly average. The yellow dots gives the number of stations that provided valid data. Valid data are used to calculate the EISN. The triangle gives the number of stations providing data. When a triangle and a yellow dot coincide, it means that all the data is used to calculate the EISN of that day.
Review of geomagnetic activity
At 11:35 UT on May 26, a fast forward shock was observed in the solar wind by DSCOVR, with solar wind speed jumping from 300 km/s to slightly above 350 km/s and IMF magnitude jumping from 3 nT to 9 nT. These enhanced solar wind conditions were probably associated with the arrival of the CMEs leaving the Sun on May 22 and 23.
Solar wind speed varied between 360 and 490 km/s for the rest of the week. IMF magnitude reached a maximum of 16 nT on May 27 and ranged between about 0 and 10 nT for the rest of the week.
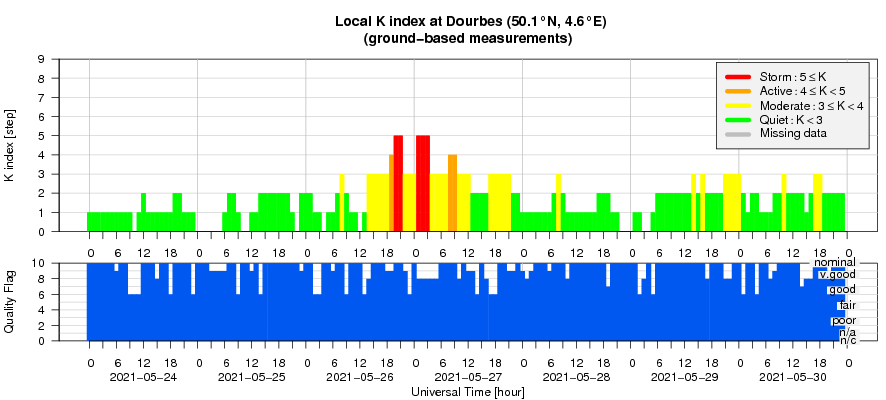
NOAA Kp was 5 during one interval on May 26. K Dourbes reached 5 during several time intervals on May 26 and 27.
Geomagnetic Observations at Dourbes (24 May 2021 - 30 May 2021)
The SIDC Space Weather Briefing
The Space Weather Briefing presented by the forecaster on duty from May 23 to 30. It reflects in images and graphs what is written in the Solar and Geomagnetic Activity report.

A pdf-version: https://www.stce.be/briefings/20210531_SWbriefing.pdf
The movie: https://www.stce.be/briefings/20210531_SWbriefing.m4v
Review of ionospheric activity (24 May 2021 - 30 May 2021)
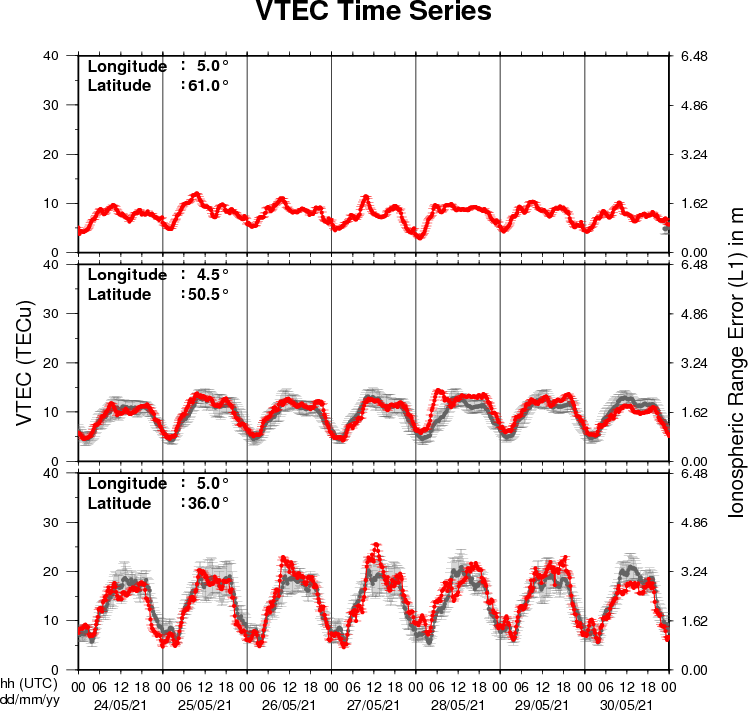
The figure shows the time evolution of the Vertical Total Electron Content (VTEC) (in red) during the last week at three locations:
a) in the northern part of Europe(N61°, 5°E)
b) above Brussels(N50.5°, 4.5°E)
c) in the southern part of Europe(N36°, 5°E)
This figure also shows (in grey) the normal ionospheric behaviour expected based on the median VTEC from the 15 previous days.
The VTEC is expressed in TECu (with TECu=10^16 electrons per square meter) and is directly related to the signal propagation delay due to the ionosphere (in figure: delay on GPS L1 frequency).
The Sun's radiation ionizes the Earth's upper atmosphere, the ionosphere, located from about 60km to 1000km above the Earth's surface.The ionization process in the ionosphere produces ions and free electrons. These electrons perturb the propagation of the GNSS (Global Navigation Satellite System) signals by inducing a so-called ionospheric delay.
See http://stce.be/newsletter/GNSS_final.pdf for some more explanations ; for detailed information, see http://gnss.be/ionosphere_tutorial.php