- Table of Content
- 1.Asteroid (3155...
- 2.The two faces ...
- 3.Their last eve...
- 4.PITHIA-NRF : 2...
- 5.Review of sola...
- 6.PROBA2 Observa...
- 7.The Internatio...
- 8.The SIDC Space...
- 9.Review of iono...
- 10.Action!
2. The two faces of the Sun
3. Their last evening ...
4. PITHIA-NRF : 2nd TNA call and 1st Innovation Day
5. Review of solar and geomagnetic activity
6. PROBA2 Observations (3 Jan 2022 - 9 Jan 2022)
7. The International Sunspot Number by Silso
8. The SIDC Space Weather Briefing
9. Review of ionospheric activity (3 Jan 2022 - 9 Jan 2022)
10. Action!
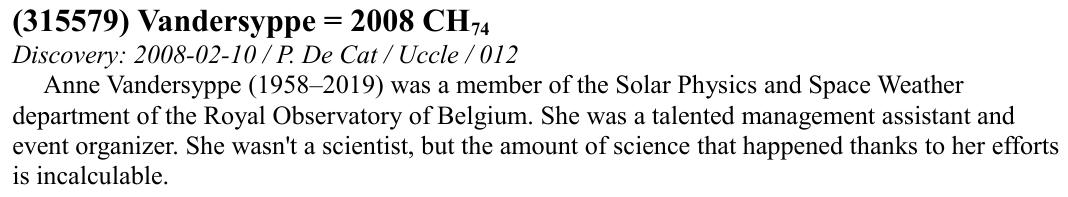
Asteroid (315579) named Vandersyppe in memory of Anne (3 Jan 2022 - 9 Jan 2022)
Many readers will remember our dear colleague, Anne Vandersyppe, who passed away on July 31, 2019 after a long illness. She gave many visitors and new colleagues a warm welcome upon their arrival at the Royal Observatory of Belgium. As an experienced organizer, she was also one of the driving forces behind the many conferences and workshops organised by ROB. She was a pillar of strength, comfort and good advice to all her colleagues. And we have not forgotten her.

In November 2021, Peter De Cat proposed to dedicate asteroid (315579), which he discovered, to Anne. For many years, Peter had organised a flower sale at the Observatory in support of cancer patients with the added incentive that the person that sold the most flowers could submit a proposal to name an asteroid. In 2014, Anne won this contest and with the help of Peter she submitted a proposal to name the asteroid Vandersyppe, in honour of her family, and especially her father who died at a young age. Unfortunately, this proposal was never accepted.
Recently, a new opportunity arose to name asteroid (315579) and Peter now decided to propose to name it after Anne herself. This proposal (see image below) was accepted within a month.
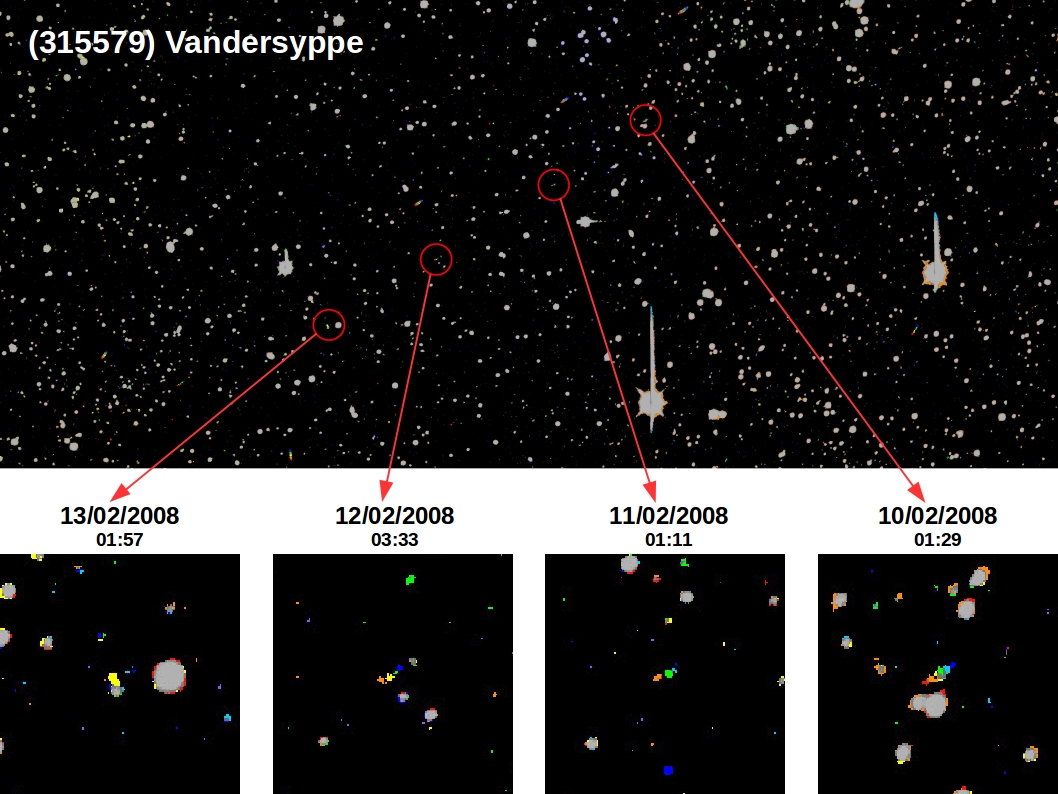
Underneath is a compilation of images of the first four nights (315579) Vandersyppe was observed from Uccle. These observations were performed by Peter De Cat and Thierry Pauwels with ROB's Schmidt telescope. The asteroid is moving from right to left in the top panel. In single images, an asteroid in not easily distinguished from stars, both are point sources. Only the asteroid's movement in the sky reveals its true nature. That is why for asteroid detections several images are taken shortly after each other, and are then overlapped and color coded to make the asteroid's movement easily visible. Typically, the asteroid is designated with rainbow colours (moving from blue to red). The close-up images for each night in the bottom panels are a compilation of typically 5 short exposures, centred around the time indicated on the image. Each exposure corresponds to a color (blue to red), and objects (stars) that occur at the same place in multiple exposures are shown as grey circles.
The Royal Observatory of Belgium has a rich history in astrometry, the scientific discipline that is concerned with measuring the position and motion of celestial objects. In particular, there is much experience with astrometry of asteroids and comets. A popular article describing the observations performed with the Schmidt telescope over the last 20 years will soon appear in Science Connection, the magazine of the Belgian Science Policy Office (http://www.belspo.be/belspo/organisation/publ_science_nl.stm)
The two faces of the Sun
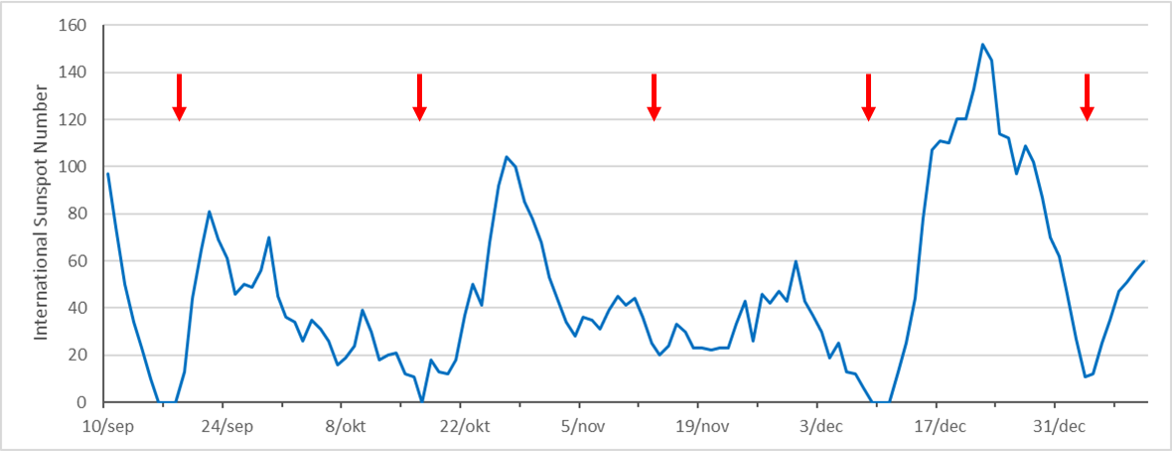
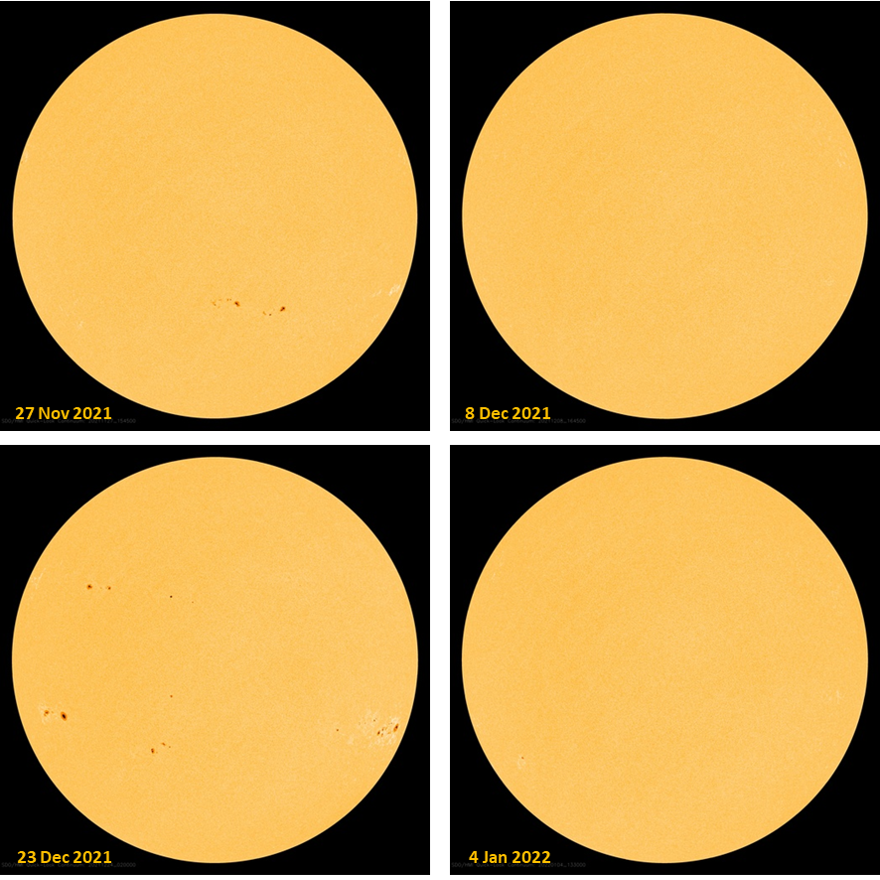
Solar observers have noticed that during the last quarter of 2021, between the 10th and 17th of each month there usually was a low in sunspot activity (occasionally even a few spotless days), whereas during the rest of the month higher sunspot numbers were observed. This can be seen in the annotated graph (SILSO data - https://wwwbis.sidc.be/silso/home ) with preliminary international sunspot numbers (ISN) from 10 September 2021 onwards. Red arrows indicate the dips in the solar activity, and as it turns out these dips are about 4 weeks spaced from each other, corresponding to about 1 solar rotation.
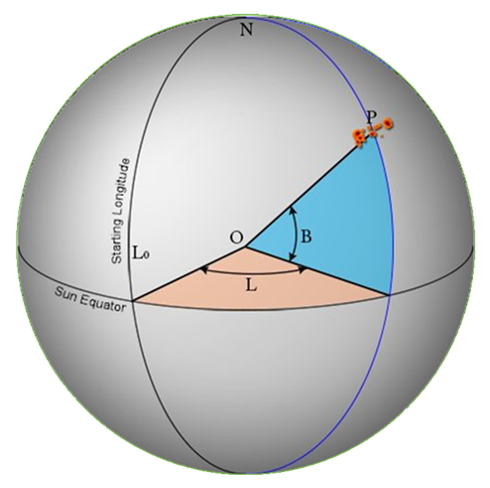
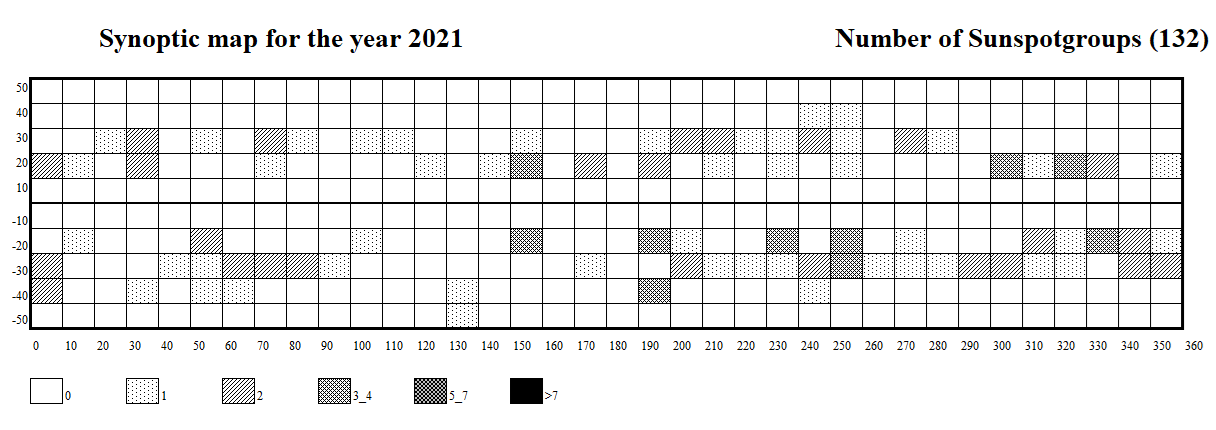
This more-or-less equal spacing in time hints already that the solar rotation is involved. To quantify this asymmetry in solar activity, a synoptic map is used. A synoptic map represents the full surface of the Sun but using only observations from the Earth’s viewing direction. Depending on the type of synoptic map, it could only use the data taken near solar central meridian (the "north-south" line on the solar disk), or the data from different parts of the visible solar disk (e.g. combining STEREO and SDO imagery), or from data taken on different days averaged or summed together to contribute to a selected range of latitudes and longitudes. For the purpose of this news item, the number of sunspot groups in 2021 and their respective locations (latitude and longitude - see sketch; Credits: Cakmak, 2018) as recorded each day were used to create a synoptic map for the solar surface in 2021. Data were taken from the NOAA/USAF network (https://www.swpc.noaa.gov/products/solar-region-summary ). Complete solar rotations were utilized from late December 2020 (Carrington Rotation number 2239) till early January 2022 (Rotation number 2252).
In the synoptic map below, heliographic longitude is on the horizontal axis (from 0 to 360 degrees) and heliographic latitude on the vertical axis (from -50 to +50 degrees). The area is binned in squares of 10 x 10 degrees. Based on the location of the sunspot region, the number of sunspot groups that emerged in each square is summed and represented by the mentioned color code. Of note is that created this way, the synoptic map is not saying anything on the size or the complexity of the groups. Different synoptic maps, e.g. based on the sunspot area or on the flare production, can be constructed for these purposes. The synoptic map underneath readily shows the dominance of the southern hemisphere throughout the year, with 76 of 132 sunspot groups (57%). However, this is not the reason why we see the near-monthly ups and downs in the sunspot number. This undulating motion is actually due because the Sun currently contains a hemisphere which is fairly active (between longitudes 150 and 340 degrees, aka "active longitudes"), and a nearly dormant one (from 340 till 150 degrees). In the inactive solar half, there appeared only 48 groups of the 132 regions, that's barely one third of the entire sunspot group population of 2021.
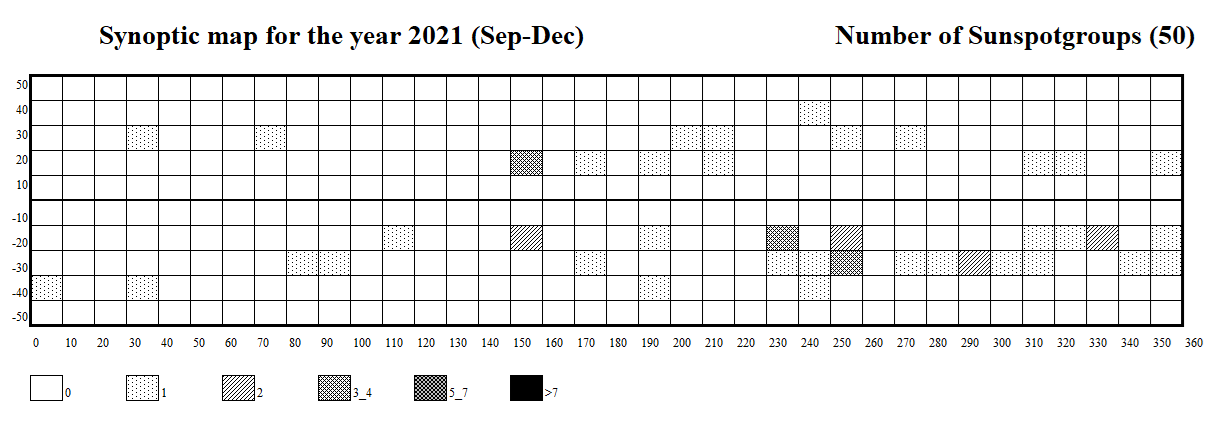
This asymmetry was even more pronounced during the September-December months of 2021 (Carrington rotations 2249-2252), when of the 50 sunspot groups recorded, there were only 11 regions produced by the "calm" solar half (22%). This asymmetry is clear in the synoptic map above. Over the course of its 27-days rotation (as seen from the Earth), the Sun shows every 2 weeks a nearly spotless hemisphere, and 2 weeks later a hemisphere adorned with sunspots. Of note is that the regions that were responsible for the M-class flares in December (see the STCE Newsitem at https://www.stce.be/news/567/welcome.html ), all emerged in the currently active solar hemisphere. The knowledge of the activity on the two solar faces is also important for long-term predictions of parameters such as the solar radio flux. Nonetheless, at some point this asymmetry will break, as the inactive hemisphere starts producing more sunspot groups, or the active side loses a bit of steam, or both.
Their last evening ...
Luc and Ruben could catch more than a glimpse of the northern lights. It was on January 8, their last day in Finland. Before returning to Belgium, they made this photo (N 67 degrees 36.135' / E 24 degrees 09.369').
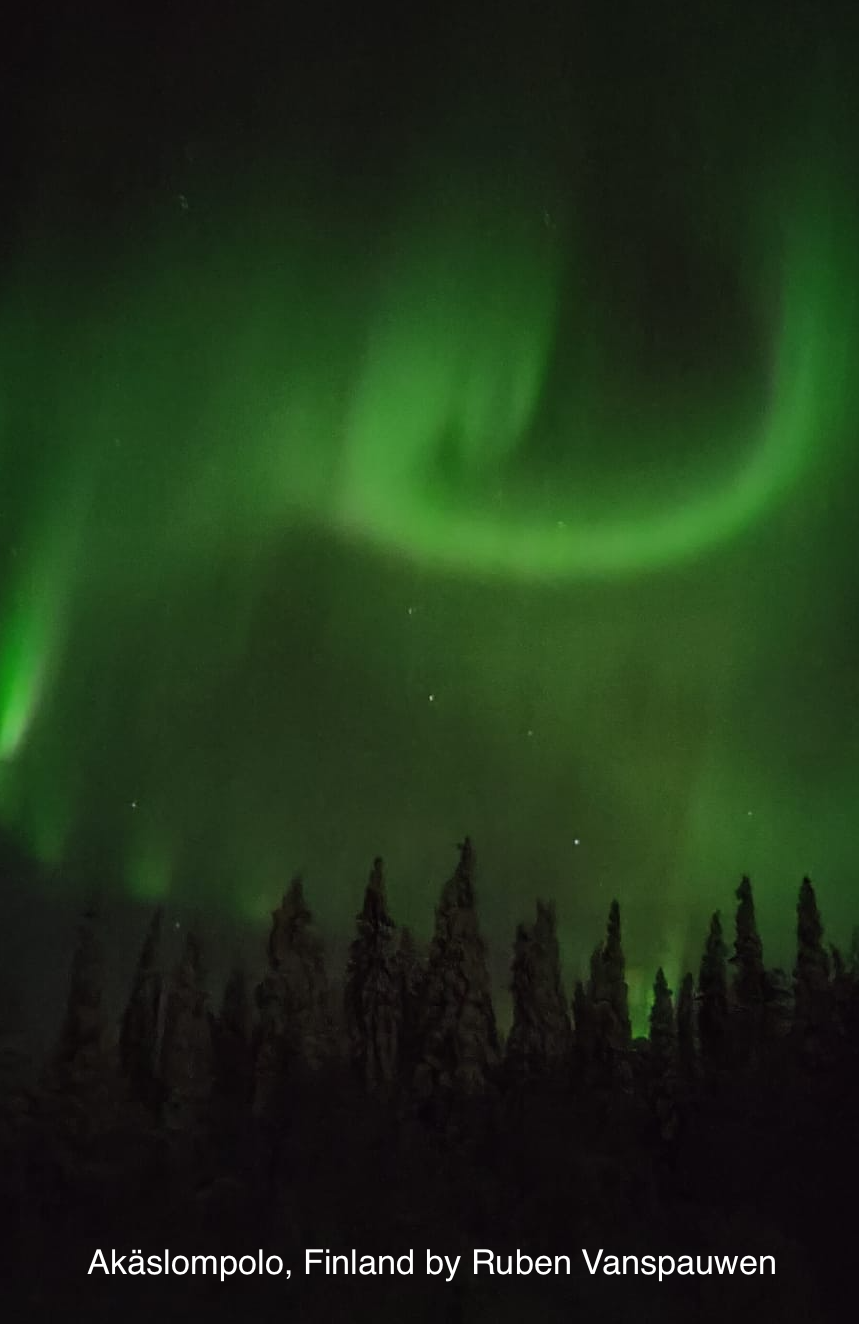
A fast solar wind caught up with a slow solar wind creating the right conditions for polar lights: enough particle and magnetic pressure on the magnetosphere together with a negative Bz triggered a Kp of 5.
PITHIA-NRF : 2nd TNA call and 1st Innovation Day
The PITHIA-NRF project aims at building a European distributed network that integrates observing facilities, data processing tools and prediction models dedicated to ionosphere, thermosphere and plasmasphere research: https://pithia-nrf.eu

They have 2 announcements to make.
PITHIA-NRF invites applications for access to a variety of research facilities for studies and modelling of physical processes acting in the Earth’s upper atmosphere, with support from experts within the field. Call open from 01 January 2022 to 15 March 2022.
More: https://pithia-nrf.eu/tna/tna-calls/second-tna-call
PITHIA-NRF organizes the First Innovation Day on Wednesday 22-06-2022, aiming to make users from SMEs and the aerospace sectors aware of the PITHIA-NRF concept, the expected results, and the possibility to use the nodes for developing projects on validation and calibration of new instrumentation.
More: https://pithia-nrf.eu/innovation/innovation-days
Review of solar and geomagnetic activity
Solar activity
Solar activity was at very low levels for most of the week, increasing to low levels on Jan 06 and Jan 07. There were seven Active Regions (AR) on the disk over the course of the week, most of these were magnetically simple and produced only B-class flares. In the middle of the week, there was some C-class flaring activity originating from NOAA AR 2924, including a C2.7 flare on Jan 07. By then end of the week there were three ARs on the solar disk.
There were multiple filaments observed on disk over the week but there were no Earth-directed Coronal Mass Ejections (CMEs) detected in the available coronagraph imagery.
The greater than 10 MeV proton flux was at nominal levels. The greater than 2 MeV electron flux was enhanced and exceeded the 1000 pfu alert threshold briefly on Jan 08. The 24h electron fluence was at nominal to moderate levels.
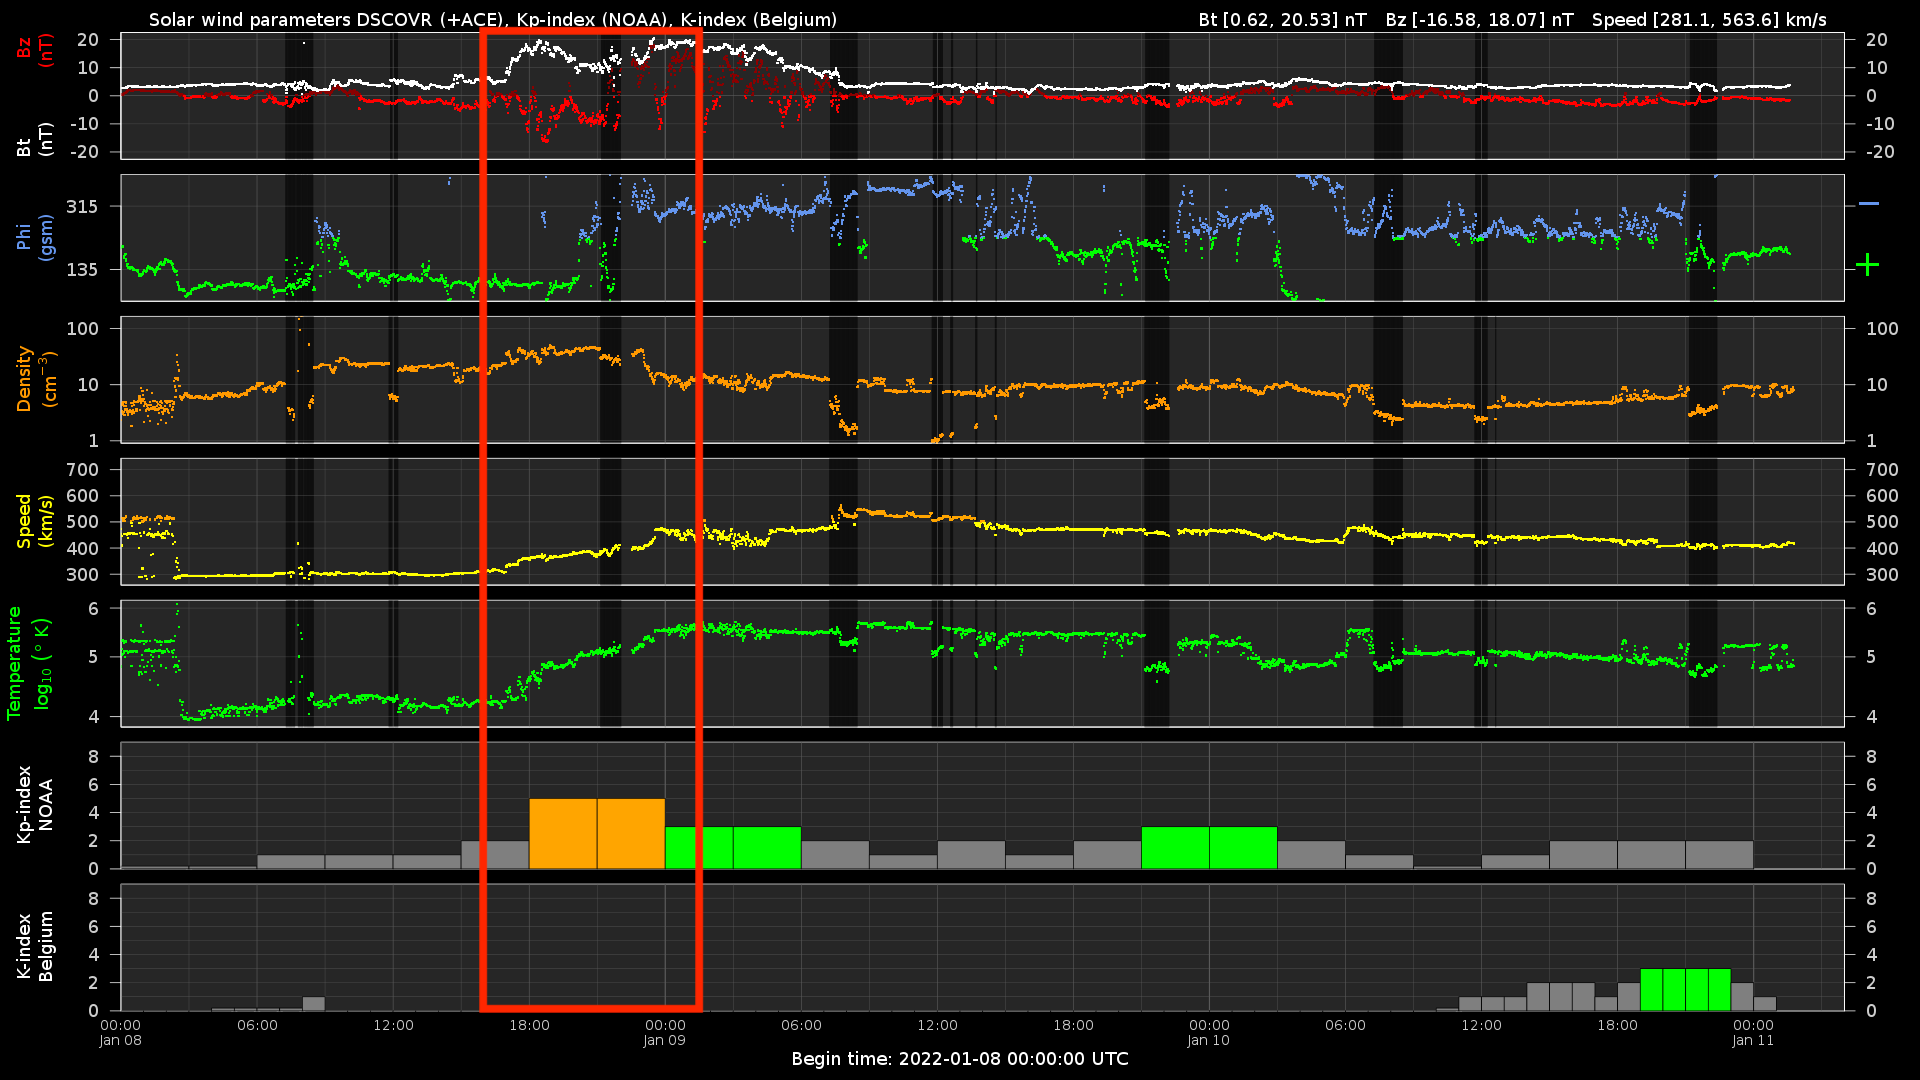
Geomagnetic activity
At the start of the week, the Earth was under the waning influence of a High Speed Stream (HSS) and the solar wind speed reached a maximum value of 620 km/s. The solar wind parameters then gradually decreased and reflected a slow solar wind regime for most of the week. Towards the end of the week, a HSS arrived on Jan 08, associated with the extension to the southern polar Coronal Hole (CH), which began to cross the central meridian on Jan 05. The total magnetic field reached a maximum value of 20 nT, with a minimum Bz of -16 nT on Jan 08. The solar wind speed gradually increased and reached a maximum value of 563 km/s on Jan 09.
Geomagnetic conditions were unsettled to active on Jan 03, with quite conditions prevailing between Jan 04 and Jan 07. There was a short period of minor storm conditions (NOAA Kp=5) in response to the enhanced magnetic field and strong negative Bz associated with the arrival of the HSS on Jan 08.
PROBA2 Observations (3 Jan 2022 - 9 Jan 2022)
Solar Activity
Solar flare activity fluctuated from very low to low during the week.
In order to view the activity of this week in more detail, we suggest to go to the following website from which all the daily (normal and difference) movies can be accessed: https://proba2.oma.be/ssa
This page also lists the recorded flaring events.
A weekly overview movie can be found here (SWAP week 615): https://proba2.sidc.be/swap/data/mpg/movies/weekly_movies/weekly_movie_2022_01_03.mp4
Details about some of this week's events can be found further below.
If any of the linked movies are unavailable they can be found in the P2SC movie repository here: https://proba2.oma.be/swap/data/mpg/movies/
Friday Jan 07
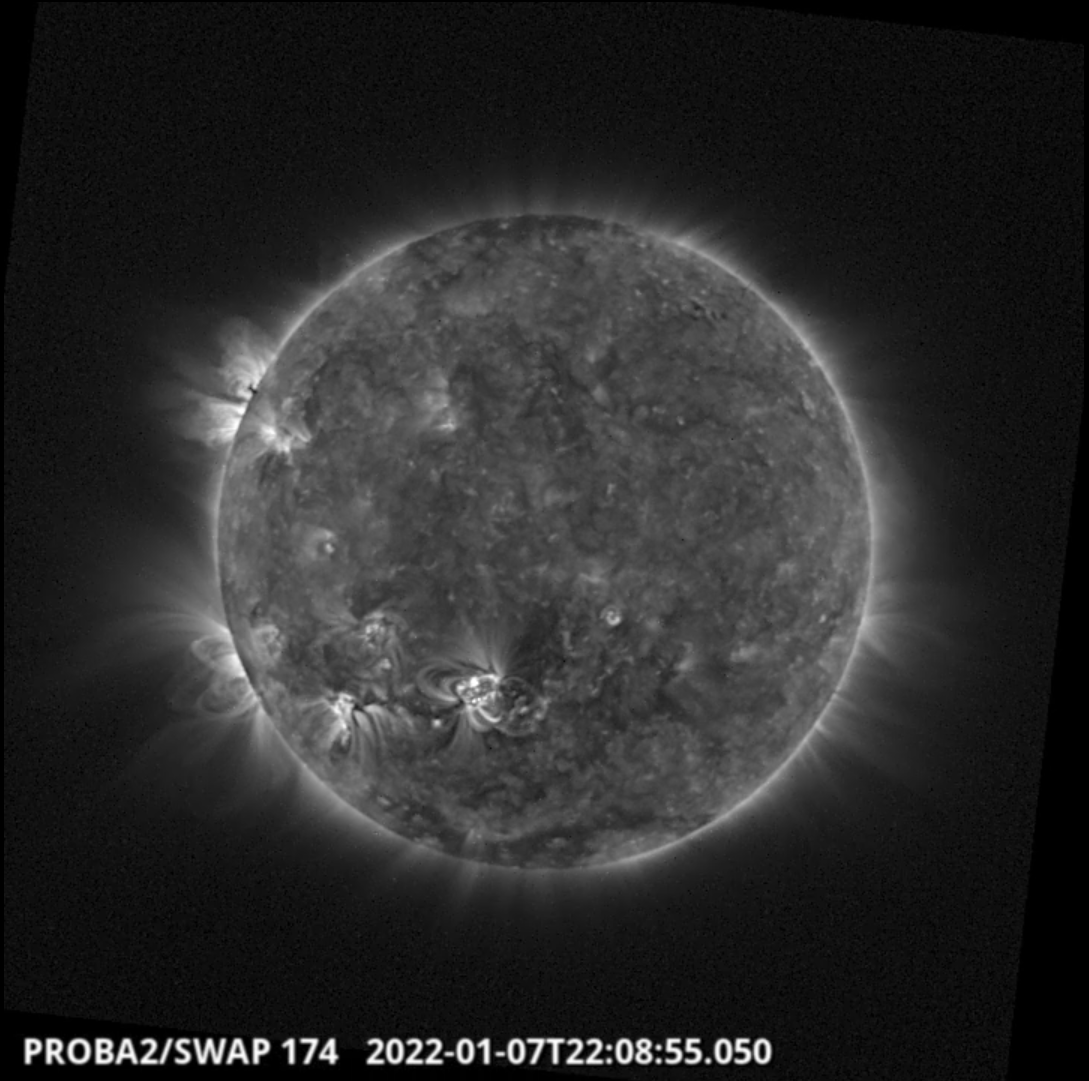
The largest flare of the week, a C2.7 flare, was observed by SWAP and LYRA. The flare is visible near the centre of the solar disk on 2021-Jan-07, as shown in the SWAP image above taken at 22:08 UT.
Find a movie of the event here (SWAP movie): https://proba2.sidc.be/swap/movies/20220107_swap_movie.mp4
The International Sunspot Number by Silso
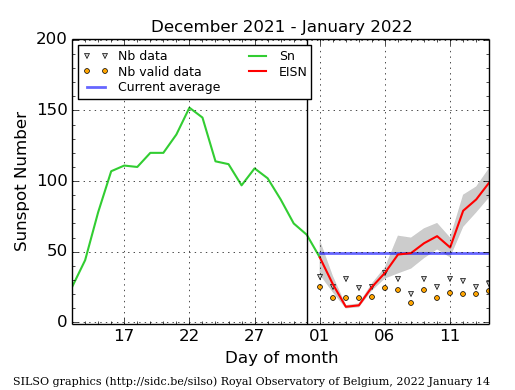
The daily Estimated International Sunspot Number (EISN, red curve with shaded error) derived by a simplified method from real-time data from the worldwide SILSO network. It extends the official Sunspot Number from the full processing of the preceding month (green line), a few days more than one solar rotation. The horizontal blue line shows the current monthly average. The yellow dots give the number of stations that provided valid data. Valid data are used to calculate the EISN. The triangle gives the number of stations providing data. When a triangle and a yellow dot coincide, it means that all the data is used to calculate the EISN of that day.
The SIDC Space Weather Briefing
The Space Weather Briefing presented by the forecaster on duty from Jan 3 to 9. It reflects in images and graphs what is written in the Solar and Geomagnetic Activity report.
A pdf-version: https://www.stce.be/briefings/20220110_SWbriefing.pdf
The movie: https://www.stce.be/briefings/20220110_SWbriefing.m4v
Review of ionospheric activity (3 Jan 2022 - 9 Jan 2022)
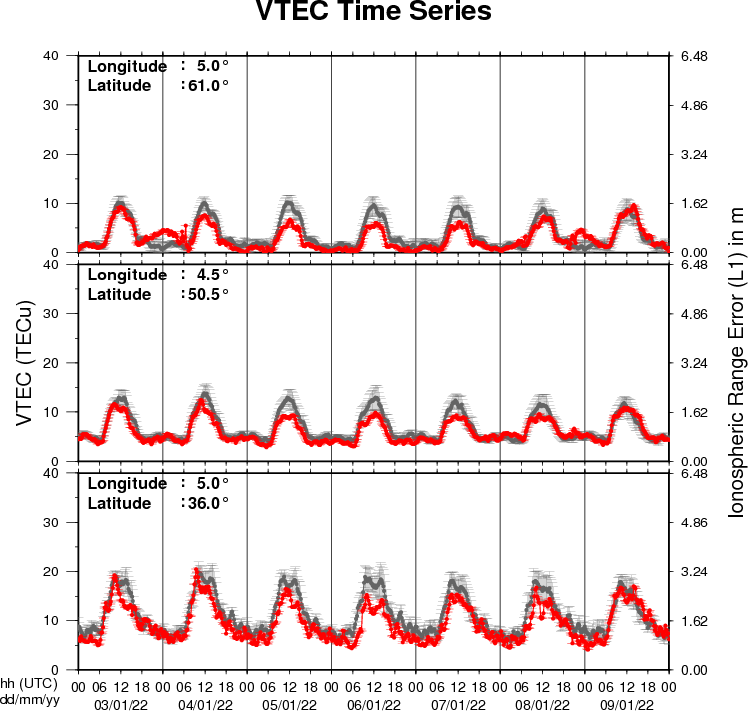
The figure shows the time evolution of the Vertical Total Electron Content (VTEC) (in red) during the last week at three locations:
a) in the northern part of Europe(N 61deg E 5deg)
b) above Brussels(N 50.5deg, E 4.5 deg)
c) in the southern part of Europe(N 36 deg, E 5deg)
This figure also shows (in grey) the normal ionospheric behaviour expected based on the median VTEC from the 15 previous days.
The VTEC is expressed in TECu (with TECu=10^16 electrons per square meter) and is directly related to the signal propagation delay due to the ionosphere (in figure: delay on GPS L1 frequency).
The Sun's radiation ionizes the Earth's upper atmosphere, the ionosphere, located from about 60km to 1000km above the Earth's surface.The ionization process in the ionosphere produces ions and free electrons. These electrons perturb the propagation of the GNSS (Global Navigation Satellite System) signals by inducing a so-called ionospheric delay.
See http://stce.be/newsletter/GNSS_final.pdf for some more explanations ; for detailed information, see http://gnss.be/ionosphere_tutorial.php
Action!
Check out our activity calendar: activities and encounters with the Sun-Space-Earth system and Space Weather as the main theme. We provide occasions to get submerged in our world through educational, informative and instructive activities.
If you want your event in our calendar, contact us: stce_coordination at stce.be
* January 25, Public Lecture on the Solar Corona in EUV (Dutch), Urania, Hove, Belgium
* February 14-18, online Space Weather Introductory Course by SWEC, Space Weather Education Center - registrations are open
* February 22, Public Lecture on Space Weather and Aviation (Dutch), Urania, Hove, Belgium
* February 26, Public Lecture on Space Weather, Satellites and Aviation (Dutch), UGent Volkssterrenwacht Armand Pien, Gent, Belgium
* March 14-16, onsite (!) Space Weather Introductory Course by SWEC, Space Weather Education Center - registrations are open
* April 28, Public Lecture on SDO/EUI, Astropolis, Oostende, Belgium
* August 25, Public Lecture on Space Weather and Aviation, Astropolis, Oostende, Belgium
* October 24-28, 18th European Space Weather Week, Zagreb, Croatia
Check: https://www.stce.be/calendar