- Table of Content
- 1.Solar snake sp...
- 2.Intimidating s...
- 3.Review of sola...
- 4.Review of geom...
- 5.The Internatio...
- 6.Noticeable Sol...
- 7.Geomagnetic Ob...
- 8.The SIDC Space...
- 9.What to do?
2. Intimidating sunspot groups
3. Review of solar activity
4. Review of geomagnetic activity
5. The International Sunspot Number by SILSO
6. Noticeable Solar Events (7 Nov 2022 - 13 Nov 2022)
7. Geomagnetic Observations in Belgium (7 Nov 2022 - 13 Nov 2022)
8. The SIDC Space Weather Briefing
9. What to do?
Solar snake spotted slithering across Sun's surface
Solar Orbiter has spotted a 'tube' of cooler atmospheric gases snaking its way through the Sun's magnetic field. The observation provides an intriguing new addition to the zoo of features revealed by the ESA-led Solar Orbiter mission, especially since the snake was a precursor to a much larger eruption.
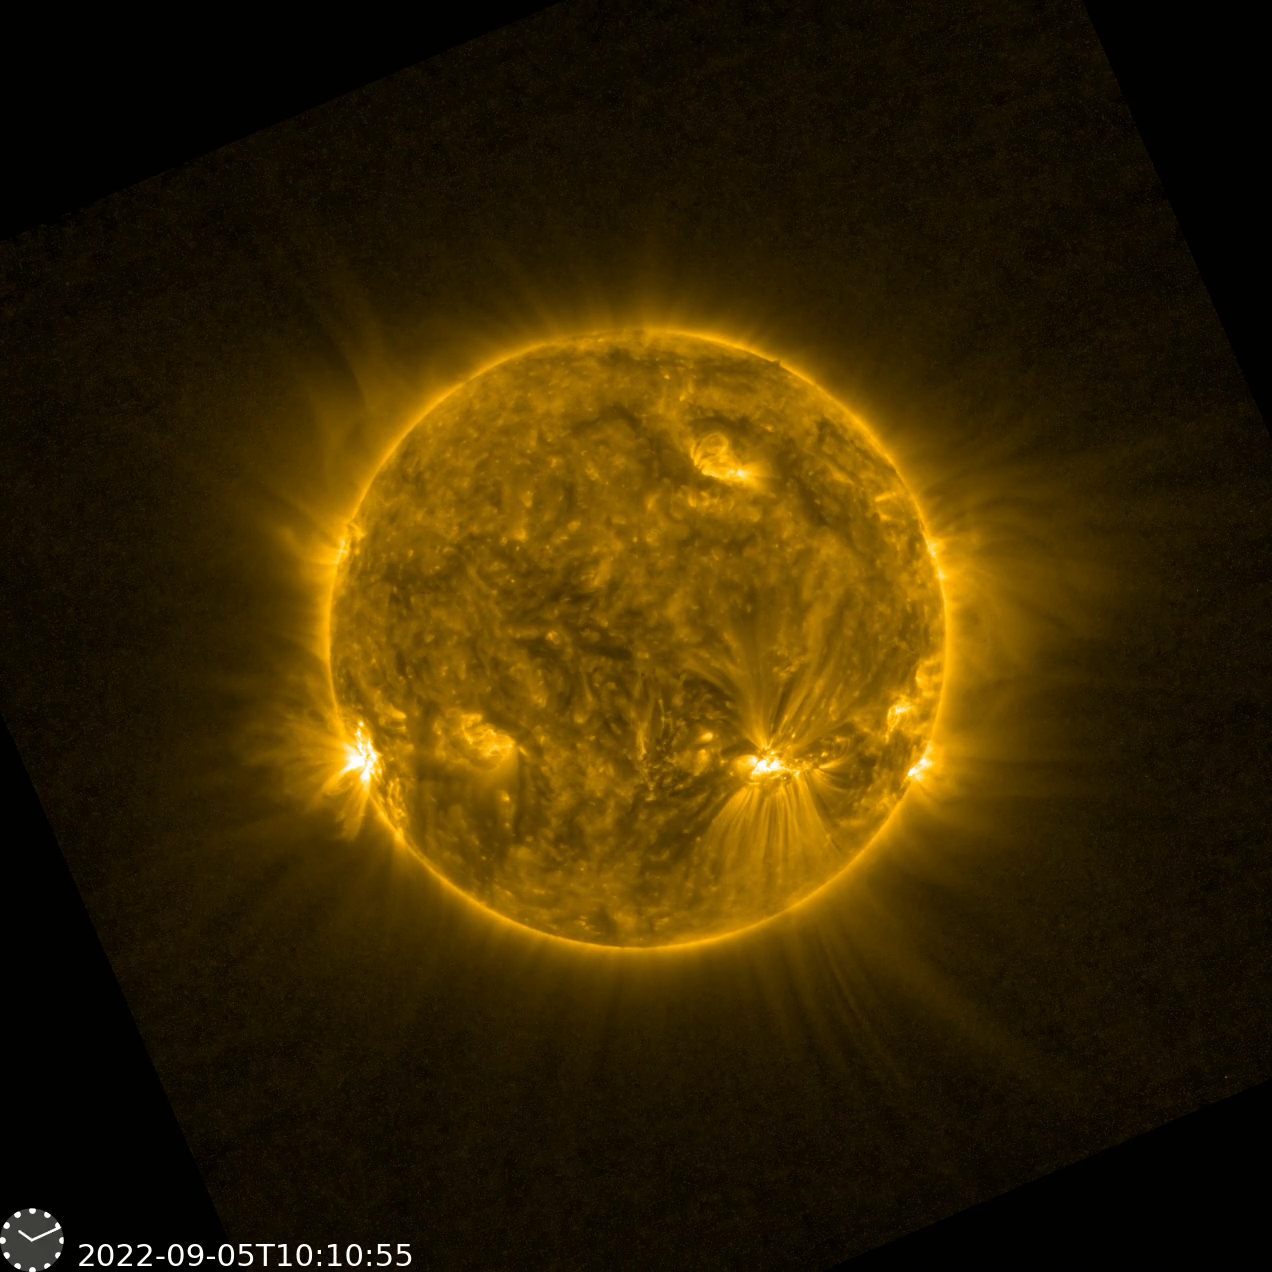
The snake was seen on 5 September 2022, as Solar Orbiter was approaching the Sun for a close pass that took place on 12 October. It is a tube of cool plasma suspended by magnetic fields in the hotter surrounding plasma of the Sun's atmosphere.
Plasma is a state of matter in which a gas is so hot that its atoms begin to lose some of their outer particles, called electrons. This loss makes the gas electrically charged and therefore susceptible to magnetic fields. All gas in the Sun's atmosphere is a plasma because the temperature here is more than a million degrees.
The plasma in the snake is following a particularly long filament of the Sun's magnetic field that is reaching from one side of the Sun to another.
"You're getting plasma flowing from one side to the other but the magnetic field is really twisted. So you're getting this change in direction because we're looking down on a twisted structure," says David Long, Mullard Space Science Laboratory (UCL), UK, who is heading up the investigation into the phenomenon.
The movie has been constructed as a time-lapse from images from the Extreme Ultraviolet Imager onboard Solar Orbiter. In reality, the snake took around three hours to complete its journey but at the distances involved in crossing the solar surface that means the plasma must have been travelling at around 170 kilometres per second.
What makes the snake so intriguing is that it began from a solar active region that later erupted, ejecting billions of tonnes of plasma into space. This raises the possibility that the snake was a sort of precursor to this event – and Solar Orbiter caught it all in numerous instruments.
Solar Orbiter is a space mission of international collaboration between ESA and NASA, operated by ESA. It launched on 10 February 2020, and earlier this month celebrated its 1000th day in space.
More on ESA's website: https://www.esa.int/ESA_Multimedia/Videos/2022/11/Solar_snake_spotted_slithering_across_Sun_s_surface
Intimidating sunspot groups
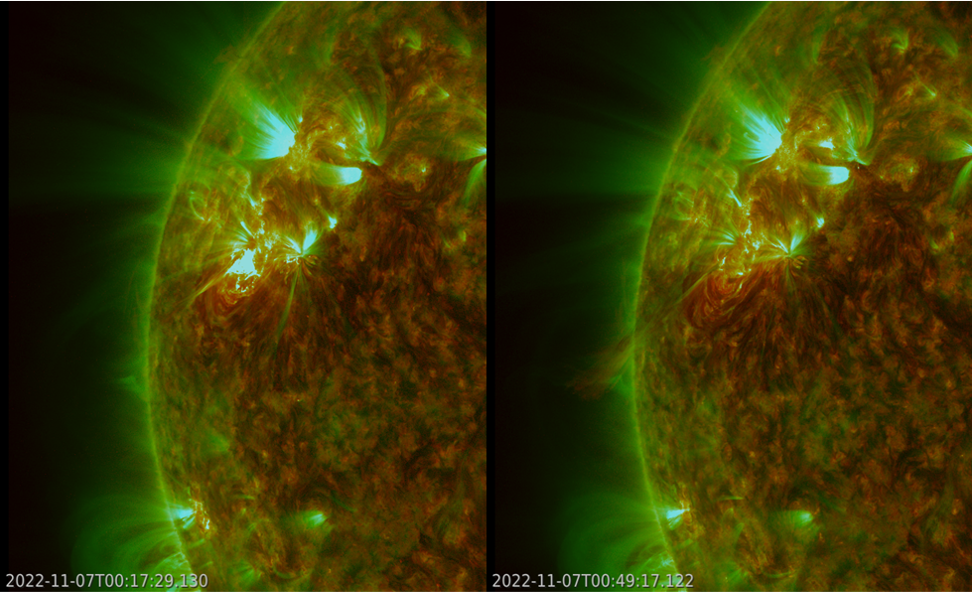
NOAA 13141 rounded the solar east limb as a large sunspot group with a relatively simple magnetic configuration. The trailing portion of this active region produced an M5.2 flare peaking at 00:11UTC on 7 November. The still underneath has an SDO/AIA 171 image (greenish; https://sdo.gsfc.nasa.gov/data/aiahmi/) overlaid on an SDO/AIA 304 image (reddish), showing the solar corona at temperatures of respectively 700.000 and 80.000 degrees. Most of the material associated with the eruption returned fairly quickly to its source location on the Sun. A clip of the eruption is available in the online version of this newsitem at https://www.stce.be/news/613/welcome.html
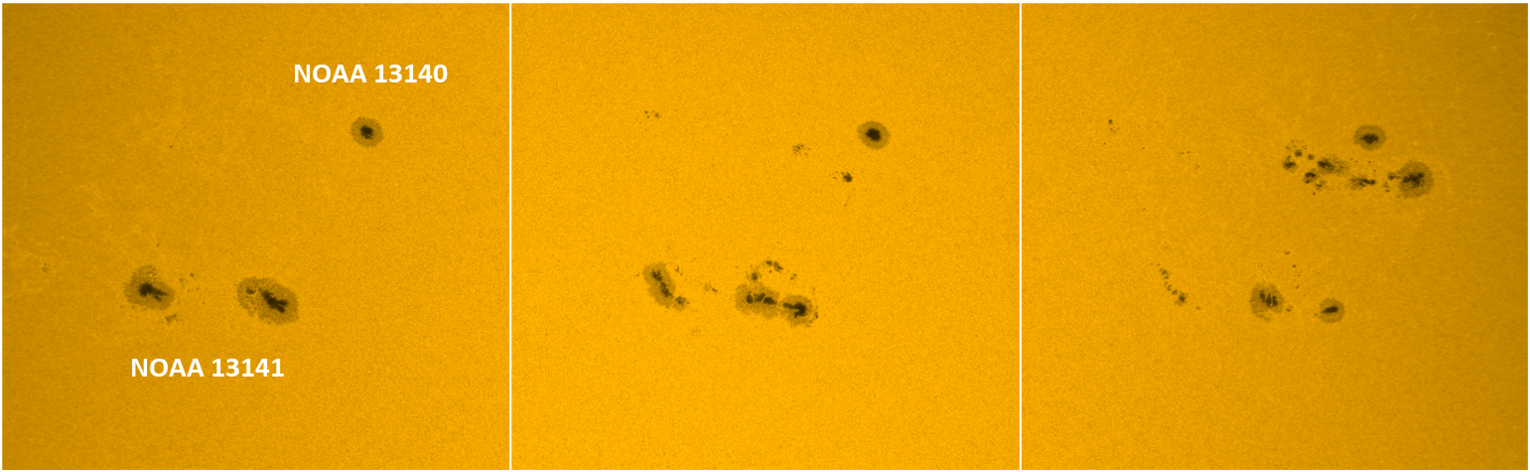
The group then changed very little as it transited the solar disk, with signs of gradual decay in both the leading and trailing main spots. However, on 10 November, while the leading spot was in the process of splitting, some new magnetic flux emerged to the north of these leading spots producing 3 M1 flares in less than 24 hours. The new spots quickly followed the decaying trend of the sunspot group, and thus also the flaring activity diminuished. Meanwhile, a new sunspot group developed just south (less than 3 degrees) of the up-to-then solitary mature sunspot NOAA 13140, located 12 degrees north of NOAA 3141 (see the annotated SDO/HMI images from 7, 11 and 14 November underneath).
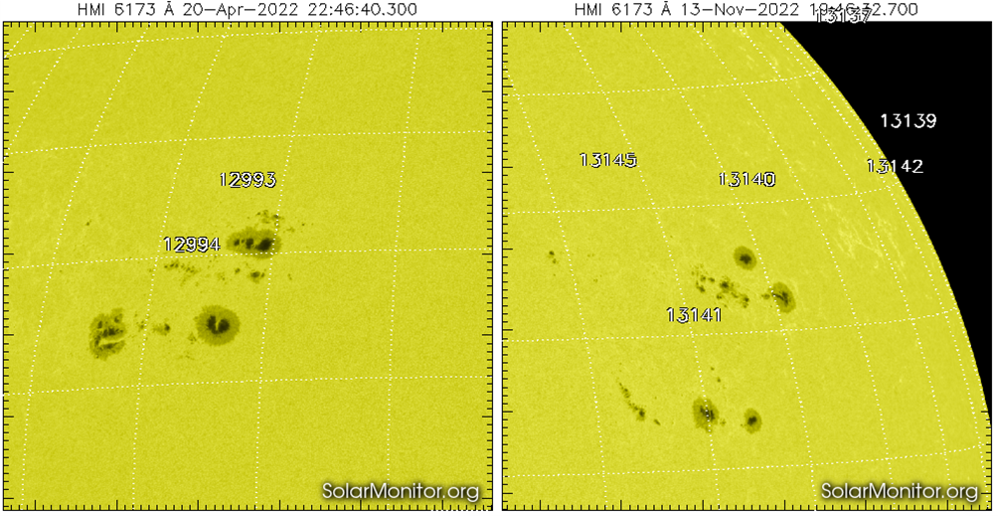
NOAA 13140 continued to grow over the next few days, driving the x-ray background flux over the C1 level before producing a first M-class flare on 15 November. At times, the general outlook of the sunspot structure bore some resemblance to the sunspot group duo NOAA 12993 and 12994 that appeared in April this year. However, those two sunspot groups were much closer to each other than the current pair.
Review of solar activity
Flares
Last week, the largest recorded flare was a M5.2-class flare peaking at 00:11 UTC on November 07. It was produced by the magnetically complex region, Catania Sunspot group 89 (NOAA-AR 3141). This sunspot had produced also three smaller M-class flares and several short-duration C-class flares. The magnetically complex region, Catania Sunspot group 88 (NOAA-AR 3140) produced several C-class flares. The other sunspot groups on the solar surface visible from Earth during this week did not show any significant flaring activity.
Solar Wind
No Earth-directed coronal mass ejections were detected in the available coronagraph imagery over the past week. Associated with the M5.2-class flare an East-directed coronal mass ejection was observed with a Type II Radio Emission. This event was, however, not expected to impact the solar wind near Earth.
Solar Energetic Particles
The greater than 10 MeV proton flux was at nominal levels in the past week. The greater than 2 MeV electron flux was mostly below the 1000 pfu threshold over the past week with some exceptions when it shortly went above the 1000 pfu threshold. The electron fluence was at normal to moderate levels.
Review of geomagnetic activity
Over the past week, the solar wind parameters (ACE and DSCOVR) were nominal to slightly elevated reflecting the influence of the passage of the solar wind structure and high-speed streams from a small and narrow equatorial coronal hole (negative polarity). The solar wind speed ranged between 290 km/s to 550 km/s; the total interplanetary magnetic field went up to 15 nT; and the southward interplanetary magnetic field, Bz component, ranged between -15 nT and 14 nT.
Last week, the geomagnetic conditions were quiet to unsettle with a short period of active conditions. The active period was recorded in the beginning of the week, on November 8, in response of the passage of the solar wind structure that enhanced solar wind conditions with the long duration of negative southward interplanetary magnetic, Bz component.
The International Sunspot Number by SILSO
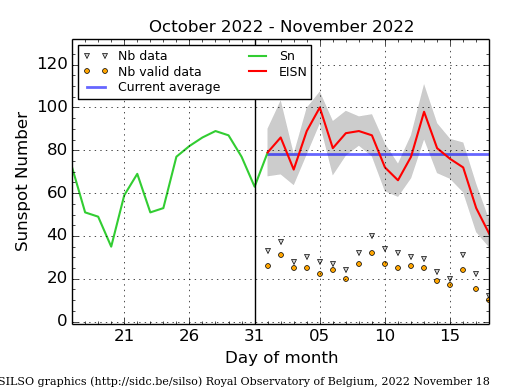
The daily Estimated International Sunspot Number (EISN, red curve with shaded error) derived by a simplified method from real-time data from the worldwide SILSO network. It extends the official Sunspot Number from the full processing of the preceding month (green line), a few days more than one solar rotation. The horizontal blue line shows the current monthly average. The yellow dots gives the number of stations that provided valid data. Valid data are used to calculate the EISN. The triangle gives the number of stations providing data. When a triangle and a yellow dot coincide, it means that all the data is used to calculate the EISN of that day.
Noticeable Solar Events (7 Nov 2022 - 13 Nov 2022)
| DAY | BEGIN | MAX | END | LOC | XRAY | OP | 10CM | TYPE | Cat | NOAA |
| 11 | 0700 | 0714 | 0720 | N14W3 | M1.2 | 1F | VI/2III/3IV/1 | 89 | 3141 | |
| 11 | 1127 | 1140 | 1146 | N12W11 | M1.2 | SN | III/2 | 89 | 3141 | |
| 12 | 0009 | 0018 | 0024 | N16W22 | M1.1 | SF | VI/2 | 89 | 3141 |
| LOC: approximate heliographic location | TYPE: radio burst type |
| XRAY: X-ray flare class | Cat: Catania sunspot group number |
| OP: optical flare class | NOAA: NOAA active region number |
| 10CM: peak 10 cm radio flux |
Geomagnetic Observations in Belgium (7 Nov 2022 - 13 Nov 2022)
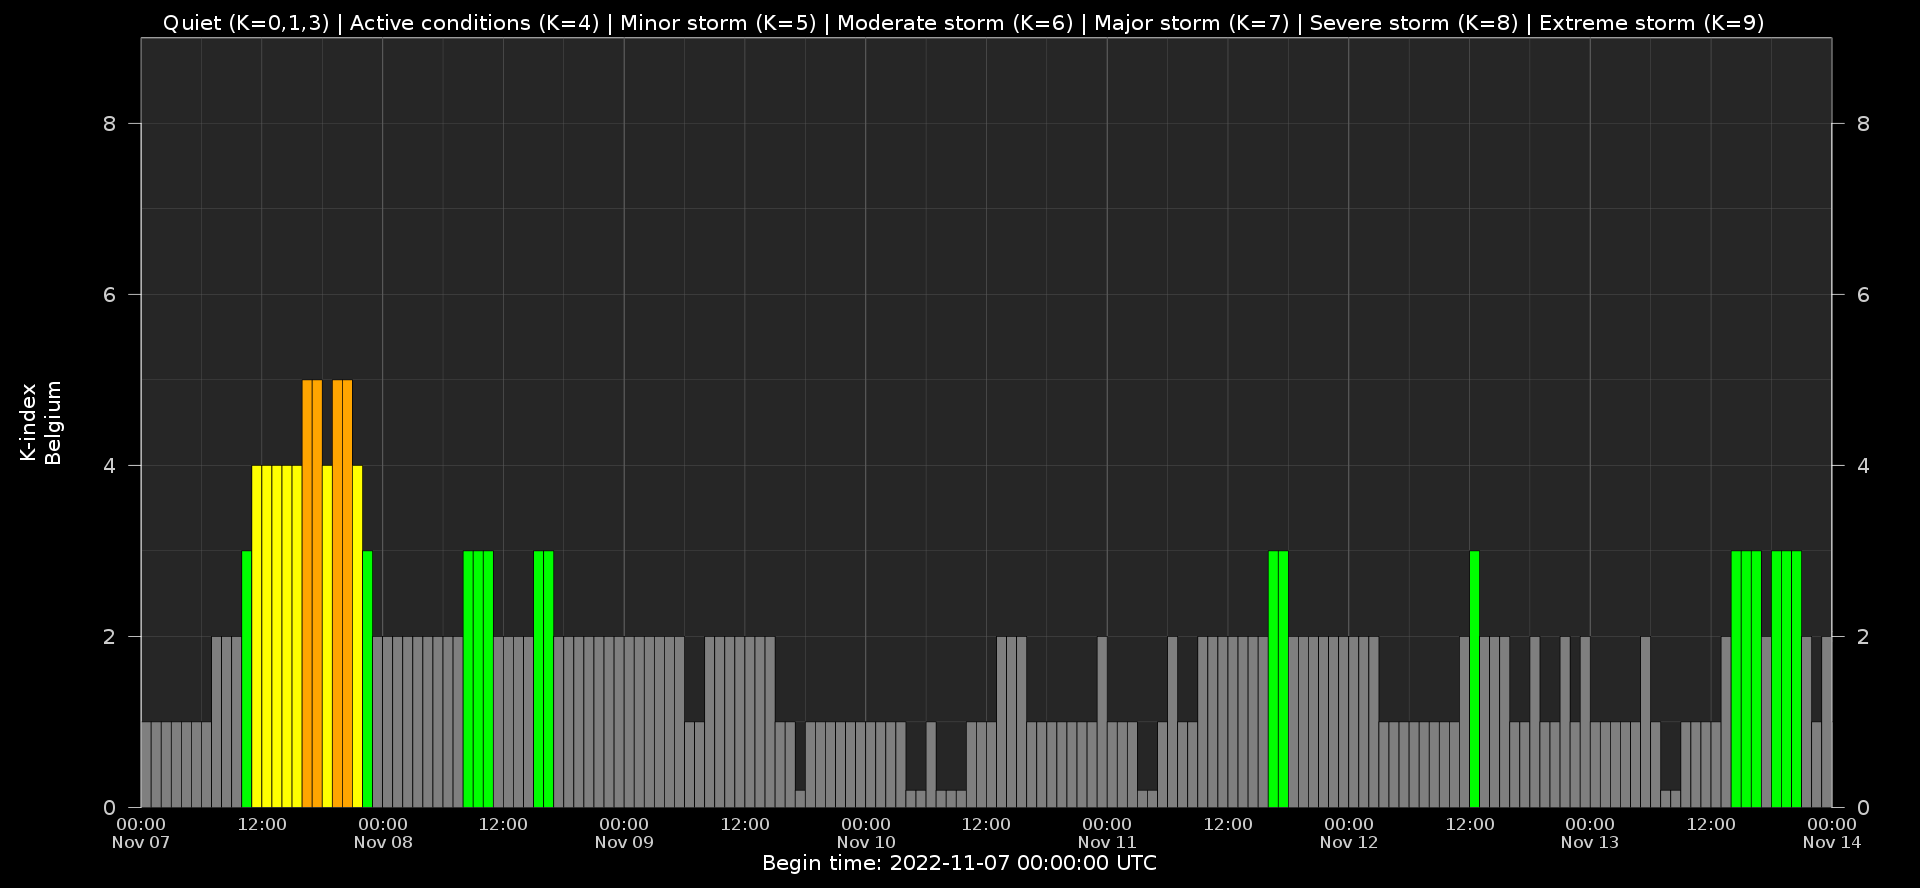
Local K-type magnetic activity index for Belgium based on data from Dourbes (DOU) and Manhay (MAB). Comparing the data from both measurement stations allows to reliably remove outliers from the magnetic data. At the same time the operational service availability is improved: whenever data from one observatory is not available, the single-station index obtained from the other can be used as a fallback system.
Both the two-station index and the single station indices are available here: http://ionosphere.meteo.be/geomagnetism/K_BEL/
The SIDC Space Weather Briefing
The Space Weather Briefing presented by the forecaster on duty from Nov 6 to 13. It reflects in images and graphs what is written in the Solar and Geomagnetic Activity report: https://www.stce.be/briefings/20221114_SWbriefing.pdf
If you need to access the movies, contact us: stce_coordination at stce.be
What to do?
Check out our activity calendar: activities and encounters with the Sun-Space-Earth system and Space Weather as the main theme. We provide occasions to get submerged in our world through educational, informative and instructive activities.
If you want your event in our calendar, contact us: stce_coordination at stce.be
* November 21-23, Space Weather Introductory Course - onsite, by the STCE, Brussels, Belgium - fully booked
* November 21, Seminar:
Improving the tropical modes of atmosphere variability with a stochastic parameterization of convection, onsite and online, RMI
* November 22, Seminar: Ionospheric Disturbances Detection by HF Doppler sounding, onsite and online, STCE
* November 27, Dag van de Wetenschap, Planetarium, Belgium
* December 1, Seminar: Total Ozone, UV and radiosonde measurements at Princess Elisabeth Station, Antarctica; onsite and online, RMI
* December 5, 6, 8, 9, Space Weather Introductory Course - online, by the STCE, zoom - fully booked
* December 8, Seminar: Citizen weather reports at RMIB and their use for radar-based hail detection verification, onsite and online, RMI
Check: https://www.stce.be/calendar