- Table of Content
- 1.The story behi...
- 2.Review of sola...
- 3.Review of geom...
- 4.The Internatio...
- 5.Noticeable Sol...
- 6.Geomagnetic Ob...
- 7.The SIDC Space...
- 8.What to attend
2. Review of solar activity
3. Review of geomagnetic activity
4. The International Sunspot Number by SILSO
5. Noticeable Solar Events (28 Nov 2022 - 4 Dec 2022)
6. Geomagnetic Observations in Belgium (28 Nov 2022 - 4 Dec 2022)
7. The SIDC Space Weather Briefing
8. What to attend
The story behind 3 solar flares
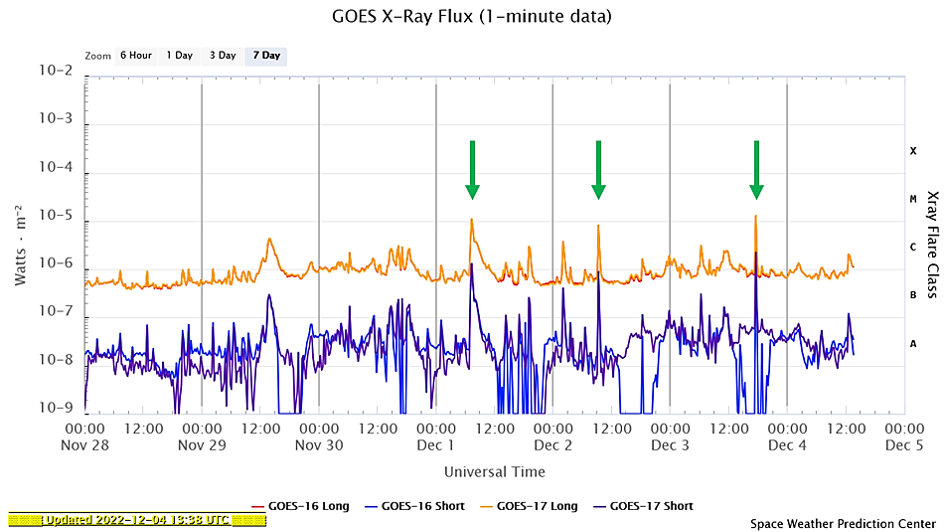
Last week's solar activity was characterized by a number of interesting solar flares. An M1 flare was recorded on 1 December at 07:21UTC, a C8 flare took place on 2 December peaking at 09:20UTC, and another M1 flare was observed on 3 December at 17:41UTC. The flares are indicated in the graph underneath, displaying the soft x-ray (SXR) flux measured between 0.1 and 0.8 nm by the GOES-17 satellite (the orange curve ; https://www.swpc.noaa.gov/products/goes-x-ray-flux).
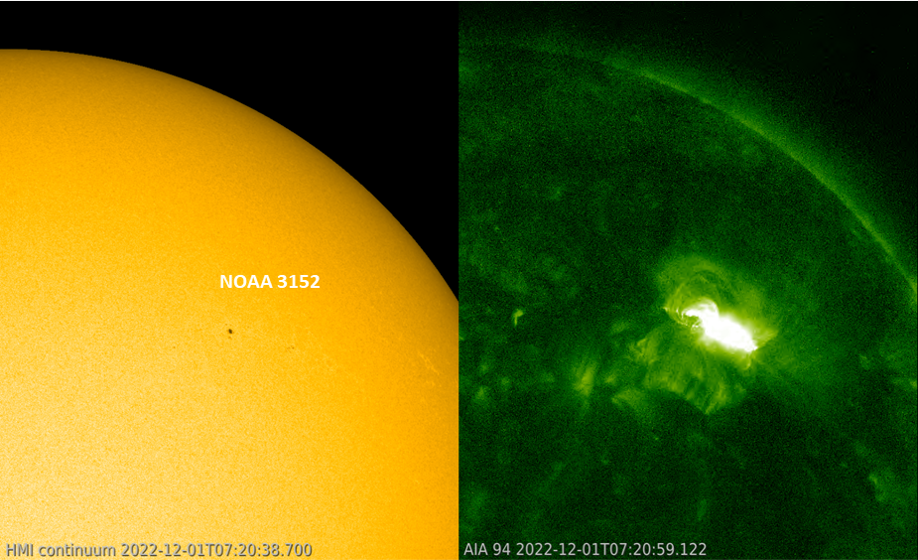
The first M1 flare was also the most complex of the three eruptions, with post-flare coronal loops being visible for several hours after the SXR peak. As can be seen in the imagery underneath, it took place in a small and decaying sunspot region (NOAA 3152) that seemed to have a fairly simple magnetic configuration. Though it is well known that eruptions can take place in decaying active regions, it's a whole different story to predict if a flare will occur and how intense it will be. The SDO (https://sdo.gsfc.nasa.gov/data/aiahmi/ ) images underneath display the Sun in white light (left) and in extreme ultraviolet (EUV) at a wavelength of 9.4 nm (AIA 094 ; right), showing the solar corona at a temperature of several million degrees. Clips are available in the online version of the news item at https://www.stce.be/news/617/welcome.html Each clip covers 6 hours, with a cadence of one image every 3 minutes.
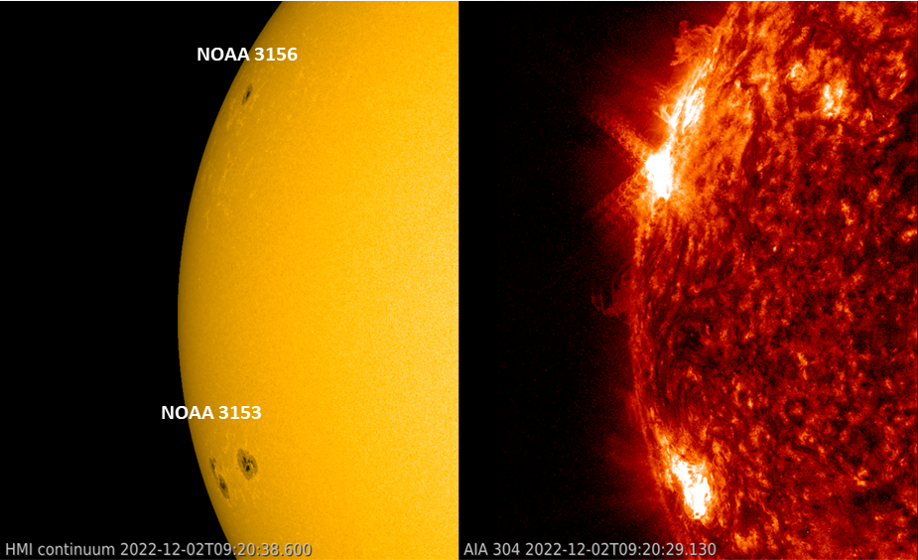
The C8 flare originated from near the northeast limb. It was not so easy to determine which sunspot group was the source location of the event, as EUV imagery indicated that its location was to the south and east ("left") of NOAA 3156, but apparently still in front (to the west or "right") of NOAA 3157 that still had to round the solar limb at that time. The SDO imagery underneath shows the eruption at temperatures around 80,000 degrees (AIA 304 ; right), and the view in white light on the left. NOAA 3156 is the spot to the north, NOAA 3157 is not visible yet.
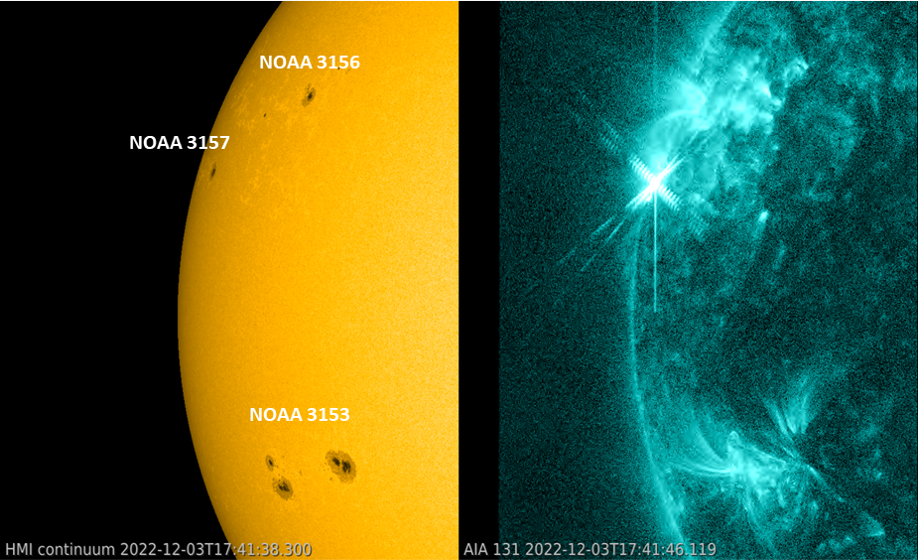
The second M-class flare originated from the same area, but this time apparently from the trailing portion of NOAA 3157 (the sunspot closest to the limb), as can be seen in the SDO imagery underneath. The image to the right is again in EUV, but this time the filter (AIA 131) displays both the hot parts in the Sun's upper atmosphere (corona) at several million degrees, as well as some cooler parts around 400.000 degrees. To the left is a white light image. The flaring event didn't last 10 minutes, and so this impulsive M1 flare barely shows in the clip. The screenshot shows blooming and some diffraction patterns, the origins of which are explained in this STCE news item at https://www.stce.be/news/499/welcome.html (Note 1).
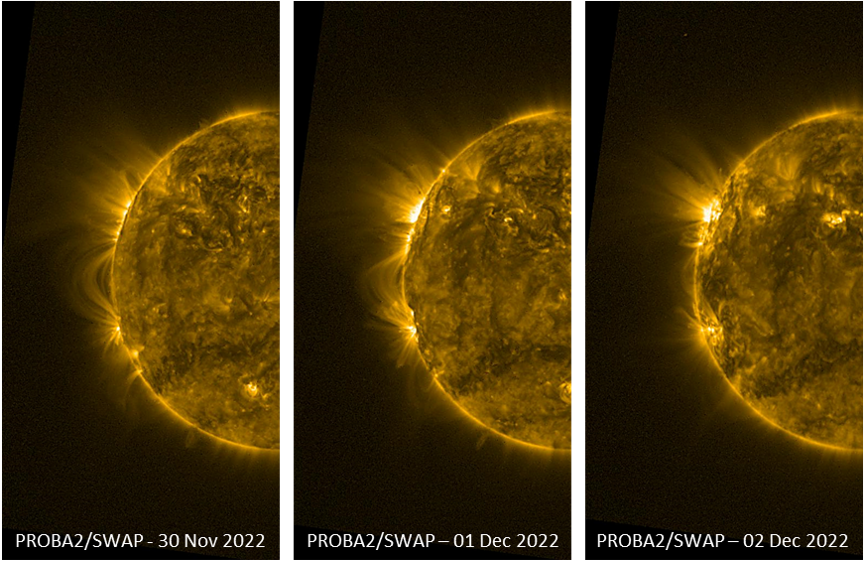
Meanwhile, the big sunspot group NOAA 3153 on the southern solar hemisphere remained relatively quiet, producing only a few low-level C-class flares so far. The region seemed connected by a series of trans-equatorial coronal loops to its counterpart on the northern solar hemisphere NOAA 3157 and surroundings. The PROBA2/SWAP images (https://proba2.sidc.be/ ) show the structure as the active regions rotate over the east limb from 30 November to 2 December. These loops are of interest to the solar physics community, for example in determining the plasma properties in the outer corona (see e.g. Zaqarashvili et al. 2013 - https://ui.adsabs.harvard.edu/abs/2013A%26A...555A..55Z/abstract ).
Review of solar activity
Flares and Solar Radio Bursts
Solar flaring activity was at low levels for most of the week, increasing to moderate levels on December 01 and December 03 when isolated M-class flares were recorded. In the second half of the week, a number of active regions began to rotate onto the disk over the east limb onto the solar disk. NOAA AR 5153 rotated onto the disk on December 01, and was the largest active region observed over the week but produced on C-class flares. The largest flare of the week was an M1.2 flare on December 03, peaking at 17:41 UT, observed on the north east limb and associated with NOAA 3157. This event was also associated with a Type II radio burst. During the week, there were seven other active regions on the disk but these were mostly simple regions that produced only C-class flares.
Solar wind disturbances: Coronal Mass Ejections
A filament, stretching from the north east quadrant to the south east quadrant, began to erupt from 14:38 UT on November 29 as in SDO/AIA 304. The associated slow Coronal Mass Ejections (CME) was predominantly directed to the south east. The analysis at the time did not expect an Earth arrival but a weak transient feature seen in the solar wind magnetic field in December 04 could be associated with this event.
No other Earth directed CMEs were detected in the available coronagraph imagery.
Solar wind disturbances: Coronal holes
On November 28, a large trans-equatorial positive polarity coronal hole was transiting the central meridian. At the end of the week, On December 04, a large trans-equatorial negative polarity coronal hole was transiting the central meridian.
Energetic particles near the earth
The greater than 10 MeV proton flux was at background levels. The greater than 2 MeV electron flux was above the 1000 pfu threshold for the second half of the week, with a peak value of 17,351 pfu on December 03. The 24h electron fluence was at moderate levels from November 30 and reached high levels on December 04 with a maximum value of 5.7e8.
Review of geomagnetic activity
The solar wind parameters reflected the waning influence of a high-speed stream at the start of the week. A subsequent high-speed stream began to influence the Earth from November 28. The solar wind speed gradually increased from 400 km/s on November 27 to values over 700km/s on November 29. The interplanetary magnetic field ranged between 1 and 12 nT. The magnetic field orientation was predominantly in the positive sector (field directed away from the Sun) for the entire week. The solar wind speed remained elevated for the rest of the week with values between 500 and 700 km/s, due to the influence of the high-speed stream from the positive polarity hole, which crossed the central meridian on November 28.
Geomagnetic conditions were at unsettled to active levels on 27 November. From November 28 to December 01, during the height of the influence of the high-speed stream, the conditions were mostly active with multiple periods of minor storm levels. From December 02, the geomagnetic conditions reduced to unsettled to active levels for the rest of the week as the influence of the high-speed stream began to wane.
The International Sunspot Number by SILSO

The daily Estimated International Sunspot Number (EISN, red curve with shaded error) derived by a simplified method from real-time data from the worldwide SILSO network. It extends the official Sunspot Number from the full processing of the preceding month (green line), a few days more than one solar rotation. The horizontal blue line shows the current monthly average. The yellow dots give the number of stations that provided valid data. Valid data are used to calculate the EISN. The triangle gives the number of stations providing data. When a triangle and a yellow dot coincide, it means that all the data is used to calculate the EISN of that day.
Noticeable Solar Events (28 Nov 2022 - 4 Dec 2022)
| DAY | BEGIN | MAX | END | LOC | XRAY | OP | 10CM | TYPE | Cat | NOAA |
| 01 | 0704 | 0721 | 0736 | N28W34 | M1.0 | 1N | III/2VI/2CTM/1 | 6 | 3152 | |
| 03 | 1736 | 1741 | 1745 | N18E83 | M1.2 | SN | III/2II/2 | 3157 |
| LOC: approximate heliographic location | TYPE: radio burst type |
| XRAY: X-ray flare class | Cat: Catania sunspot group number |
| OP: optical flare class | NOAA: NOAA active region number |
| 10CM: peak 10 cm radio flux |
Geomagnetic Observations in Belgium (28 Nov 2022 - 4 Dec 2022)
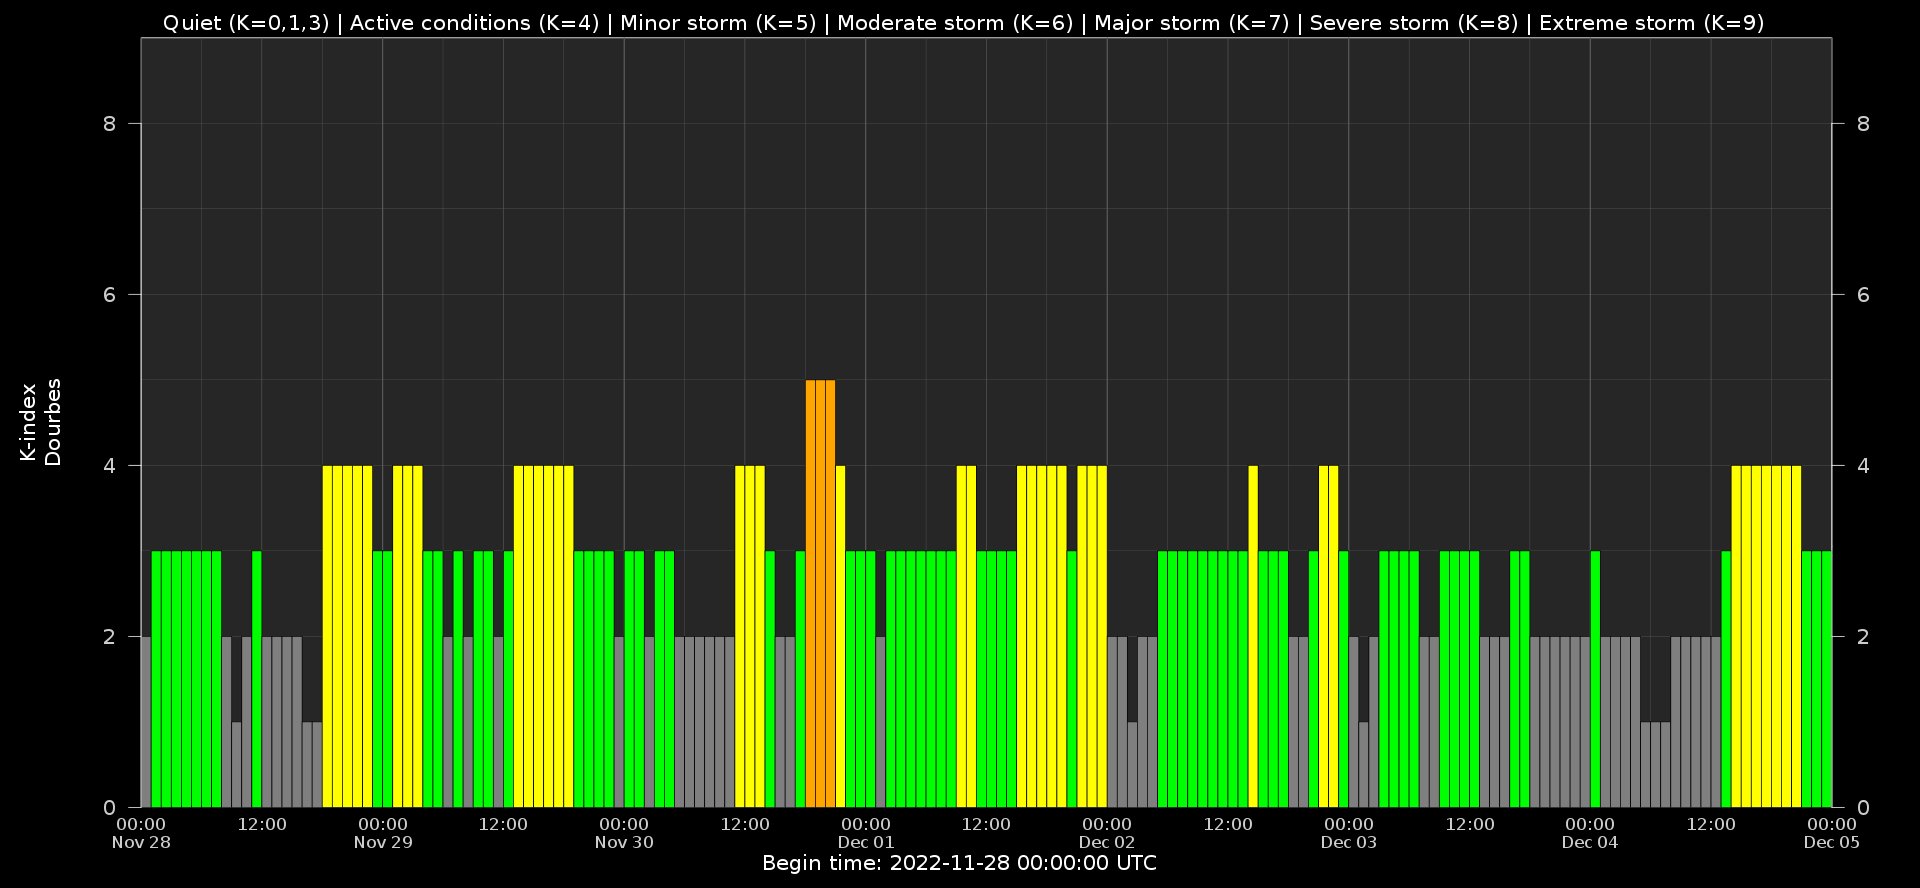
Local K-type magnetic activity index for Belgium based on data from Dourbes (DOU) and Manhay (MAB). Comparing the data from both measurement stations allows to reliably remove outliers from the magnetic data. At the same time the operational service availability is improved: whenever data from one observatory is not available, the single-station index obtained from the other can be used as a fallback system.
Both the two-station index and the single station indices are available here: http://ionosphere.meteo.be/geomagnetism/K_BEL/
The SIDC Space Weather Briefing
The Space Weather Briefing presented by the forecaster on duty from Nov 28 to Dec 4. It reflects in images and graphs what is written in the Solar and Geomagnetic Activity report: https://www.stce.be/briefings/20221205_SWbriefing.pdf
If you need to access the movies, contact us: stce_coordination at stce.be
What to attend
Check out our activity calendar: activities and encounters with the Sun-Space-Earth system and Space Weather as the main theme. We provide occasions to get submerged in our world through educational, informative and instructive activities.
If you want your event in our calendar, contact us: stce_coordination at stce.be
* November 21-23, Space Weather Introductory Course - onsite, by the STCE, Brussels, Belgium - fully booked
* November 27, Dag van de Wetenschap, Planetarium, Belgium
* December 1, Seminar: Total Ozone, UV and radiosonde measurements at Princess Elisabeth Station, Antarctica; onsite and online, RMI
* December 5, 6, 8, 9, Space Weather Introductory Course - online, by the STCE, zoom - fully booked
* December 8, Seminar: Citizen weather reports at RMIB and their use for radar-based hail detection verification, onsite and online, RMI
* December 16, Seminar: Tipping of the Atlantic Ocean Circulation, onsite and online, RMI
* December 16, Seminar: Opportunities of Wikipedia and related applications for science, BIRA-IASB
* December 19, school presentation ‘Noorderlicht, hemelse wetenschap en spannende verhalen’, Kortrijk-Dutsel, Belgium
* January 30, 31, February 2, 3, Space Weather Introductory Course - online, by the STCE, zoom
* March 27-29, Space Weather Introductory Course - onsite, by the STCE, Brussels, Belgium
* May 22-24, Space Weather Introductory Course - onsite, by the STCE, Brussels, Belgium
Check: https://www.stce.be/calendar
