- Table of Content
- 1.SC25 going str...
- 2.Where to go an...
- 3.Review of sola...
- 4.The SIDC Space...
- 5.The Internatio...
- 6.Review of iono...
- 7.Geomagnetic Ob...
- 8.PROBA2 Observa...
2. Where to go and what to do
3. Review of solar and geomagnetic activity
4. The SIDC Space Weather Briefing
5. The International Sunspot Index by SILSO
6. Review of ionospheric activity (30 Jan 2023 - 5 Feb 2023)
7. Geomagnetic Observations in Belgium (30 Jan 2023 - 5 Feb 2023)
8. PROBA2 Observations (30 Jan 2023 - 5 Feb 2023)
SC25 going strong
The STCE's SC25 Tracking page (https://www.stce.be/content/sc25-tracking ) has been updated to reflect the latest evolution in some critical space weather parameters for the ongoing solar cycle 25 (SC25), from sunspot numbers over geomagnetic indices all the way to cosmic rays. The multiple graphs allow for a comparison with previous solar cycles at similar stages in their evolution.
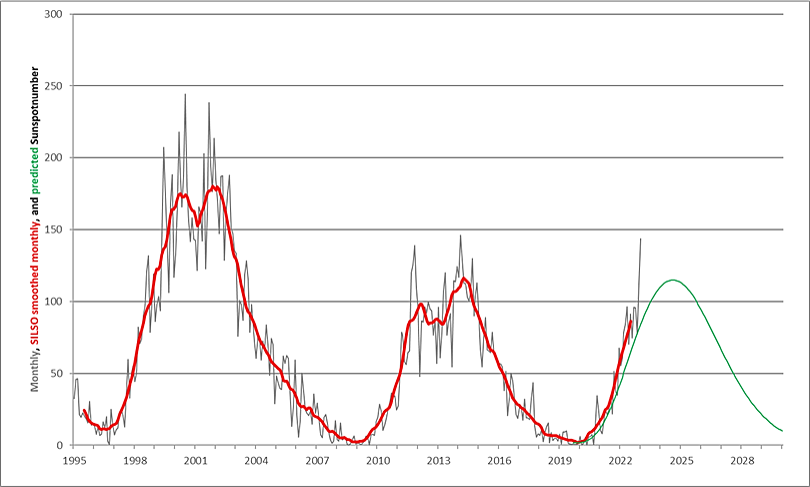
After a relatively stable period in solar activity lasting from March till November 2022 and with monthly sunspot numbers between 75 and 95, solar activity increased significantly in December 2022 and January 2023. The provisional monthly sunspot number reached values of respectively 113.1 and 143.6 (SILSO - https://www.sidc.be/silso/ ), reminiscent of the previous solar cycle maximum. Based on this surge in solar activity, the Solar Cycle Science webpage (http://solarcyclescience.com/forecasts.html ; best fitting curve for a single maximum) now gives a maximum for SC25 around 145. The results from the SILSO prediction methodologies (https://www.sidc.be/silso/ssngraphics ; 12-month window) are somewhat diverging, but favor sunspot numbers well above the ones initially predicted by the SC25 panel, i.e. well above 115. These numbers can change further pending the evolution of solar activity in the coming months. Also, there's still a good possibility that SC25 may have a similar outlook as SC24, i.e. with 2 moderate, well-separated maxima.
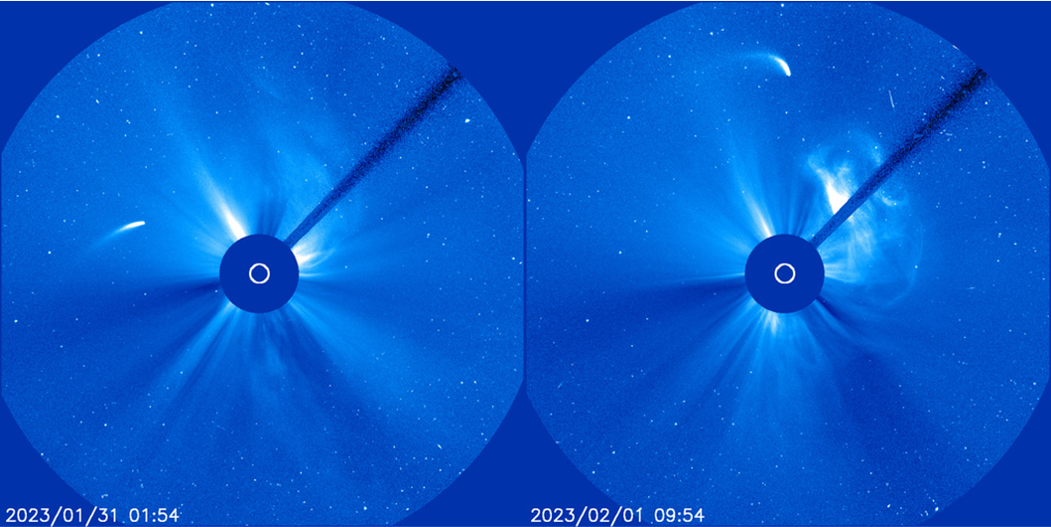
The increase in sunspot numbers was accompanied by a corresponding enhancement in other solar parameters, such as the solar radio flux and the number of solar flares. Also the number of coronal mass ejections (CME) was near an average of 6/day again. The imagery underneath shows enhanced CME activity late on January 2023 as seen by the SOHO/LASCO C3 coronagraph (https://soho.nascom.nasa.gov/ ), with comet 96P/Machholz passing by. This is a short-periodic comet with an orbital period of 5.3 years that comes very close to the Sun during each of its close encounters with our star, up to about 18 million km. Since SOHO's launch in December 1995, this was the 6th time comet Machholz was seen by SOHO's coronagraph after earlier appearances in 1996, 2002, 2007, 2012, and 2017. A clip and compilation are in the online version of this article at https://www.stce.be/news/626/welcome.html Let's hope SOHO will still be around to observe the next passage of comet Machholz in 2028!
Where to go and what to do
Check out our activity calendar: activities and encounters with the Sun-Space-Earth system and Space Weather as the main theme. We provide occasions to get submerged in our world through educational, informative and instructive activities and workshops or conferences.
If you want your event in our calendar, contact us: stce_coordination at stce.be
* February 17, STCE seminar: Point spread function corrections in solar physics, Brussels, Belgium
* March 14, PITHIA-NRF High Profile Meeting, Brussels, Belgium
* March 15, PITHIA-NRF Innovation Day, Brussels, Belgium
* March 16, PITHIA-NRF Training for Partners, Brussels, Belgium
* March 17, PITHIA-NRF Workshop for Optimization of Observational Strategies, Brussels, Belgium
* March 27-29, Space Weather Introductory Course - onsite, by the STCE, Brussels, Belgium - FULL
* May 22-24, Space Weather Introductory Course - onsite, by the STCE, Brussels, Belgium - FULL
* May 29 - June 1, PITHIA-NRF Training School, Rome, Italy
Check: https://www.stce.be/calendar

Review of solar and geomagnetic activity
SOLAR ACTIVITY
There were ten active regions visible (NOAA ARs 3198, 3199, 3201, 3204, 3205, 3206, 3207, 3208, 3209, 3210, 321). They all had relatively simple alpha or beta magnetic field configurations and produced only C-class flares, 32 of them.
Several CMEs were observed, but only one with a possible Earth-directed component, on 3 February at 10:36 UTC (LASCO C2) with possible arrival on 7 February.
Two negative polarity equatorial coronal holes were visible in the week. The first one observed at the beginning of the week was small, the second one crossed central meridian on 2 February and had a larger size.
GEOMAGNETIC ACTIVITY
Geomagnetic conditions were mostly quiet to unsettled throughout the week, except short periods of active geomagnetic conditions on 1-2 February.
A small shock was seen on 1 February before a mild high speed stream from the first coronal hole with negative polarity.
A weak ICME was observed on 3 February, with Bz down to -10 nT but slow speed (around 350 km/s). As such, it did not have geomagnetic consequences.
The SIDC Space Weather Briefing
The Space Weather Briefing presented by the forecaster on duty from Jan 30 to Feb 5. It reflects in images and graphs what is written in the Solar and Geomagnetic Activity report: https://www.stce.be/briefings/20230206_SWbriefing.pdf

If you need to access the movies, contact us: stce_coordination at stce.be
The International Sunspot Index by SILSO
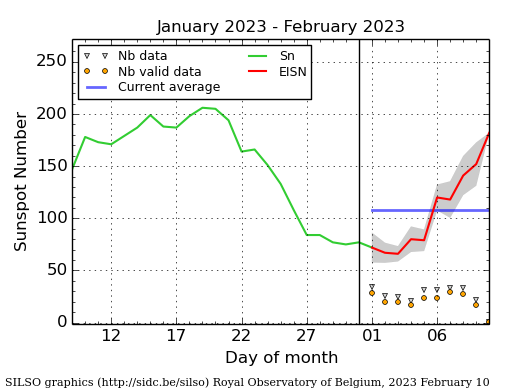
The daily Estimated International Sunspot Number (EISN, red curve with shaded error) derived by a simplified method from real-time data from the worldwide SILSO network. It extends the official Sunspot Number from the full processing of the preceding month (green line), a few days more than one solar rotation. The horizontal blue line shows the current monthly average. The yellow dots give the number of stations that provided valid data. Valid data are used to calculate the EISN. The triangle gives the number of stations providing data. When a triangle and a yellow dot coincide, it means that all the data is used to calculate the EISN of that day.
Review of ionospheric activity (30 Jan 2023 - 5 Feb 2023)
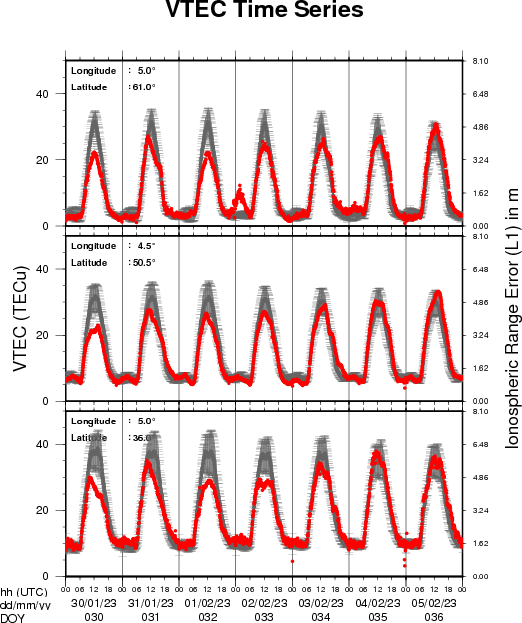
The figure shows the time evolution of the Vertical Total Electron Content (VTEC) (in red) during the last week at three locations:
a) in the northern part of Europe(N 61deg E 5deg)
b) above Brussels(N 50.5deg, E 4.5 deg)
c) in the southern part of Europe(N 36 deg, E 5deg)
This figure also shows (in grey) the normal ionospheric behaviour expected based on the median VTEC from the 15 previous days.
The VTEC is expressed in TECu (with TECu=10^16 electrons per square meter) and is directly related to the signal propagation delay due to the ionosphere (in figure: delay on GPS L1 frequency).
The Sun's radiation ionizes the Earth's upper atmosphere, the ionosphere, located from about 60km to 1000km above the Earth's surface.The ionization process in the ionosphere produces ions and free electrons. These electrons perturb the propagation of the GNSS (Global Navigation Satellite System) signals by inducing a so-called ionospheric delay.
See http://stce.be/newsletter/GNSS_final.pdf for some more explanations ; for detailed information, see http://gnss.be/ionosphere_tutorial.php
Geomagnetic Observations in Belgium (30 Jan 2023 - 5 Feb 2023)

Local K-type magnetic activity index for Belgium based on data from Dourbes (DOU) and Manhay (MAB). Comparing the data from both measurement stations allows to reliably remove outliers from the magnetic data. At the same time the operational service availability is improved: whenever data from one observatory is not available, the single-station index obtained from the other can be used as a fallback system.
Both the two-station index and the single station indices are available here: http://ionosphere.meteo.be/geomagnetism/K_BEL/
PROBA2 Observations (30 Jan 2023 - 5 Feb 2023)
Solar Activity
Solar flare activity was low during the week.
In order to view the activity of this week in more detail, we suggest to go to the following website from which all the daily (normal and difference) movies can be accessed: https://proba2.oma.be/ssa
This page also lists the recorded flaring events.
A weekly overview movie (SWAP week 671) can be found here: https://proba2.sidc.be/swap/data/mpg/movies/weekly_movies/weekly_movie_2023_01_30.mp4.
Details about some of this week's events can be found further below.
If any of the linked movies are unavailable they can be found in the P2SC movie repository here: https://proba2.oma.be/swap/data/mpg/movies/.
Wednesday February 01
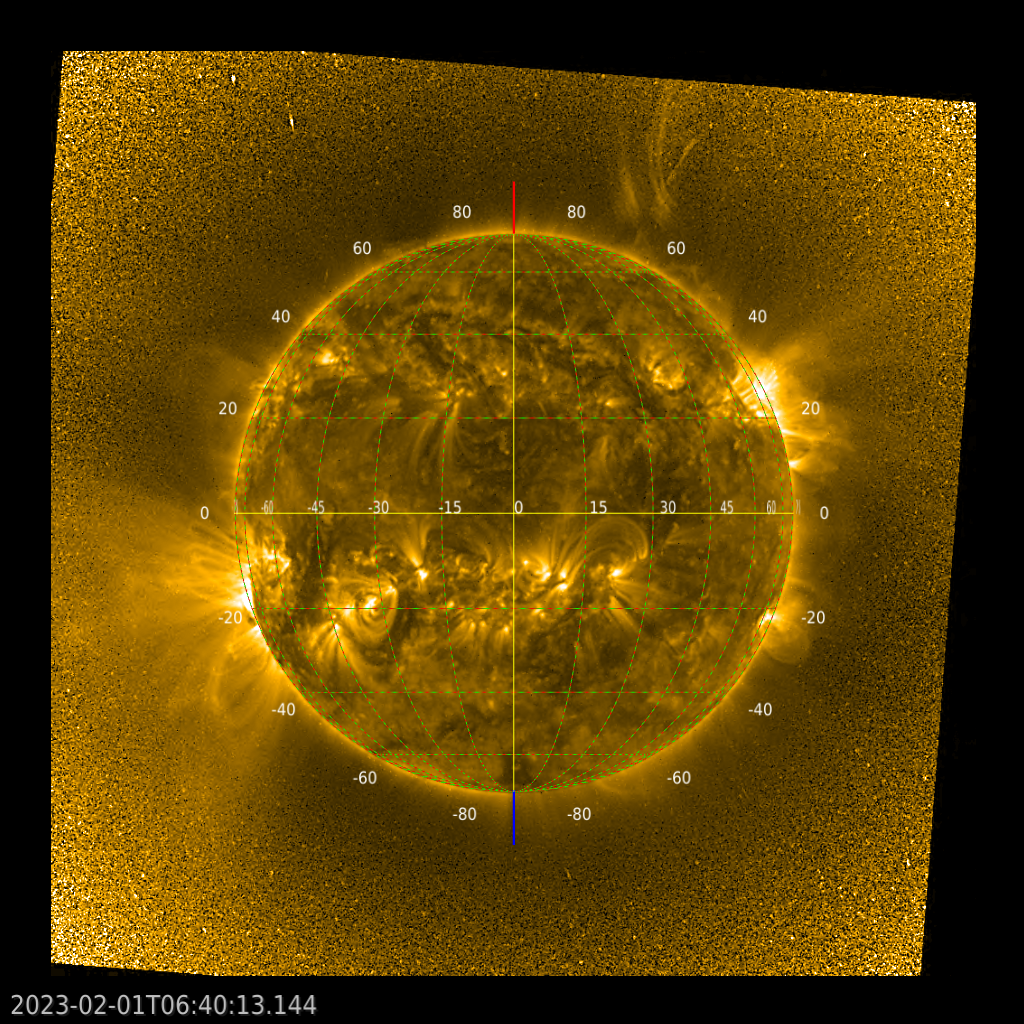
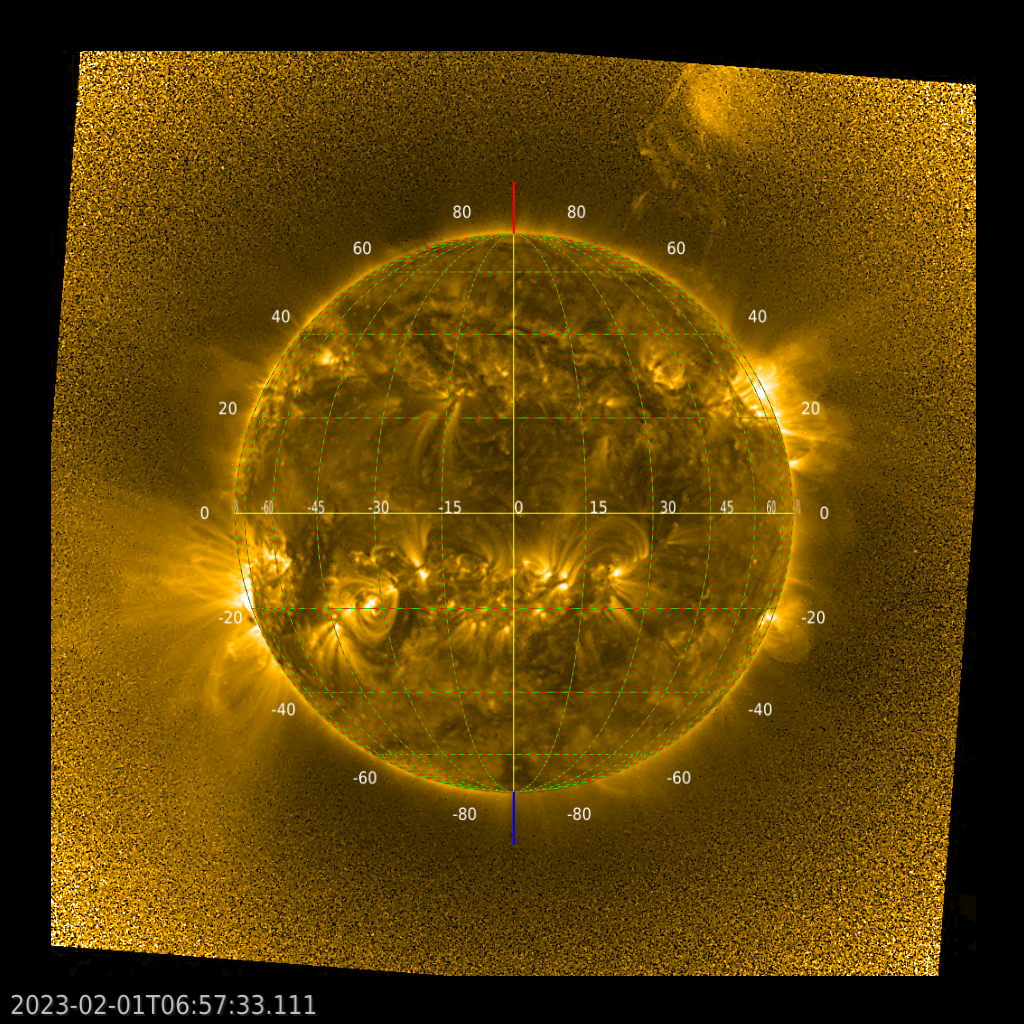
No major flares were recorded this week, so the solar activity was dominated by filament/prominence eruptions. The SWAP images above show observations during one of the largest filament eruptions of this week, occurring on the 1st of February 2023. It can be seen quite high in the corona at the north-western limb of the Sun, and it probably originated from the back-side of the Sun.
Find a SWAP movie of the event here: https://proba2.sidc.be/swap/movies/20230201_swap_movie.mp4.