- Table of Content
- 1.Mercury, a lit...
- 2.More on the X2...
- 3.Noticeable Sol...
- 4.PROBA2 Observa...
- 5.The Internatio...
- 6.Geomagnetic Ob...
- 7.Review of sola...
- 8.Review of geom...
- 9.The SIDC Space...
- 10.Activities
2. More on the X2 flare
3. Noticeable Solar Events (13 Feb 2023 - 19 Feb 2023)
4. PROBA2 Observations
5. The International Sunspot Index by SILSO
6. Geomagnetic Observations in Belgium
7. Review of solar activity (13 Feb 2023 - 19 Feb 2023)
8. Review of geomagnetic activity
9. The SIDC Space Weather Briefing
10. Activities
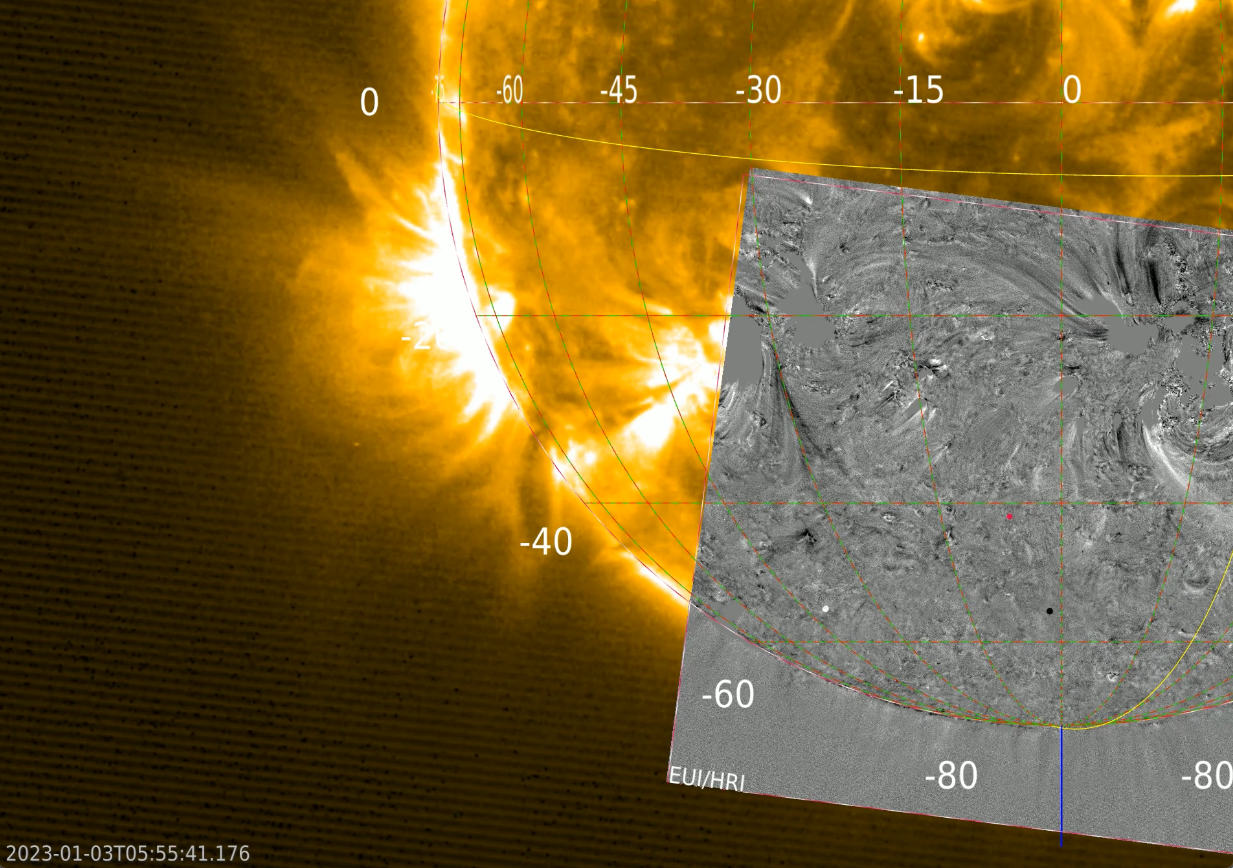
Mercury, a little black dot on the Sun
The telescope EUI onboard the satellite Solar Orbiter could capture Mercury while it transited the Sun on January 3. Mercury, the planet closest to the Sun, is the little black dot that moves from left to right. Amazing to see how small the planet is compared to the size of the Sun, you hardly see it. To help guide our eye, we use the gray images that are obtained by subtracting two images. The differences between both images appear as black and white, the rest is grey.
JHelioviewer movie 1: https://www.stce.be/movies/JHV_2023-01-09_12.15.24.mp4
JHelioviewer movie 2: https://www.stce.be/movies/JHV_2023-01-09_12.08.29.mp4
JHelioviewer is our public software to surf through the solar corona: https://www.jhelioviewer.org
Is what you see in the picture real?
Scientists can also use the transit to learn how the solar light behaves when it falls into the pixels of the telescope detector. They know that Mercury should appear completely black in the solar image. If it is not, it means that light falling into a pixel influences the neighboring pixels as well. If you understand how that happens, you can remove this unwanted signal. The result is an image that is closer to reality.
Advanced photo editing in science
Stefan Hofmeister from the Leibniz Institute for Astrophysics in Potsdam is currently visiting the EUI team. He works on augmenting reality in solar images and pixels: ‘You always have to be careful when you interpret solar images. We make solar images more trustworthy by applying a method called Point Spread Function Correction, which we have developed ourselves. To say it in a more understandable way: a science-approved photo-editing method.’ Stefan presented his PixelbyPixel approach during a well attended seminar.
More on the ESA website: https://www.esa.int/Science_Exploration/Space_Science/Solar_Orbiter/Mercury_s_black_disc_helps_sharpen_Solar_Orbiter_s_view
More on the X2 flare
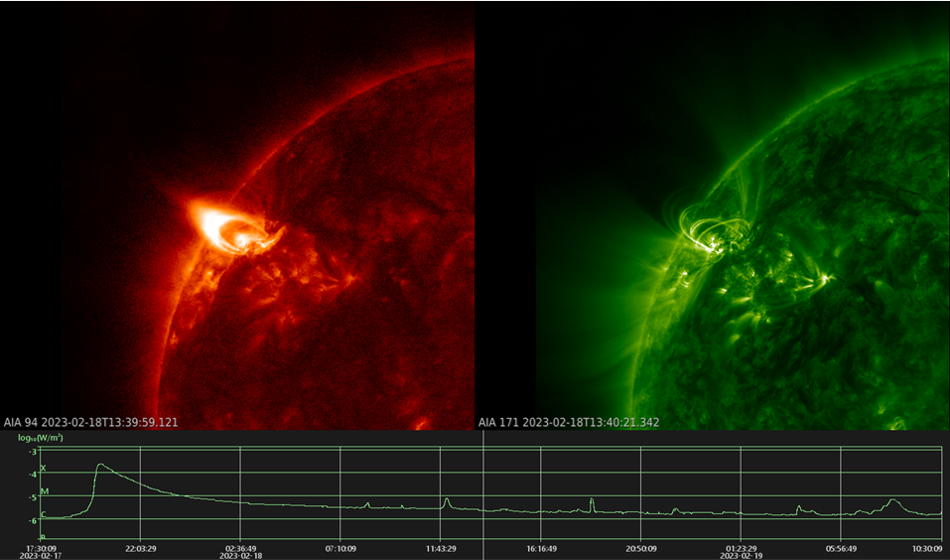
The X2 flare from 17 February has already been discussed in the news flash here (https://www.stce.be/news/629/welcome.html ). The associated coronal mass ejection (CME) arrived as expected by the SIDC forecasters (https://www.sidc.be/index.php ) early on 20 February. As it was only a glancing blow, geomagnetic activity remained limited to unsettled (K_BEL ; http://ionosphere.meteo.be/geomagnetism/K_BEL/ ) and active (Kp ; https://www.swpc.noaa.gov/products/planetary-k-index ) levels. It took a day and a half for the solar soft x-ray (SXR) emission to return to background levels (GOES), highlighted in the SDO (https://sdo.gsfc.nasa.gov/data/aiahmi/ ) extreme ultraviolet imagery (EUV) underneath showing side-by-side clips of the event at temperatures of multi-million degrees (SDO/AIA 094 ; left) and around 700.000 degrees (SDO/AIA 171 ; right). The clip covers the period of 17 February at 17:30 UTC until 20 February at 10:30 UTC (so 41 hours!), and was created with Space Weather JHelioViewer (swhv.oma.be/user_manual/ ). This tool also allows the integration of timelines such as, in this case, the GOES SXR data (https://www.swpc.noaa.gov/products/goes-x-ray-flux ). The clips are available in the online version of this newsitem at https://www.stce.be/news/630/welcome.html
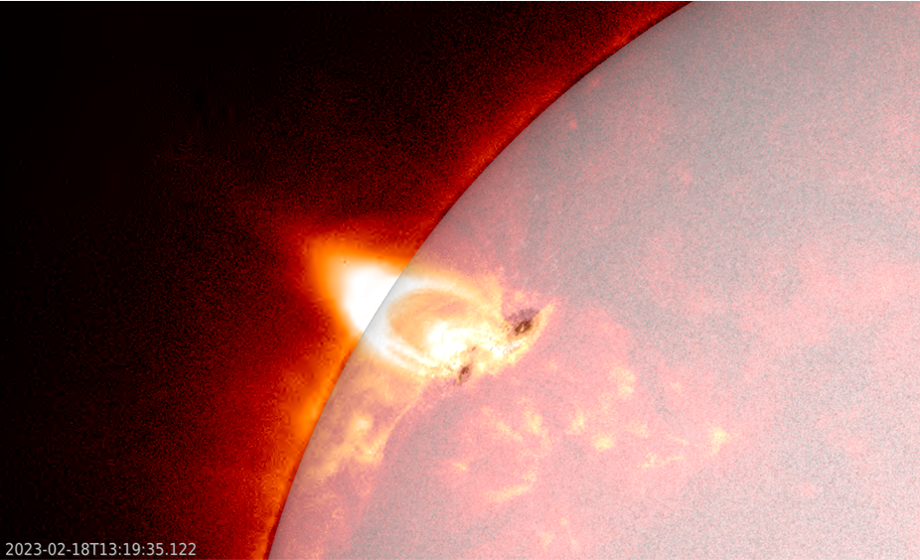
In another clip, the AIA 094 images have been overlaid onto a white light image of the Sun (grey ; SDO/HMI) thus showing the position and evolution of the flare and its footpoints relative to the sunspots in active region 13229.
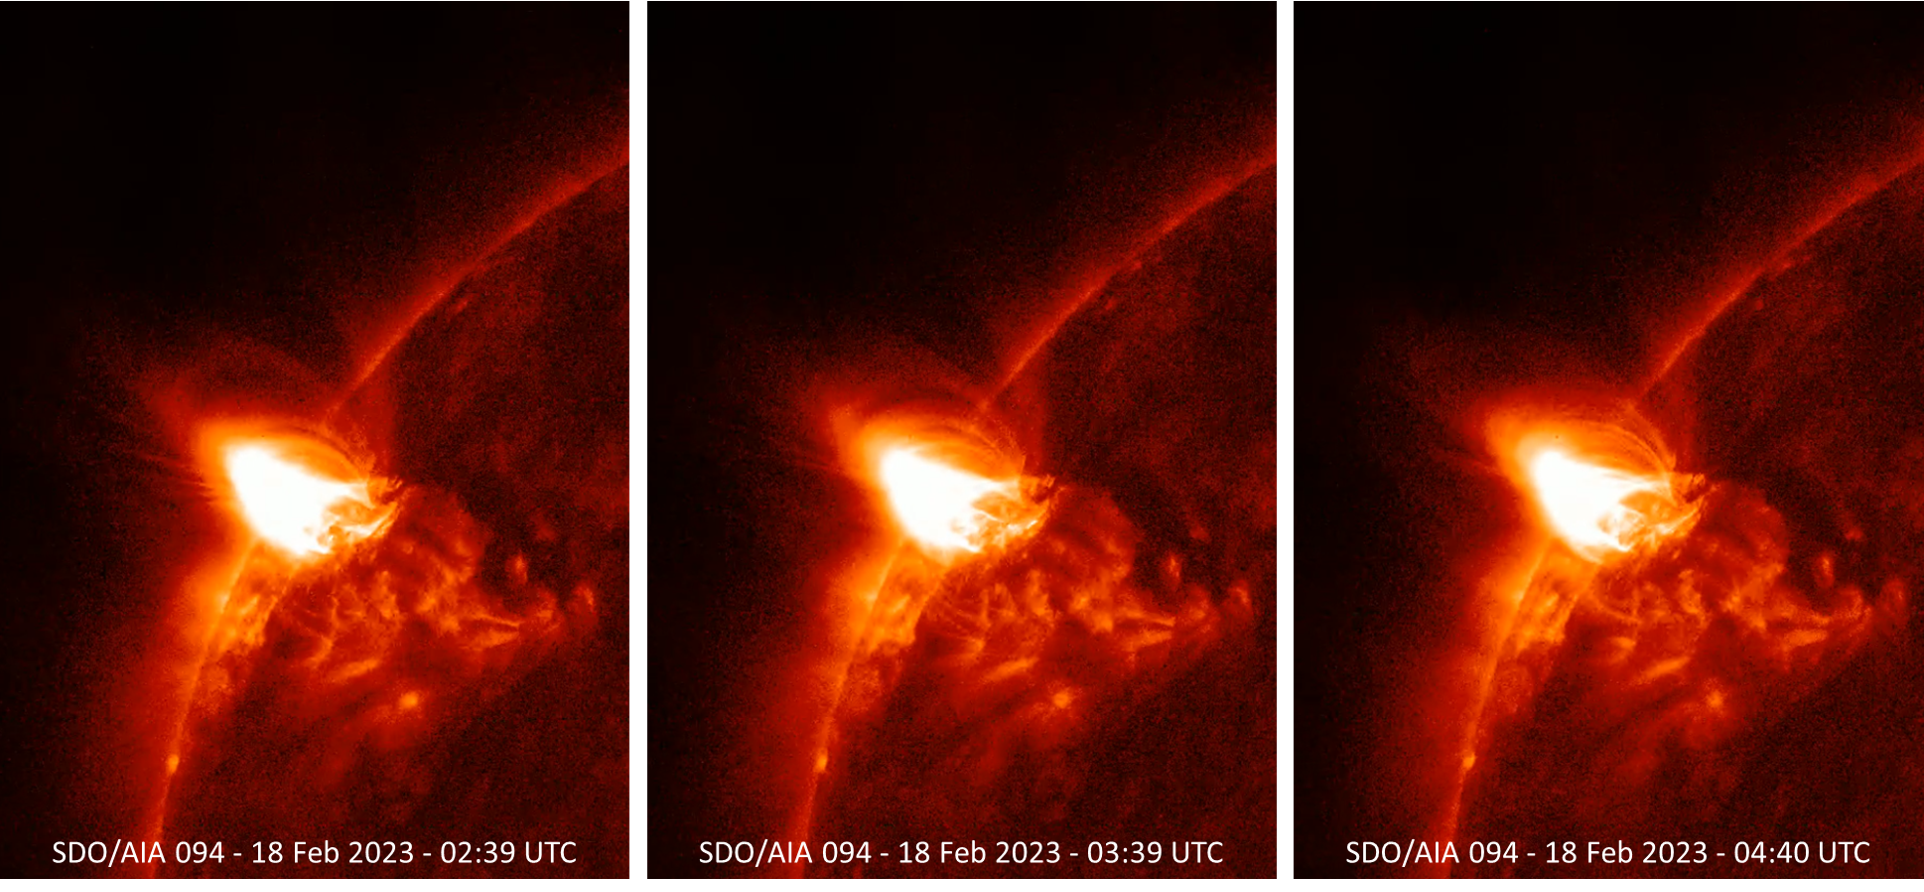
Noteworthy in all of the AIA 094 clips (EUV) was the cusp ("flame-like") structure that can be seen over the blast site. Cusps were first discovered by the Yohkoh satellite (http://solar.physics.montana.edu/sxt/ ) in soft x-ray images during the 1990s (e.g. Shibata 1998 - https://link.springer.com/article/10.1023/A:1002413214356 ), thus confirming and finetuning the standard solar flare model. A cusp is a very hot structure usually only visible in soft x-rays or energetic EUV passbands such as AIA 094 (9.4 nm), and not in higher passband filters such as AIA 193 (19.3 nm) or AIA 171 (17.1 nm). It indicates that magnetic reconnection took place and that the eruption was associated with a CME. Also visible in the EUV clips are a series of contracting coronal loops (Hudson 2000 - https://ui.adsabs.harvard.edu/abs/2000ApJ...531L..75H/abstract ). It is believed they are associated with another impressive feature sometimes observed during strong solar flares, the supra-arcade downflows (also known as "SADs" or "tadpoles", see e.g. the STCE newsitems here https://www.stce.be/news/562/welcome.html and here https://www.stce.be/news/331/welcome.html ). Those SADs are not visible in the above clips as we are looking "sideways" at the eruption, whereas in order to see the SADs a perpendicular viewpoint is required. One of the explanations of SADs and contracting coronal loops is that SADs are actually wakes (i.e., trailing regions of low density) created by the retraction of much thinner magnetic tubes through the supra-arcade plasma (e.g. Savage et al. 2012 ; https://iopscience.iop.org/article/10.1088/2041-8205/747/2/L40 ). A sketch and clip are in the online version. The figure underneath shows a slow-moving contracting coronal loop, the clip contains many more and faster moving examples. There's still much work to be done in this field of solar physics, but events like this one certainly help to get to the heart of the matter.
Noticeable Solar Events (13 Feb 2023 - 19 Feb 2023)
| DAY | BEGIN | MAX | END | LOC | XRAY | OP | 10CM | TYPE | Cat | NOAA |
| 13 | 0504 | 0518 | 0537 | M1.0 | 3226 | |||||
| 13 | 1549 | 1556 | 1603 | N10E41 | M1.4 | SF | III/1 | 3226 | ||
| 14 | 0157 | 0203 | 0207 | N10E39 | M1.8 | 1N | 84 | 3226 | ||
| 14 | 1159 | 1212 | 1246 | M2.6 | 3213 | |||||
| 15 | 0433 | 0447 | 0507 | M1.1 | 3213 | |||||
| 15 | 0516 | 0523 | 0530 | M2.0 | 3213 | |||||
| 15 | 0642 | 0705 | 0719 | M1.3 | 3213 | |||||
| 15 | 2105 | 2114 | 2118 | M1.0 | III/2 | 3213 | ||||
| 16 | 0019 | 0032 | 0043 | M1.1 | VI/1 | 3229 | ||||
| 17 | 1938 | 2016 | 2050 | X2.2 | B | 550 | I/2II/2I/3 2 | 89 | 3229 |
| LOC: approximate heliographic location | TYPE: radio burst type |
| XRAY: X-ray flare class | Cat: Catania sunspot group number |
| OP: optical flare class | NOAA: NOAA active region number |
| 10CM: peak 10 cm radio flux |
PROBA2 Observations
Solar Activity
Solar flare activity fluctuated from low to high during the week.
In order to view the activity of this week in more detail, we suggest to go to the following website from which all the daily (normal and difference) movies can be accessed: https://proba2.oma.be/ssa
This page also lists the recorded flaring events.
A weekly overview movie (SWAP week 673) can be found here: https://proba2.sidc.be/swap/data/mpg/movies/weekly_movies/weekly_movie_2023_02_13.mp4.
Details about some of this week's events can be found further below.
If any of the linked movies are unavailable they can be found in the P2SC movie repository here: https://proba2.oma.be/swap/data/mpg/movies/.
Friday February 17
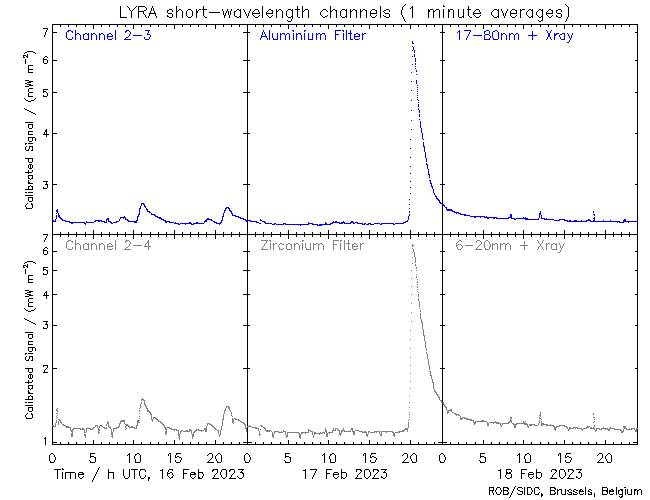
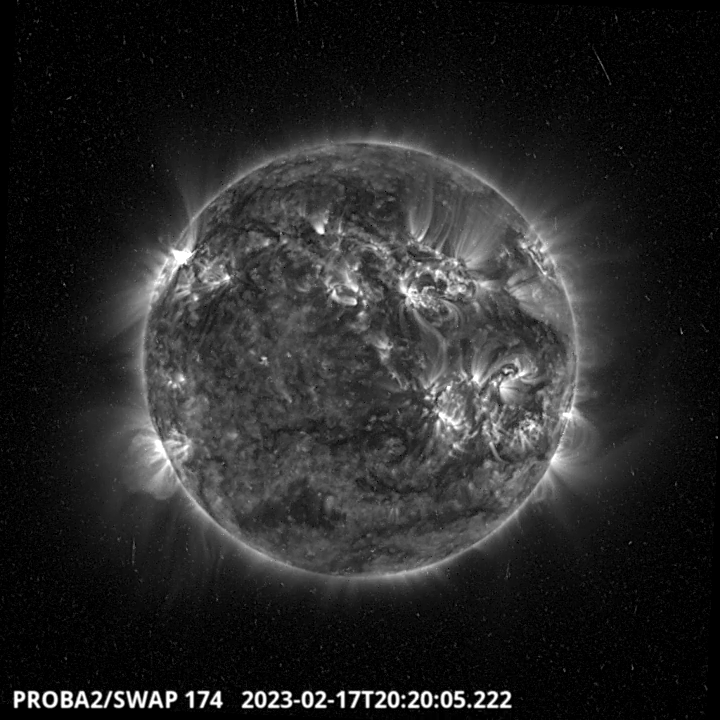
The largest flare of the week, an X2.2 flare, was observed by LYRA (top panel) and SWAP (bottom panel). The flare occurred on 2023-Feb-17 (peak at 20:16 UT) on the north-eastern hemisphere close to the limb, and it was associated with NOAA AR3229.
Find a SWAP movie of the event here: https://proba2.sidc.be/swap/movies/20230217_swap_movie.mp4.
The International Sunspot Index by SILSO
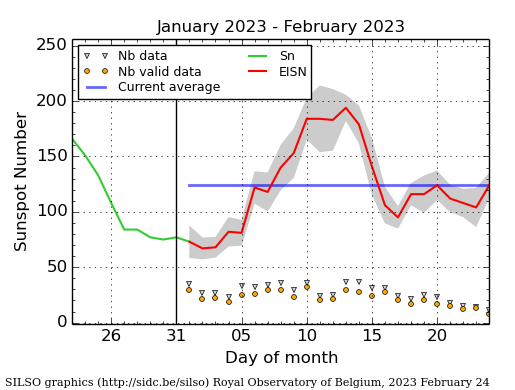
The daily Estimated International Sunspot Number (EISN, red curve with shaded error) derived by a simplified method from real-time data from the worldwide SILSO network. It extends the official Sunspot Number from the full processing of the preceding month (green line), a few days more than one solar rotation. The horizontal blue line shows the current monthly average. The yellow dots give the number of stations that provided valid data. Valid data are used to calculate the EISN. The triangle gives the number of stations providing data. When a triangle and a yellow dot coincide, it means that all the data is used to calculate the EISN of that day.
Geomagnetic Observations in Belgium
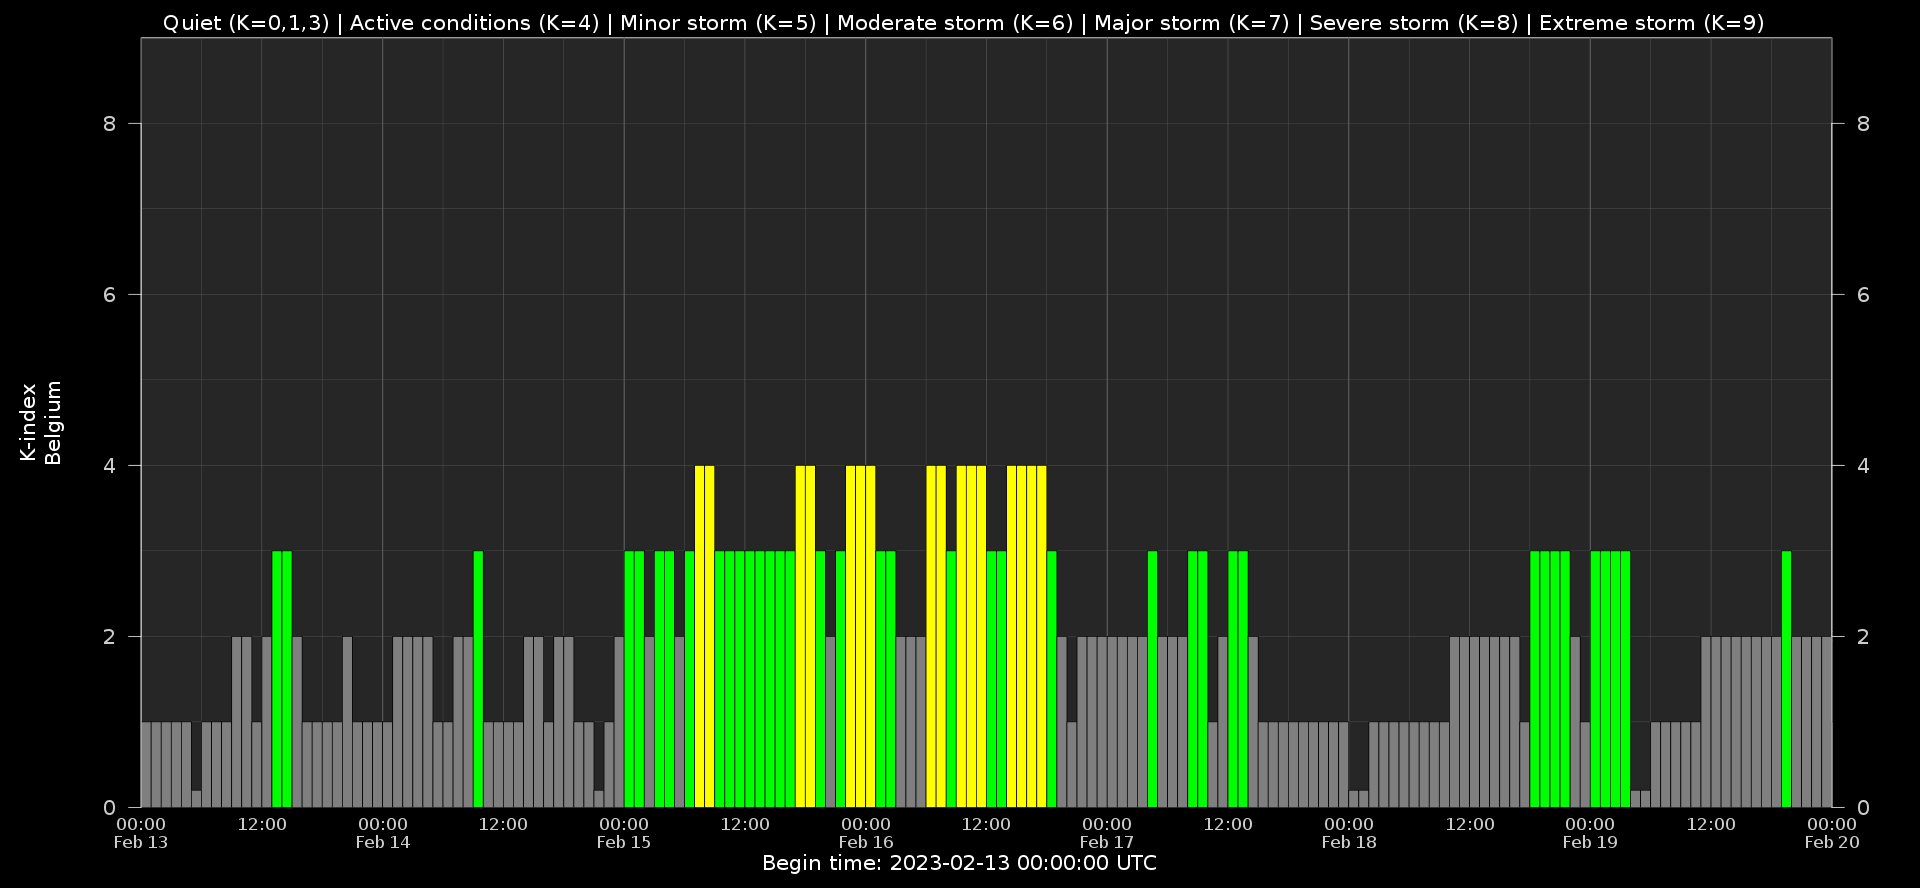
Local K-type magnetic activity index for Belgium based on data from Dourbes (DOU) and Manhay (MAB). Comparing the data from both measurement stations allows to reliably remove outliers from the magnetic data. At the same time the operational service availability is improved: whenever data from one observatory is not available, the single-station index obtained from the other can be used as a fallback system.
Both the two-station index and the single station indices are available here: http://ionosphere.meteo.be/geomagnetism/K_BEL/
Review of solar activity (13 Feb 2023 - 19 Feb 2023)
Solar flares
Solar flaring activity ranged between low and high levels. There was a total of 16 active regions observed on the visible side of the solar disk. At the start of the week, until February 15, solar flaring activity was at moderate levels; NOAA AR 3213, NOAA AR 3217 and NOAA AR 3226 were the sources of the majority of the flaring activity. On February 17 solar flaring activity reached high levels. The largest flare recorded was a X2.2 flare, with peak time 20:16 UTC on February 17, associated with NOAA AR 3229 in the north east of the solar disk. This event was associated with a Type II radio burst and an EUV wave. On February 18 and 19, the flaring activity returned to low levels.
Solar wind disturbances: coronal mass ejections
There were multiple Coronal Mass Ejections observed over the week, three of which were determined to have a possible Earth directed component.
The first was a partial halo coronal mass ejection (CME) that was observed in SOHO/LASCO-C2 data from February 15 at 02:00 UTC, directed to the south east. This CME was associated with a filament eruption following the C5.7 flare from NOAA 3220.
The second was a CME to the north west visible from 10:48 UTC on February 16 in SOHO/LASCO-C2 data, which was related to the long duration C9 flare. Glancing blows were predicted to arrive at Earth for these CMEs on February 17 and 18, respectively. However, these were not observed in the in-situ solar wind data.
The third CME was an asymmetric halo CME associated with the X2.2 flare and was observed by STEREO-A/COR2 from 20:38 UTC and in SOHO/LASCO-C2 data from 20:12 UTC. The CME was directed to the north-east and the bulk of the CME was not expected to be Earth directed. However, a glancing blow of the shock was predicted to impact Earth early on February 20.
Energetic particles near Earth
The greater than 10 MeV proton flux was at background levels. The greater than 2 MeV electron flux was above the 1000 pfu threshold between February 12 and 14, before returning to nominal levels. The 24h electron fluence was at moderate levels on February 13 and 14, before reducing to nominal levels for the rest of the week.
Review of geomagnetic activity
Solar wind near Earth
At the start of the week, on February 13 and 14 the solar wind conditions were indicative of the waning influence of a high-speed stream. At 22:00 UTC on February 14, the solar wind speed increased from 316 Km/s to over 340 km/s and the total interplanetary magnetic field increased sharply from 4 to 7nT, indicating a possible ICME arrival. The solar wind speed and magnetic field continued to gradually increase, due to the likely combination of the ICME and a high-speed stream associated with one or both of the two small positive polarity coronal holes that crossed the central meridian on February 12 and 13. The solar wind speed reached values of up to 550 km/s on February 17. Towards the end of the week, the solar wind speed gradually declined to values near 350 km/s. The magnitude of the interplanetary magnetic field (IMF) had maximum value of 23 nT, and the Bz component of the IMF had minimum value of -19 nT on February 16.
Geomagnetic impact
The geomagnetic conditions were at quiet to unsettled levels at the start of the week, increasing to active to minor storm levels on February 15 and February 16 (local K Bel 4 and NOAA Kp 5) due to the ICME and high speed stream influences. Conditions then returned to quiet to unsettled levels for the rest of the week.
The SIDC Space Weather Briefing
The Space Weather Briefing presented by the forecaster on duty from to . It reflects in images and graphs what is written in the Solar and Geomagnetic Activity report: https://www.stce.be/briefings/20230220_SWbriefing.pdf
If you need to access the movies, contact us: stce_coordination at stce.be
Activities
Check out our activity calendar: activities and encounters with the Sun-Space-Earth system and Space Weather as the main theme. We provide occasions to get submerged in our world through educational, informative and instructive activities.
If you want your event in our calendar, contact us: stce_coordination at stce.be
* March 2, ROB seminar: New insights in the F10.7cm index and its relation with the sunspot number, Meridian room@@spacepole and zoom, Brussels, Belgium
* March 14, PITHIA-NRF High Profile Meeting, Brussels, Belgium
* March 15, PITHIA-NRF Innovation Day, Brussels, Belgium
* March 16, PITHIA-NRF Training for Partners, Brussels, Belgium
* March 17, PITHIA-NRF Workshop for Optimization of Observational Strategies, Brussels, Belgium
* March 17, STCE seminar: The European Space Weather and Space Climate association (E-SWAN) and the future benefit for its community, Nicolet@spacepole and Teams, Brussels, Belgium
* March 27-29, STCE Space Weather Introductory Course, Brussels, Belgium - FULL
* April 21, BIRA-IASB seminar: High resolution modelling of atmospheric composition over Antwerp, Belgium, Nicolet@spacepole and Teams, Brussels, Belgium
* April 28, STCE seminar: Space Weather Tools in Support of Space Radiation Operations, Nicolet@spacepole and Teams, Brussels, Belgium
* May 22-24, STCE Space Weather Introductory Course, Brussels, Belgium - FULL
* May 25, STCE seminar: Comparative study of a constant-alpha force-free field and its approximations in an ideal toroid, Meridian room@spacepole and zoom, Brussels, Belgium
* May 29 - June 1, PITHIA-NRF Training School, Rome, Italy
Check: https://www.stce.be/calendar