- Table of Content
- 1.Powerful farsi...
- 2.Ionospheric fu...
- 3.The STCE in 20...
- 4.Review of sola...
- 5.Review of geom...
- 6.PROBA2 Observa...
- 7.Noticeable Sol...
- 8.International ...
- 9.Geomagnetic Ob...
- 10.The SIDC Space...
- 11.Review of iono...
- 12.Calendar
2. Ionospheric fun with PITHIA-NRF
3. The STCE in 2021
4. Review of solar activity
5. Review of geomagnetic activity
6. PROBA2 Observations (6 Mar 2023 - 12 Mar 2023)
7. Noticeable Solar Events (6 Mar 2023 - 12 Mar 2023)
8. International Sunspot Number by SILSO (6 Mar 2023 - 12 Mar 2023)
9. Geomagnetic Observations in Belgium (6 Mar 2023 - 12 Mar 2023)
10. The SIDC Space Weather Briefing
11. Review of ionospheric activity (6 Mar 2023 - 12 Mar 2023)
12. Calendar
Powerful farside eruption
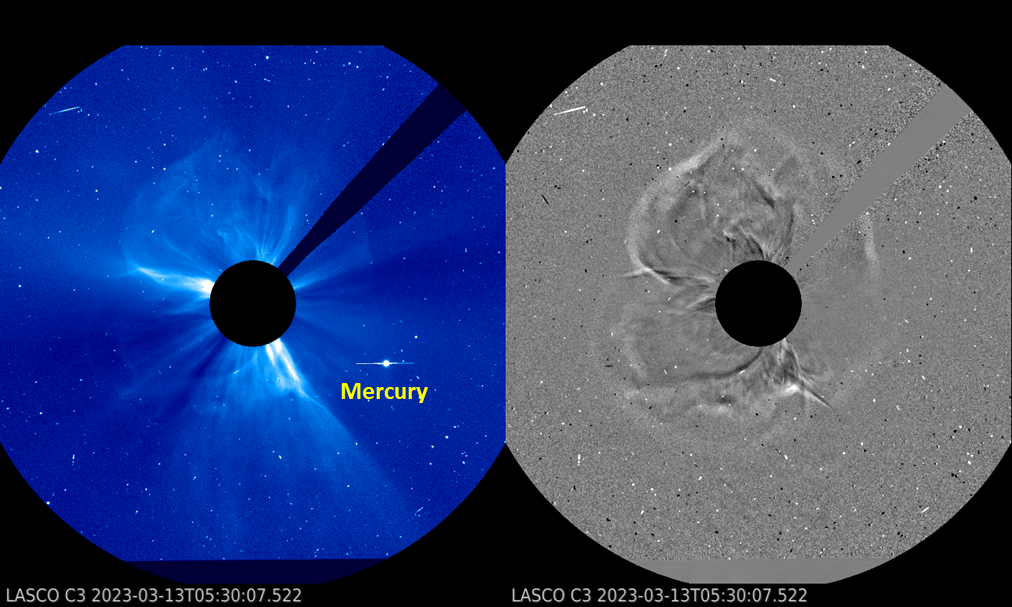
Early on 13 March, coronagraphic imagery on board STEREO-A (COR2; at 03:38 UTC) and SOHO (LASCO/C2; at 03:36 UTC) revealed the emergence of a powerful coronal mass ejection (CME) with a plane-of-the-sky speed in excess of 1700 km/s. There were no large or complex sunspot groups on the earth-facing side of the Sun, and there was no substantial activity in extreme ultraviolet (EUV). Space weather forecasters of the SIDC (https://www.sidc.be/ ) thus quickly came to the conclusion that the source of the observed CME was on the Sun's farside. The imagery underneath is from the SOHO/LASCO C3 coronagraph (https://soho.nascom.nasa.gov/ ), with on the right difference images (one image subtracted from the next) to highlight faint features of this halo CME. The bright dot near the Sun is the planet Mercury currently located on the other side of the Sun. A clip is in the online version of this newsitem at https://www.stce.be/news/635/welcome.html
The helioseismological map underneath indicates there are a number of active regions on the Sun's farside. Helioseismology is a branch of solar research that is very similar to seismology on Earth, where by studying the waves induced by earthquakes, scientists get an idea on the Earth's interior. Indeed, by carefully "listening" to the up and down movements all over the solar surface, helioseismologists get a pretty good idea on the specifics of the solar interior. Moreover, by studying the related acoustic waves that are travelling through the solar interior, they can virtually "see" any rather big, active region that may be present on the farside. Such maps are available from ground-based networks (NSO/GONG - https://farside.nso.edu/) and space-based observations (JSOC/SDO/HMI - http://jsoc.stanford.edu/data/timed/). The synchronic map underneath shows the full Sun (between latitudes -60° and +60°) stitching together HMI magnetograms (grayish; earth-facing solar hemisphere) and helioseismic observations (orangish; farside) as available at JSOC/SDO/HMI. Concentrations of magnetic fields (active regions) can be seen in the magnetograms as blue-greenish and red-yellowish patches, whereas in the helioseismic maps these concentrations are represented by dark patches.
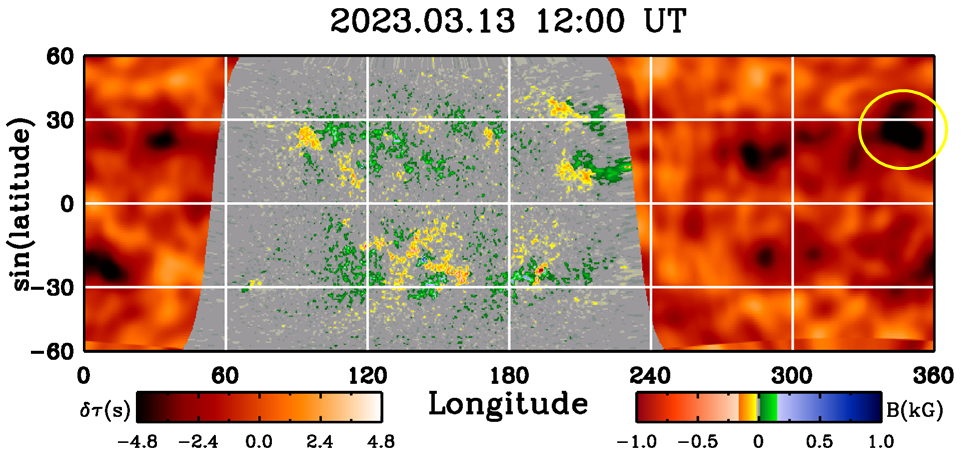
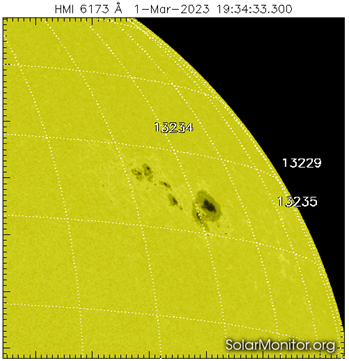
Analysis of the speeds of the expanding CME pinpointed a dark patch almost diametrically opposed to the Earth as the most likely source of the eruption (indicated by the yellow ellipse in the synchronic map above). The location of this active region corresponds loosely to NOAA 13234, which produced an X-class flare on 3 March just before rounding the Sun's west limb (see this STCE newsitem at https://www.stce.be/news/632/welcome.html ). The SDO/HMI (http://sdo.gsfc.nasa.gov/data/aiahmi/ ) image underneath shows this sunspot group as it was on 1 March. It seems NOAA 13234 is still quite active, and may be worth watching when it will rotate over the Sun's east limb within 4 to 5 days.
Despite this eruption being at the worst possible location for producing a proton event detectable at Earth, GOES (https://www.swpc.noaa.gov/products/goes-proton-flux ) exactly observed that. The increase in the greater than 10 MeV proton flux started about an hour after the first observation of the CME and reached a maximum of 11.6 pfu at 09:10 UTC, as shown in the graph underneath. Proton events usually originate from an erupting source on the western solar hemisphere as seen from Earth, because the Sun's magnetic field lines are much better connected from there to the Earth environment (Parker's spiral). However, it is well known that proton events and enhancements can originate from the Sun's farside too. Typical examples are the 23 July 2012 event (https://www.stce.be/news/152/welcome.html ) and the 1 September 2014 (https://www.stce.be/news/266/welcome.html ) proton flux enhancement. The exact mechanism behind this is not entirely understood yet, but research has shown this might have to do with how well the expanding CME (shock) eventually can tap into magnetic field lines connected to Earth (see e.g. Prise et al. 2014 https://link.springer.com/article/10.1007/s11207-013-0435-0 ; Kouloumvakos et al. 2023 https://doi.org/10.1051/0004-6361/202244363 ).
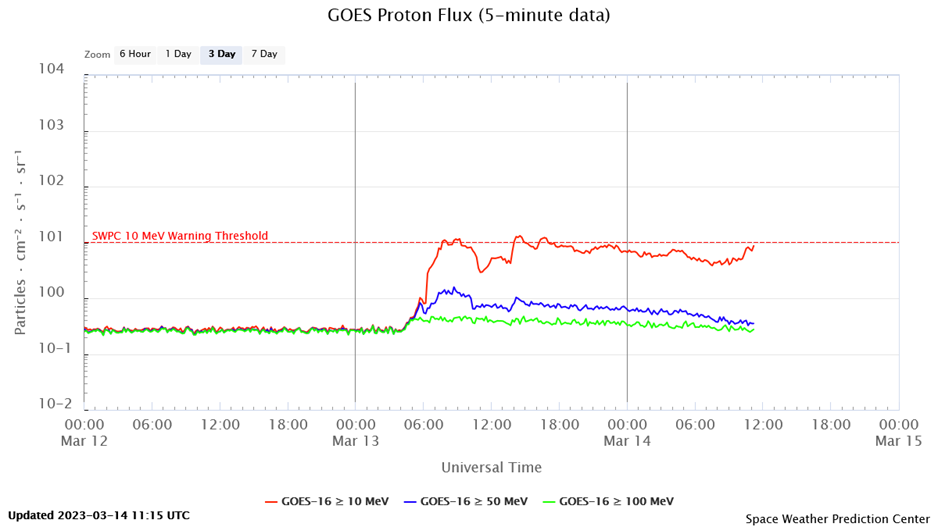
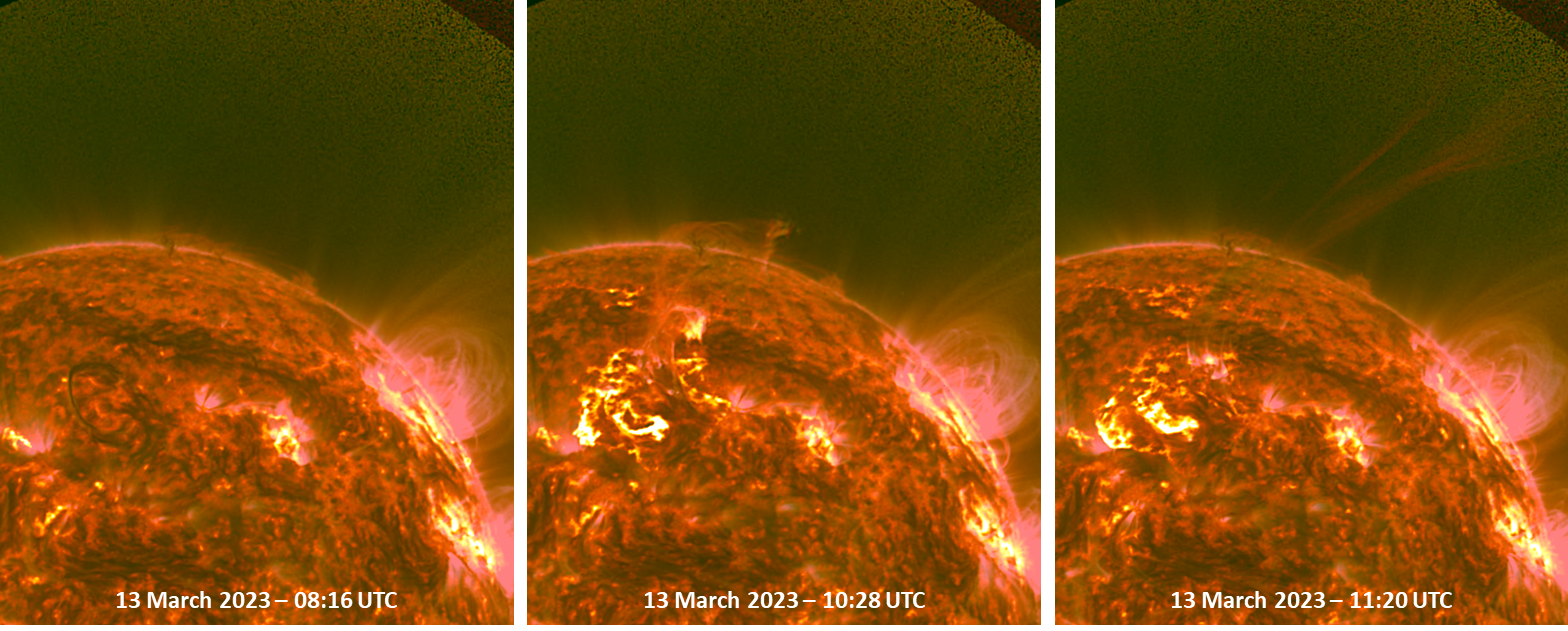
The evolution of the greater than 10 MeV proton flux is somewhat atypical, with after the first maximum at 09:10 UTC, a dip around 11:00 UTC before increasing again to a second maximum of 13.2 pfu at 14:35 UTC. This may suggest, amongst other possibilities, the contribution from another source such as from the violent horseshoe-shaped filament eruption near the Sun's central meridian starting around 09:45 UTC and associated with a long duration C3 flare, all on the same day. Further analysis is required to straighten out the exact cause and chain of events. The GOES/SUVI (https://www.swpc.noaa.gov/products/goes-solar-ultraviolet-imager-suvi ) images underneath show the filament eruption at temperatures around 80.000 degrees (SUVI 304; red) and around 700.000 degrees (SUVI 171; greenish). This eruption was associated with a CME that had a plane-of-the-sky speed around 750 km/s (CACTus ; https://www.sidc.be/cactus/ ). Though the CME seems to be mostly moving in the northwest direction, there's a possibility that it delivers a glancing blow to the Earth environment late on 15 or early on 16 March.
Ionospheric fun with PITHIA-NRF
At the Innovation Day of the PITHIA-NRF project, more than 80 enthousiasts (online and onsite) met at the planetarium in Brussels, Belgium. It was an instructive meeting, but above all, it opened the door to more and better products and data defining the ionosphere, the thermosphere and plasmasphere and to meet people involved in HF communication and GNSS.
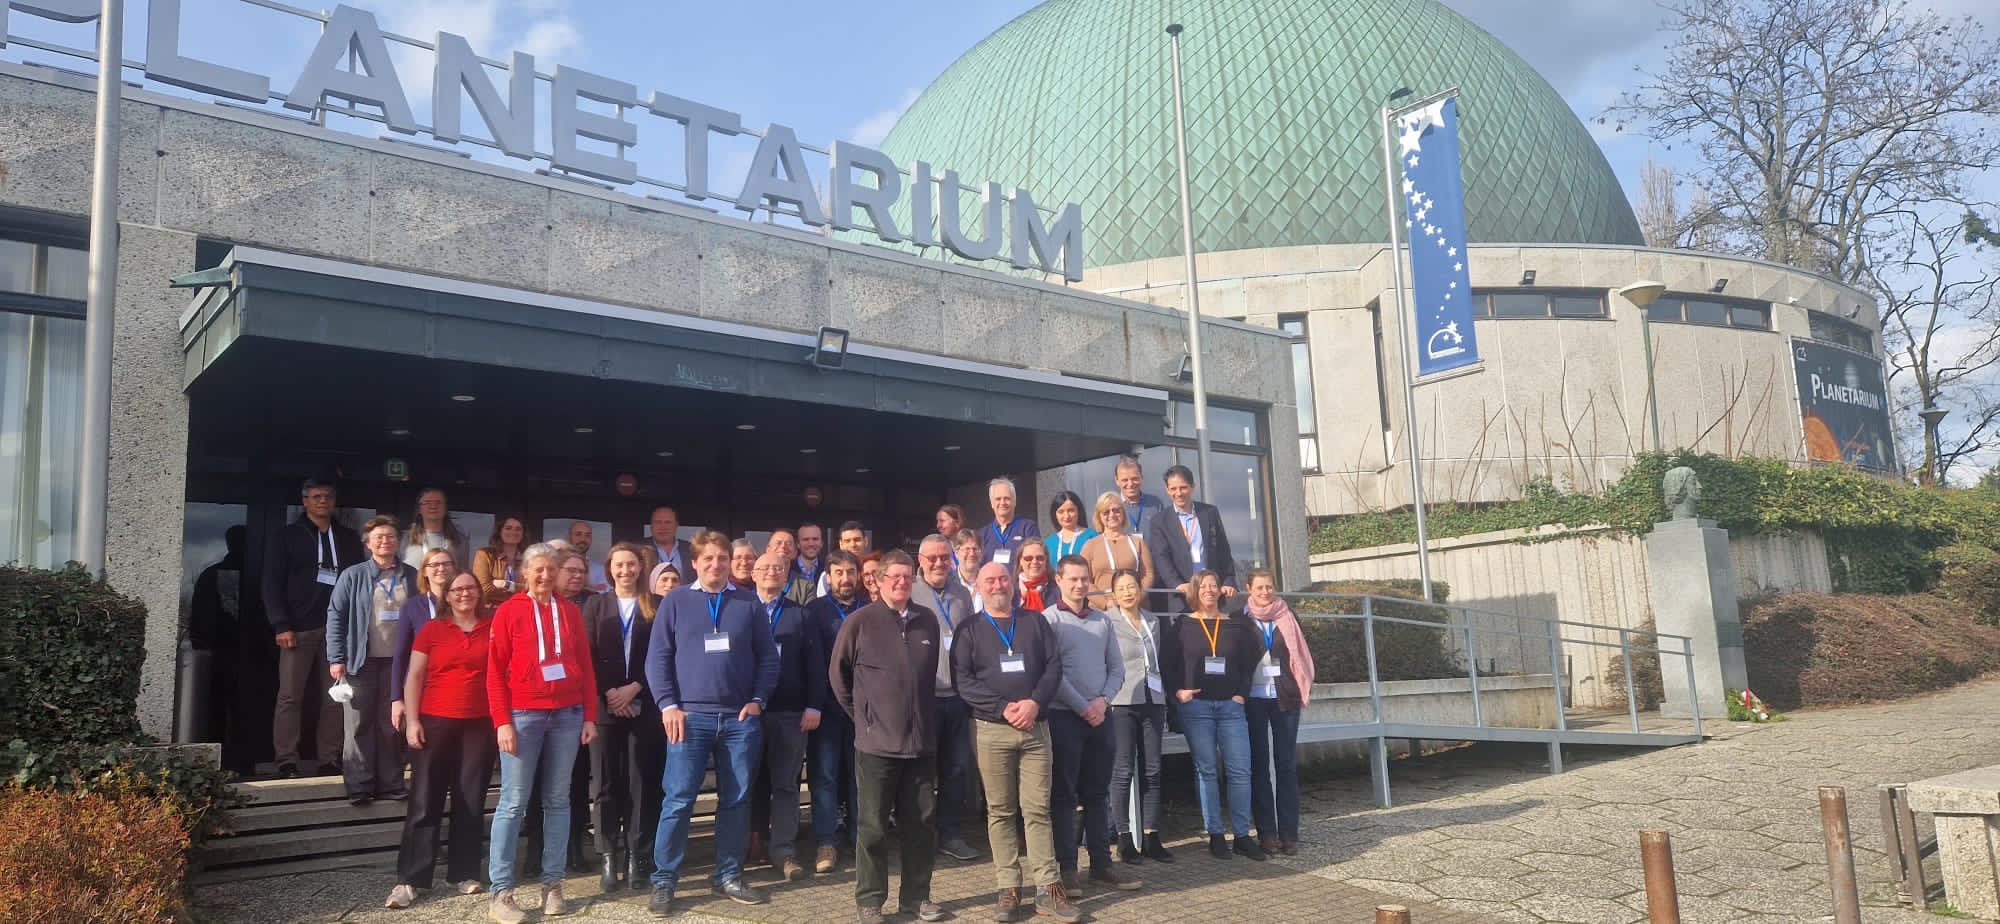
PITHIA-NRF website: https://pithia-nrf.eu
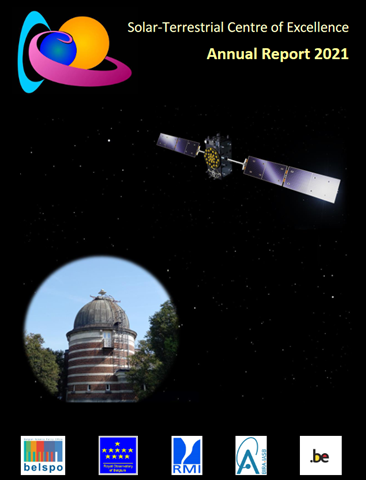
The STCE in 2021
The STCE Annual Report 2021 is now available at https://www.stce.be/annualReport
It is a compilation of the activities done in 2021 within the frame of the Solar-Terrestrial Centre of Excellence (STCE). This report continues the style from the previous editions. Hence, as it is targeting a more general public, it presents only a selection of the 2021-activities in easy-to-digest summaries.
These bite-sized articles emphasize the intense collaboration between the institutes at the Space Pole, as well as with our external partners. Aside the usual topics such as the space weather highlights, public outreach, and listings with conference talks and science papers, it covers also contributions on e.g. the plasmasphere, the discovery of "campfires" on the Sun, B.RCLab, best practices with ozonesondes, the Solar Virtual Observatory, the calibration of pyrheliometers, the new K_BEL geomagnetic index,... and much more.
We wish you an enjoyable reading experience!
Review of solar activity
Solar X-ray flux: flares
Solar flaring activity was moderate at the start of the week and gradually declined to low level. NOAA Active Region (AR) 3243 (magnetic type Beta), produced the brightest flare, an M5, at 6 Mar, while NOAA AR 3242 (magnetic type Beta, Catania group 5) produced two M1 flares on 6 Mar and 8 Mar. Single M1 flares were produced by the NOAA AR 3234 (magnetic type beta-gamma-delta) and 3245 (magnetic class Beta-Gamma, Catania group 10) at 6 Mar. Only C-class flaring activity has been recorded since 9 Mar as the most energetic AR either lost magnetic complexity or rotated behind the solar limb.
Solar wind disturbances: coronal mass ejections
Multiple Coronal Mass Ejections (CME) were observed, but only two were judged as Earth-directed. Both of them were launched from the west side of the disk at 6 Mar 03:00 UT and 10:36 UT and were detected by Cactus as partial halo's. In both cases it was predicted that the bulk of the CME would not reach Earth and only a glancing blow might be felt at 8 or 9 Mar. Even more, it was estimated that the two effects might merge to a single blow as the two CME were launched approximately at the same time, with approximately the same speed, in the same direction. Indeed, on 9 Mar a weak disturbance was seen in the solar wind. It lasted approximately 24 hours.
Solar wind disturbances: coronal hole
A small equatorial coronal hole of positive polarity crossed the solar meridian in 11 Mar.
Energetic particles near Earth
The greater than 10 MeV proton flux was at background levels. The greater than 2 MeV electron flux was above and around the 1000 pfu threshold until 8 Mar, then dropped below the alert limit for most of the 9 Mar, and since 10 Mar remained below the threshold. The 24-hour electron fluence was moderate until the 10 Mar and low since then.
Review of geomagnetic activity
Solar wind at L1
At the start of the week the Solar Wind (SW) was dominated by a High-Speed Stream (HSS). However its effects disappeared rapidly on 7 Mar and the SW parameters became typical for a slow solar wind for the rest of the week. For the fast wind, the speed ranged between 490 km/s and 670 km/s, while from 8 Mar onwards, the speed gradually decreased from 490 km/s to 350 km/s. The total interplanetary magnetic field was between 1 nT and 9 nT and its North-South component (Bz) fluctuated between -8 nT and 8 nT. The interplanetary magnetic field was directed towards the Sun throughout the week.
Geomagnetic conditions
The global geomagnetic field reached active conditions (NOAA Kp 4) during short time intervals on 6, 9, 10 Mar and moderate conditions (NOAA Kp) on 7, 8 Mar. This was due to the HSS that affected the SW up to 7 Mar and the glancing blow of the 9 Mar. The rest of the week the global geomagnetic field was not disturbed, i.e. quiet conditions (NOAA Kp up to 2.7). The local situation in Belgium was similar with active conditions (K Dourbes 4) during short time intervals on 6, 7, 9, 12 Mar, and moderate conditions on 8 and 10 Mar, (K Dourbes up to 3) and quiet conditions (K Dourbes up to 2) on 11 Mar.
PROBA2 Observations (6 Mar 2023 - 12 Mar 2023)
Solar Activity
Solar flare activity fluctuated from low to moderate during the week.
In order to view the activity of this week in more detail, we suggest to go to the following website from which all the daily (normal and difference) movies can be accessed: https://proba2.oma.be/ssa
This page also lists the recorded flaring events.
A weekly overview movie (SWAP week 676) can be found here: https://proba2.sidc.be/swap/data/mpg/movies/weekly_movies/weekly_movie_2023_03_06.mp4.
Details about some of this week's events can be found further below.
If any of the linked movies are unavailable they can be found in the P2SC movie repository here: https://proba2.oma.be/swap/data/mpg/movies/.
Monday March 06
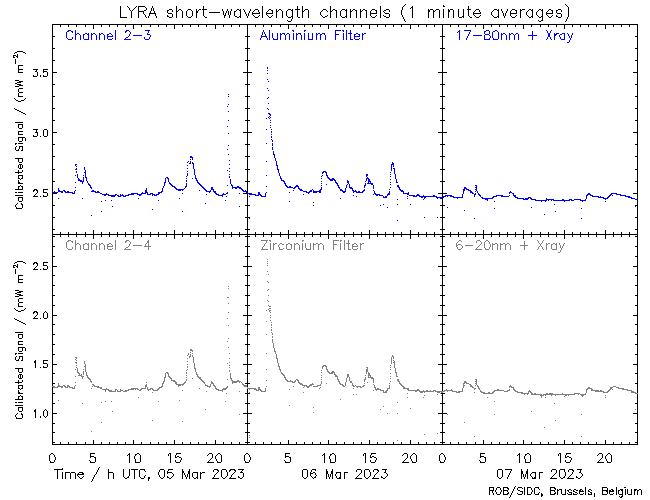
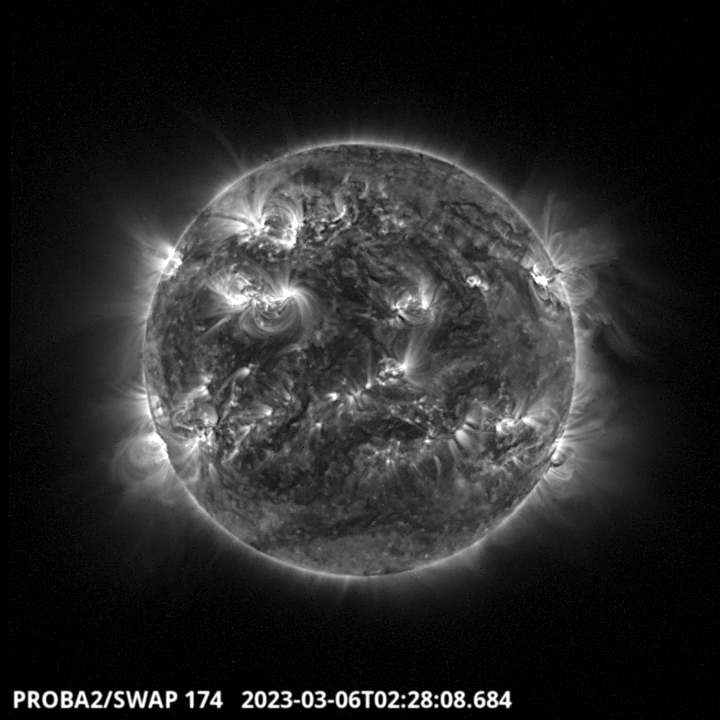
The largest flare of the week, an M5.8 flare, was observed by LYRA (top panel) and SWAP (bottom panel). The flare occurred on 2023-Mar-06 (peak at 02:28 UT) on the north-western hemisphere close to the limb, and it was associated with NOAA AR3243.
Find a SWAP movie of the event here: https://proba2.sidc.be/swap/movies/20230306_swap_movie.mp4.
Noticeable Solar Events (6 Mar 2023 - 12 Mar 2023)
| DAY | BEGIN | MAX | END | LOC | XRAY | OP | 10CM | TYPE | Cat | NOAA |
| 06 | 0208 | 0228 | 0235 | N19W65 | M5.8 | 2N | 480 | IV/1III/1VI/2 | 6 | 3243 |
| 06 | 0857 | 0912 | 0937 | M1.3 | III/1 | |||||
| 06 | 1724 | 1750 | 1810 | M1.0 | CTM/1 | 5 | 3242 | |||
| 08 | 0953 | 1012 | 1046 | M1.1 | 5 | 3242 | ||||
| 08 | 2235 | 2244 | 2252 | S24E14 | M1.3 | 1N | 10 | 3245 |
| LOC: approximate heliographic location | TYPE: radio burst type |
| XRAY: X-ray flare class | Cat: Catania sunspot group number |
| OP: optical flare class | NOAA: NOAA active region number |
| 10CM: peak 10 cm radio flux |
International Sunspot Number by SILSO (6 Mar 2023 - 12 Mar 2023)
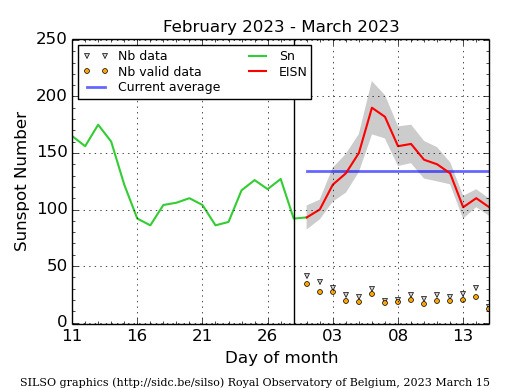
The daily Estimated International Sunspot Number (EISN, red curve with shaded error) derived by a simplified method from real-time data from the worldwide SILSO network. It extends the official Sunspot Number from the full processing of the preceding month (green line), a few days more than one solar rotation. The horizontal blue line shows the current monthly average. The yellow dots give the number of stations that provided valid data. Valid data are used to calculate the EISN. The triangle gives the number of stations providing data. When a triangle and a yellow dot coincide, it means that all the data is used to calculate the EISN of that day.
Geomagnetic Observations in Belgium (6 Mar 2023 - 12 Mar 2023)
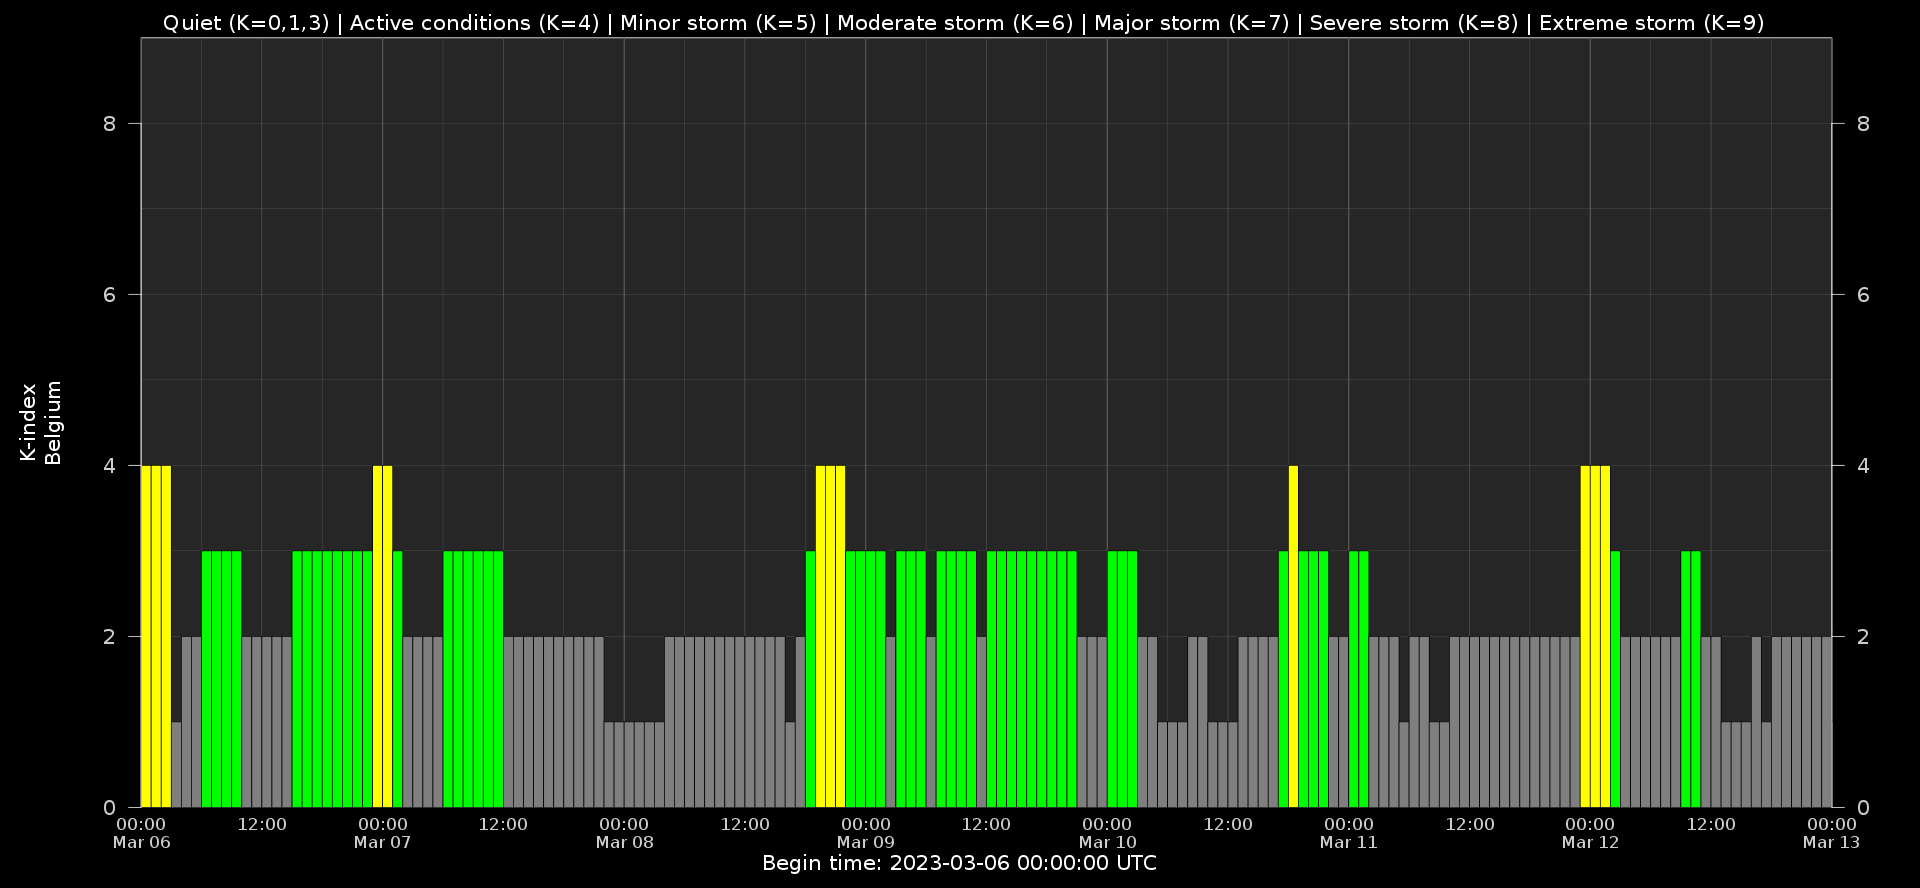
Local K-type magnetic activity index for Belgium based on data from Dourbes (DOU) and Manhay (MAB). Comparing the data from both measurement stations allows to reliably remove outliers from the magnetic data. At the same time the operational service availability is improved: whenever data from one observatory is not available, the single-station index obtained from the other can be used as a fallback system.
Both the two-station index and the single station indices are available here: http://ionosphere.meteo.be/geomagnetism/K_BEL/
The SIDC Space Weather Briefing
The Space Weather Briefing presented by the forecaster on duty from March 5 to 12. It reflects in images and graphs what is written in the Solar and Geomagnetic Activity report: https://www.stce.be/briefings/20230313_SWbriefing.pdf
If you need to access the movies, contact us: stce_coordination at stce.be
Review of ionospheric activity (6 Mar 2023 - 12 Mar 2023)
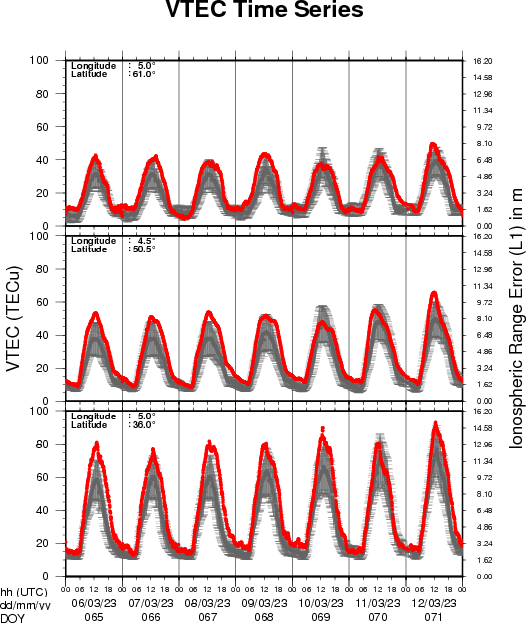
The figure shows the time evolution of the Vertical Total Electron Content (VTEC) (in red) during the last week at three locations:
a) in the northern part of Europe(N 61deg E 5deg)
b) above Brussels(N 50.5deg, E 4.5 deg)
c) in the southern part of Europe(N 36 deg, E 5deg)
This figure also shows (in grey) the normal ionospheric behaviour expected based on the median VTEC from the 15 previous days.
The VTEC is expressed in TECu (with TECu=10^16 electrons per square meter) and is directly related to the signal propagation delay due to the ionosphere (in figure: delay on GPS L1 frequency).
The Sun's radiation ionizes the Earth's upper atmosphere, the ionosphere, located from about 60km to 1000km above the Earth's surface.The ionization process in the ionosphere produces ions and free electrons. These electrons perturb the propagation of the GNSS (Global Navigation Satellite System) signals by inducing a so-called ionospheric delay.
See http://stce.be/newsletter/GNSS_final.pdf for some more explanations ; for detailed information, see http://gnss.be/ionosphere_tutorial.php
Calendar
Check out our activity calendar: activities and encounters with the Sun-Space-Earth system and Space Weather as the main theme. We provide occasions to get submerged in our world through educational, informative and instructive activities.
If you want your event in our calendar, contact us: stce_coordination at stce.be
* March 17, STCE seminar: The European Space Weather and Space Climate association (E-SWAN) and the future benefit for its community, Nicolet@spacepole and Teams, Brussels, Belgium
* March 27-29, STCE Space Weather Introductory Course, Brussels, Belgium - FULL
* April 21, BIRA-IASB seminar: High resolution modelling of atmospheric composition over Antwerp, Belgium, Nicolet@spacepole and Teams, Brussels, Belgium
* April 28, STCE seminar: Space Weather Tools in Support of Space Radiation Operations, Nicolet@spacepole and Teams, Brussels, Belgium
* May 22-24, STCE Space Weather Introductory Course, Brussels, Belgium - FULL
* May 25, STCE seminar: Comparative study of a constant-alpha force-free field and its approximations in an ideal toroid, Meridian room@spacepole and zoom, Brussels, Belgium
* May 29 - June 1, PITHIA-NRF Training School, Rome, Italy
Check: https://www.stce.be/calendar