
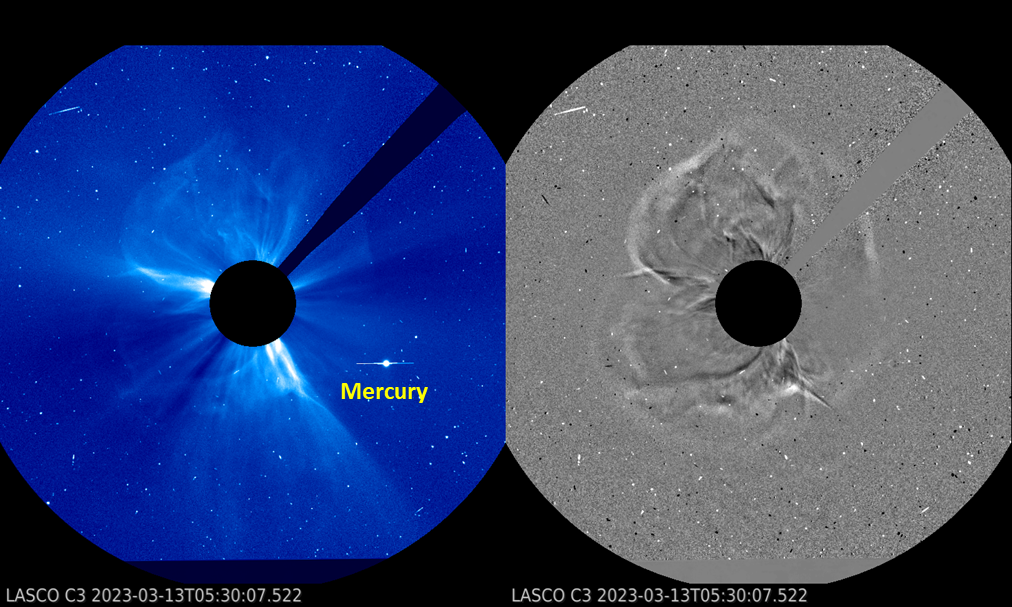
Early on 13 March, coronagraphic imagery on board STEREO-A (COR2; at 03:38 UTC) and SOHO (LASCO/C2; at 03:36 UTC) revealed the emergence of a powerful coronal mass ejection (CME) with a plane-of-the-sky speed in excess of 1700 km/s. There were no large or complex sunspot groups on the earth-facing side of the Sun, and there was no substantial activity in extreme ultraviolet (EUV). Space weather forecasters of the SIDC thus quickly came to the conclusion that the source of the observed CME was on the Sun's farside. The imagery underneath is from the SOHO/LASCO C3 coronagraph, with on the right difference images (one image subtracted from the next) to highlight faint features of this halo CME. The bright dot near the Sun is the planet Mercury currently located on the other side of the Sun.
The helioseismological map underneath indicates there are a number of active regions on the Sun's farside. Helioseismology is a branch of solar research that is very similar to seismology on Earth, where by studying the waves induced by earthquakes, scientists get an idea on the Earth's interior. Indeed, by carefully "listening" to the up and down movements all over the solar surface, helioseismologists get a pretty good idea on the specifics of the solar interior. Moreover, by studying the related acoustic waves that are travelling through the solar interior, they can virtually "see" any rather big, active region that may be present on the far side. Such maps are available from ground-based networks (NSO/GONG) and space-based observations (JSOC/SDO/HMI). The synchronic map underneath shows the full Sun (between latitudes -60° and +60°) stitching together HMI magnetograms (grayish; earth-facing solar hemisphere) and helioseismic observations (orangish; farside) as available at JSOC/SDO/HMI. Concentrations of magnetic fields (active regions) can be seen in the magnetograms as blue-greenish and red-yellowish patches, whereas in the helioseismic maps these concentrations are represented by dark patches.
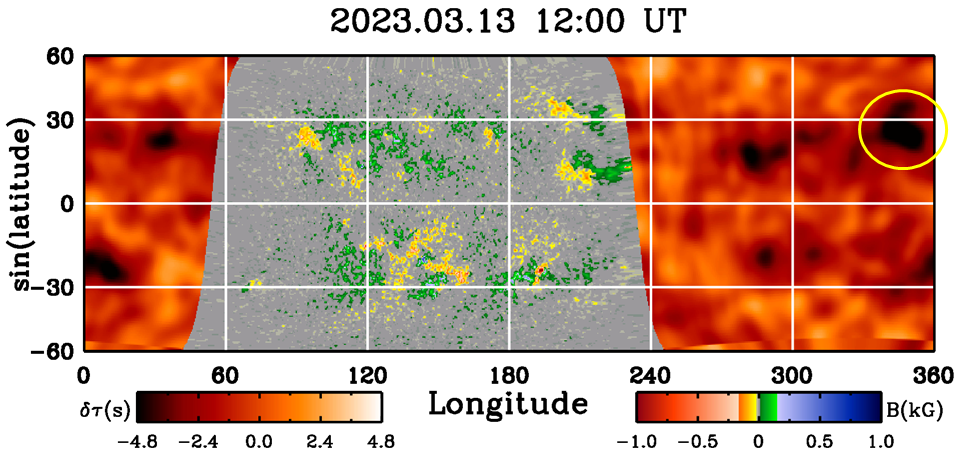
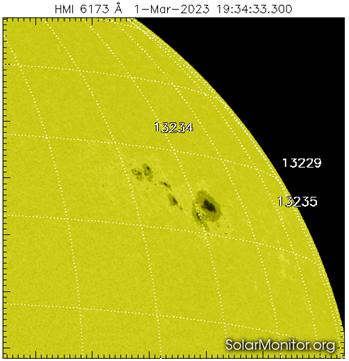
Analysis of the speeds of the expanding CME pinpointed a dark patch almost diametrically opposed to the Earth as the most likely source of the eruption (indicated by the yellow ellipse in the synchronic map above). The location of this active region corresponds loosely to NOAA 13234, which produced an X-class flare on 3 March just before rounding the Sun's west limb (see this STCE newsitem). The SDO/HMI image underneath shows this sunspot group as it was on 1 March. It seems NOAA 13234 is still quite active, and may be worth watching when it will rotate over the Sun's east limb within 4 to 5 days.
Despite this eruption being at the worst possible location for producing a proton event detectable at Earth, GOES exactly observed that. The increase in the greater than 10 MeV proton flux started about an hour after the first observation of the CME and reached a maximum of 11.6 pfu at 09:10 UTC, as shown in the graph underneath. Proton events usually originate from an erupting source on the western solar hemisphere as seen from Earth, because the Sun's magnetic field lines are much better connected from there to the Earth environment (Parker's spiral). However, it is well known that proton events and enhancements can originate from the Sun's farside too. Typical examples are the 23 July 2012 event and the 1 September 2014 proton flux enhancement. The exact mechanism behind this is not entirely understood yet, but research has shown this might have to do with how well the expanding CME (shock) eventually can tap into magnetic field lines connected to Earth (see e.g. Prise et al. 2014 ; Kouloumvakos et al. 2023).
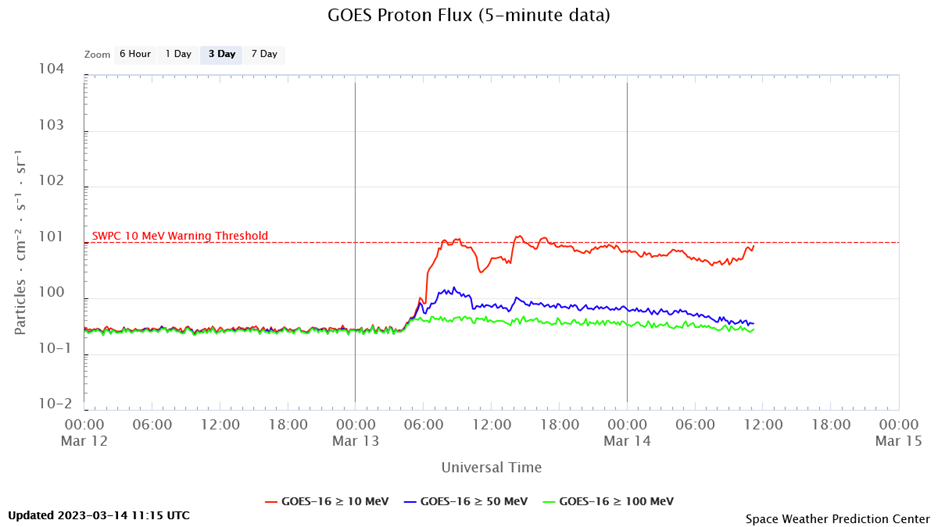
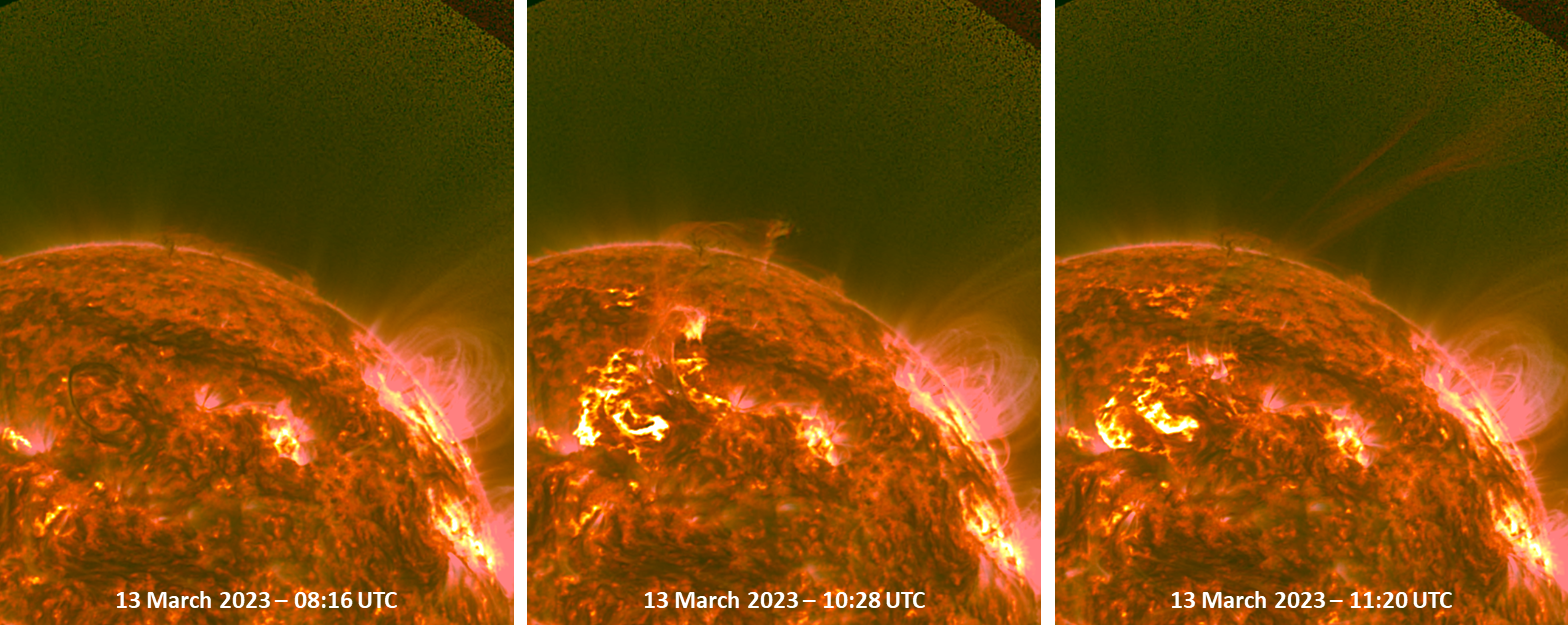
The evolution of the greater than 10 MeV proton flux is somewhat atypical, with after the first maximum at 09:10 UTC, a dip around 11:00 UTC before increasing again to a second maximum of 13.2 pfu at 14:35 UTC. This may suggest, amongst other possibilities, the contribution from another source such as from the violent horseshoe-shaped filament eruption near the Sun's central meridian starting around 09:45 UTC and associated with a long duration C3 flare, all on the same day. Further analysis is required to straighten out the exact cause and chain of events. The GOES/SUVI images underneath show the filament eruption at temperatures around 80.000 degrees (SUVI 304; red) and around 700.000 degrees (SUVI 171; greenish). This eruption was associated with a CME that had a plane-of-the-sky speed around 750 km/s (CACTus). Though the CME seems to be mostly moving in the northwest direction, there's a possibility that it delivers a glancing blow to the Earth environment late on 15 or early on 16 March.
