- Table of Content
- 1.An abundancy o...
- 2.STCE at Nerdla...
- 3.Another SWx co...
- 4.Review of spac...
- 5.PROBA2 Observa...
- 6.International ...
- 7.Noticeable Sol...
- 8.Geomagnetic Ob...
- 9.The SIDC Space...
- 10.Review of Iono...
- 11.Calendar
2. STCE at Nerdland
3. Another SWx course completed
4. Review of space weather
5. PROBA2 Observations (15 May 2023 - 21 May 2023)
6. International Sunspot Number by SILSO
7. Noticeable Solar Events
8. Geomagnetic Observations in Belgium
9. The SIDC Space Weather Briefing
10. Review of Ionospheric Activity
11. Calendar
An abundancy of M-class flares
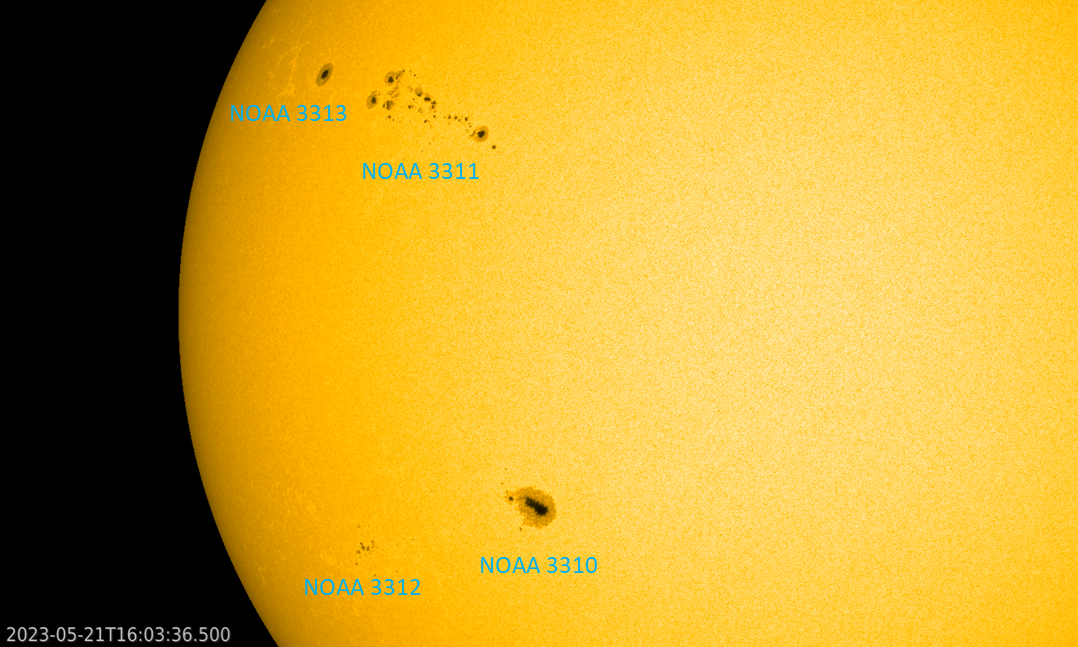
Since a few days, the solar disk shows again some relatively large and complex sunspot regions. NOAA 3310 had the biggest sunspot and has been visible with the naked eye (using eclipse glasses of course!). On 16 September, just before it started to round the southeast solar limb, it was (most likely) the source of the largest solar flare of the week (M9.6). Since then, it has remained quite silent in terms of strong flares. This is quite in contrast with its neighbour on the northern solar hemisphere NOAA 3311, which appeared a day later near the northeast limb and was producing immediately many M-class flares. In the white light imagery underneath (SDO/HMI - http://sdo.gsfc.nasa.gov/data/aiahmi/ ) each of the sunspot groups are shown with their NOAA group number next to it. A clip is available in the online version of this manuscript at https://www.stce.be/news/647/welcome.html
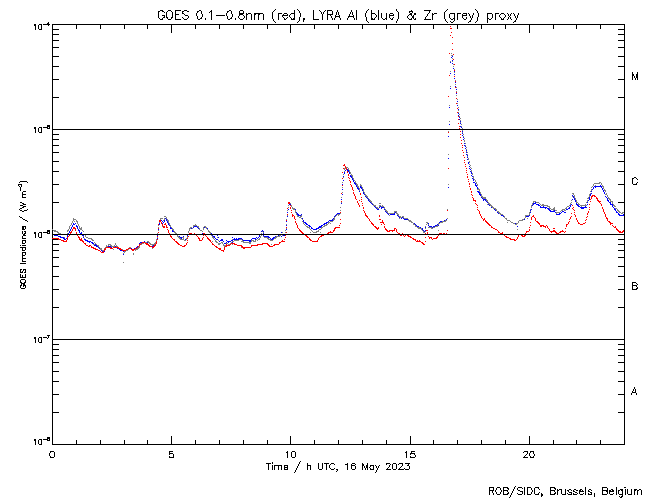
So far, NOAA 3311 has been the source of 21 M-class flares. This number is in the same ballpark as that from NOAA 3165 which produced 24 M-class flares mid-December last year. Some active regions are able to produce several dozens of M-class flares, such as e.g. the famous NOAA 2192 in October 2014 (see this STCE newsitem at https://www.stce.be/news/285/welcome.html ). Last week, there were only 2 other M-class flares that have been produced: an M1.1 on 20 May generated by NOAA 3312 which is a small sunspot region in the wake of NOAA 3310, and the already mentioned M9.6 flare which was most likely produced by NOAA 3310. The graph underneath shows the evolution of the x-ray flux as recorded by GOES (https://www.swpc.noaa.gov/products/goes-x-ray-flux ). The M-class flares by NOAA 3310 and 3312 are indicated, all the other M-class flares have been produced by NOAA 3311.

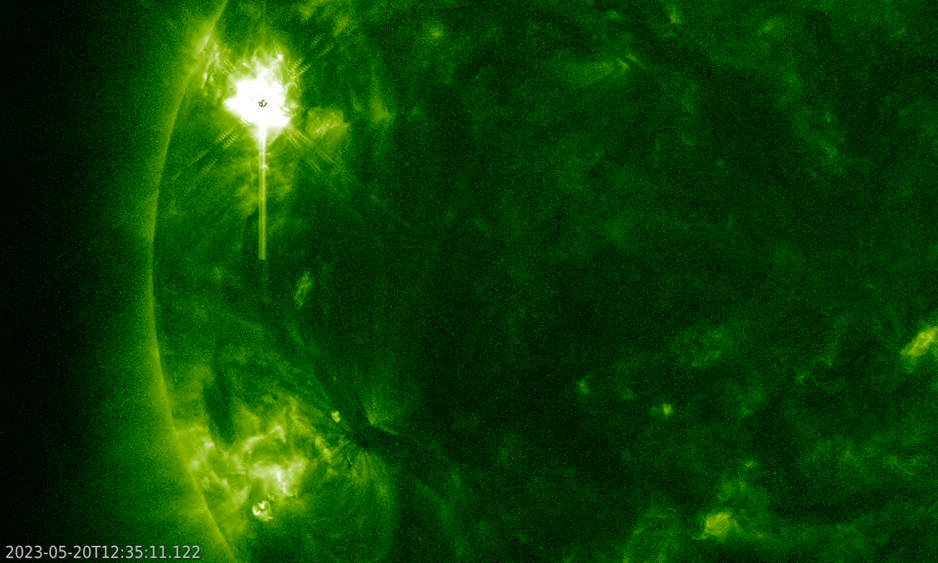
The strongest flare produced by NOAA 3311 was the M8.9 flare also on 20 May. The imagery underneath shows the M8.9 flare near the time of its maximum in extreme ultraviolet (EUV ; SDO/AIA 094). The blooming and diffraction patterns in the EUV images are image artifacts, and are not related to the flare itself - See this STCE newsitem (https://www.stce.be/news/499/welcome.html ) for more info. A clip, covering the period from 06:00 until 16:00UTC on 20 May, is available in the online version of this manuscript at https://www.stce.be/news/647/welcome.html It shows several other strong flares, with the M8 flare preceded by an M6 flare at 07:32 UTC, and followed by an M5 flare at 15:00 UTC.
STCE at Nerdland
Nerdland is a fun science festival in Wachtebeke, Belgium. On May 26, 27 and 28 you can dive into the science of almost all scientific disciplines: biology, dino's, medicine, physics, ... and also Space.
Christine Verbeke, an STCE colleague, is one of the guests of the (Extra) Terrestrial Science Show on Saturday, May 27.
Lieven and Hetty dive into everything that feels (otherworldly). Amateur astronomer and gifted storyteller Stijn Meuris looks back after one year of James Webb. ESA engineer Koen De Beule brings things that have already been in space. Stijn Janssen tells us how we can use our own planet's heat to get rid of gas. And to Christine Verbeke we ask when the next solar storm will completely kill all our technology. An hour of fascinating conversations and punishing images, together with our live band and special guest Lauren Versnick.
Check: https://www.nerdlandfestival.be/nl/programma/wetenschapsshow-buiten-aards

Another SWx course completed
Another peloton of future space weather experts and operators reached the finish line of the Space Weather Introductory Course, almost. Next week, the class of eight will do the final test to obtain their certificate.
The Sun treated us with a spot such that the class could see with their own eyes what we were talking about.

Check out the SWIC program: https://events.spacepole.be/event/150/
Review of space weather
Events on the Sun: Active Regions (ARs) and flares
Fifteen (15) active regions were observed on the visible side of the solar disk, most of them had relatively simple alpha or beta magnetic field configuration. NOAA AR 3311, which was the source of the majority of the strongest flares, had a beta-gamma-delta configuration of the photospheric magnetic field. NOAA AR 3305 with varying magnetic complexity (beta and beta-gamma), produced multiple low to high C-class flares.
Solar flaring activity ranged between low and moderate levels. A total of 49 C-class flares and 19 M-class flares were reported. At the start of the week until May 16, solar flaring activity was at low levels; NOAA AR 3305, NOAA AR 3306 were the sources of the majority of the flaring activity. On May 16 solar flaring activity reached moderate levels; most of the flaring activity was associated with NOAA AR 3305 and 3311. The largest flare was an M9.6 flare, peaking at 16:43 UTC on May 16, associated with ARs behind the east limb (S23E89). The second largest flare was an M8.9 flare, peaking at 12:35 UTC on May 20, associated with NOAA AR 3311.
Events on the Sun: Coronal mass ejections
The solar surface was streaked by filaments and multiple eruptions were observed.
The coronal mass ejection (CME) associated with the C4.3 flare (peaking at 15:30 UTC on May 17) from NOAA AR 3309 and the filament eruption around 16:00 UTC on May 17, was observed in SoHO/LASCO C2 coronagraph at around 16:36 UTC on May 17. The CME was directed to the southwest and the bulk of the CME was not expected to be Earth directed. However, a glancing blow of the shock was predicted to impact Earth from late May 21. Indeed, shock was observed in the solar wind on May 21, that might be associated to the CME.
Events on the Sun: Coronal Holes
Two equatorial coronal holes of negative polarity were visible in the week. The first one has crossed the central meridian on May 17 and the second one on May 21.
Solar Proton flux near Earth
The greater than 10 MeV proton flux was at nominal levels at the start of the week and got slightly elevated on May 16 following M9.6 flare, remaining well below radiation storm levels. On May 19 the proton flux returned to the nominal levels and remained at the nominal levels for the rest of the week.
Electron fluxes at GEO
The greater than 2 MeV electron flux was below the 1000 pfu threshold throughout the week. The 24h electron fluence was at normal levels throughout the week.
Solar wind at L1
The solar wind parameters have been indicative of slow solar wind conditions at the start of the week. The solar wind speed showed a gradually decreasing trend from 480 km/s to values around 320 km/s. The magnetic field was predominantly in the positive sector (field directed away from the Sun) with a variable north-south component Bz ranging between -7 to 4 nT.
A high-speed stream from a negative polarity equatorial coronal hole began to influence the Earth from May 19. The solar wind conditions became slightly disturbed with the total interplanetary magnetic field rose to 20 nT at around 03:15UTC on May 20. The north-south component of the magnetic field was variable, ranging between -17 to 10 nT. The solar wind velocity followed an increasing trend, rising from 320 km/s to 610 km/s. The magnetic field showed a switch from the positive (field away from the Sun) to negative sector (field towards the Sun).
On May 21, around 13:20UTC a shock was observed with solar wind speed jumping from 440 km/s to 580 km/s and the total interplanetary magnetic field jumping from 4 nT to 13 nT. The shock might be associated to the CMEs that left the Sun on 16:36 UTC, May 17.
Geomagnetism
The geomagnetic conditions were at quiet to unsettled levels at the start of the week, increasing to active on May 19 due to the ICME and high speed steam influences with isolated moderate storm period globally (NOAA- Kp = 6-) ) in the period 00:00 UTC to 06:00 UTC on May 20 and 18:00 UTC to 00:00 UTC on May 21. Locally over Belgium a short isolated minor storm interval was observed between 18:00 and 19:00 UTC on May 21.
PROBA2 Observations (15 May 2023 - 21 May 2023)
Solar Activity
Solar flare activity fluctuated from low to moderate during the week.
In order to view the activity of this week in more detail, we suggest to go to the following website from which all the daily (normal and difference) movies can be accessed: https://proba2.oma.be/ssa
This page also lists the recorded flaring events.
A weekly overview movie (SWAP week 686) can be found here: https://proba2.sidc.be/swap/data/mpg/movies/weekly_movies/weekly_movie_2023_05_15.mp4.
Details about some of this week's events can be found further below.
If any of the linked movies are unavailable they can be found in the P2SC movie repository here: https://proba2.oma.be/swap/data/mpg/movies/.
Tuesday May 16
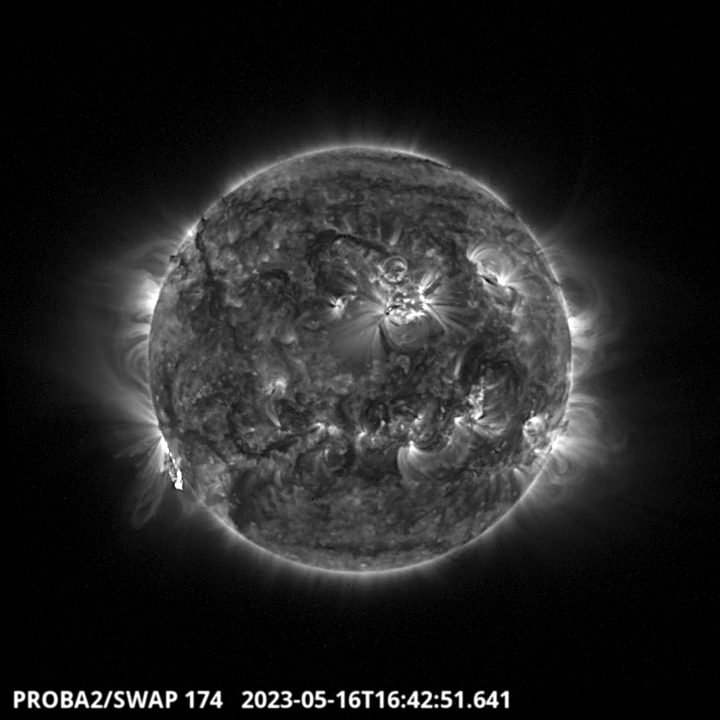
The largest flare of the week, an M9.6, was observed by LYRA (top panel) and SWAP (bottom panel). The flare occurred on 2023-May-16 (peak at 16:43 UT) and originated from an active region located just behind the south-eastern limb of the Sun.
Find a SWAP movie of the event here: https://proba2.sidc.be/swap/movies/20230516_swap_movie.mp4.
International Sunspot Number by SILSO
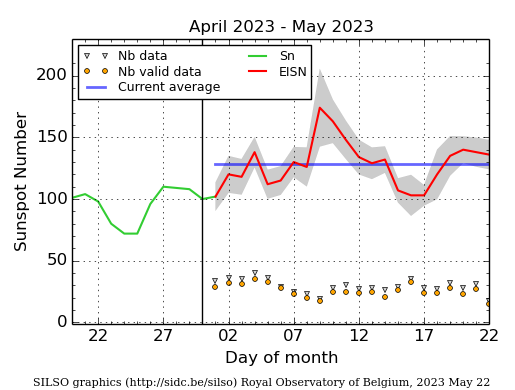
The daily Estimated International Sunspot Number (EISN, red curve with shaded error) derived by a simplified method from real-time data from the worldwide SILSO network. It extends the official Sunspot Number from the full processing of the preceding month (green line), a few days more than one solar rotation. The horizontal blue line shows the current monthly average. The yellow dots give the number of stations that provided valid data. Valid data are used to calculate the EISN. The triangle gives the number of stations providing data. When a triangle and a yellow dot coincide, it means that all the data is used to calculate the EISN of that day.
Noticeable Solar Events
| DAY | BEGIN | MAX | END | LOC | XRAY | OP | 10CM | TYPE | Cat | NOAA |
| 16 | 1631 | 1643 | 1651 | M9.6 | ||||||
| 18 | 0613 | 0626 | 0638 | M1.0 | 3311 | |||||
| 18 | 0648 | 0655 | 0702 | M1.2 | 3311 | |||||
| 18 | 1132 | 1147 | 1200 | M2.2 | 3311 | |||||
| 18 | 1200 | 1213 | 1222 | M1.9 | 3311 | |||||
| 18 | 1239 | 1249 | 1256 | M1.6 | III/1 | 3311 | ||||
| 18 | 1732 | 1751 | 1801 | M1.1 | 3311 | |||||
| 18 | 2012 | 2023 | 2051 | M3.8 | VI/2 | 3311 | ||||
| 19 | 0041 | 0048 | 0054 | N18E74 | M5.3 | 1N | 3311 | |||
| 19 | 0305 | 0312 | 0323 | N19E72 | M1.6 | SN | III/1 | 3311 | ||
| 19 | 0449 | 0500 | 0510 | N19E72 | M2.5 | 1N | 3311 | |||
| 18 | 2051 | 2105 | 2116 | M4.5 | 3311 | |||||
| 19 | 1945 | 2006 | 2014 | N16E61 | M2.3 | SF | VI/1 | 3311 | ||
| 19 | 2014 | 2026 | 2038 | M2.7 | 3311 | |||||
| 20 | 0649 | 0702 | 0712 | N19E72 | M1.0 | SF | 3311 | |||
| 20 | 0716 | 0732 | 0736 | N19E72 | M6.4 | 1N | 140 | III/1 | 3311 | |
| 20 | 0918 | 0927 | 0932 | M1.1 | III/1 | 3312 | ||||
| 20 | 1048 | 1054 | 1110 | M1.6 | 3311 | |||||
| 20 | 1225 | 1235 | 1240 | M8.9 | III/1 | 3311 | ||||
| 20 | 1454 | 1500 | 1504 | M5.6 | 3311 | |||||
| 20 | 1857 | 1903 | 1907 | M1.1 | 3311 | |||||
| 20 | 2252 | 2306 | 2321 | N19E49 | M5.1 | 1F | 170 | 3311 | ||
| 21 | 0218 | 0223 | 0233 | N20E47 | M1.4 | SN | 3311 | |||
| 21 | 1549 | 1604 | 1618 | N17E40 | M2.6 | 1N | 3311 |
| LOC: approximate heliographic location | TYPE: radio burst type |
| XRAY: X-ray flare class | Cat: Catania sunspot group number |
| OP: optical flare class | NOAA: NOAA active region number |
| 10CM: peak 10 cm radio flux |
Geomagnetic Observations in Belgium
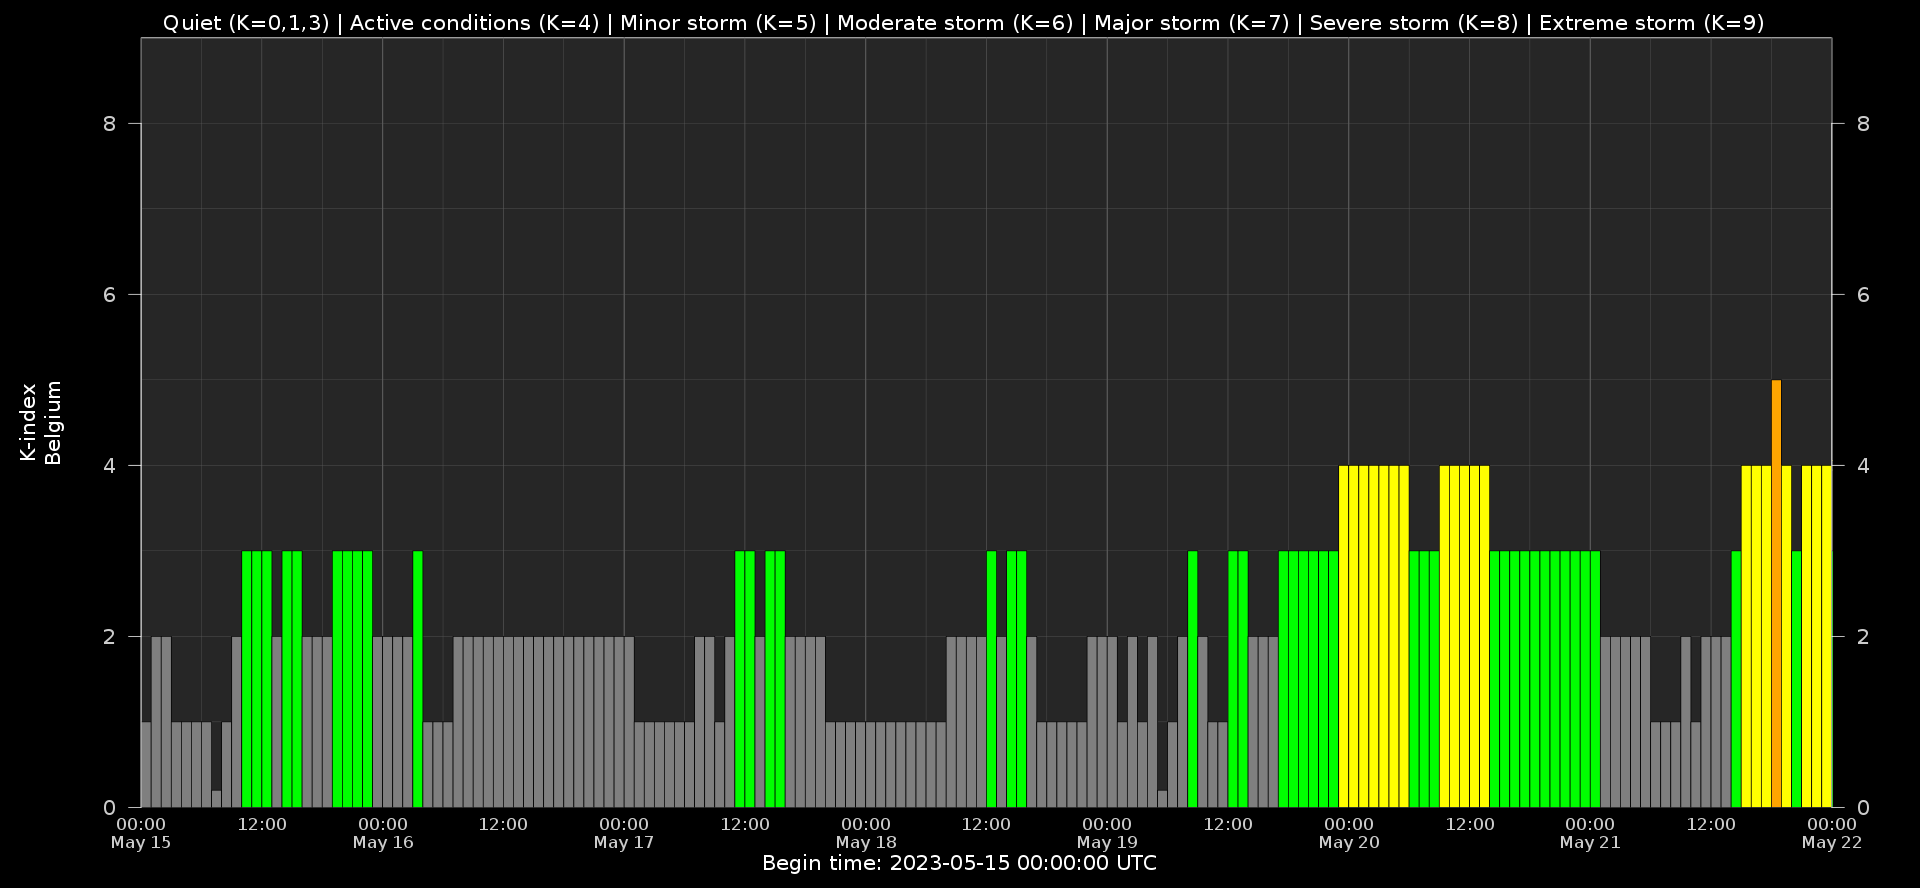
Local K-type magnetic activity index for Belgium based on data from Dourbes (DOU) and Manhay (MAB). Comparing the data from both measurement stations allows to reliably remove outliers from the magnetic data. At the same time the operational service availability is improved: whenever data from one observatory is not available, the single-station index obtained from the other can be used as a fallback system.
Both the two-station index and the single station indices are available here: http://ionosphere.meteo.be/geomagnetism/K_BEL/
The SIDC Space Weather Briefing
The Space Weather Briefing presented by the forecaster on duty from May to 21. It reflects in images and graphs what is written in the Solar and Geomagnetic Activity report: https://www.stce.be/briefings/20230522_SWbriefing.pdf
If you need to access the movies, contact us: stce_coordination at stce.be
Review of Ionospheric Activity
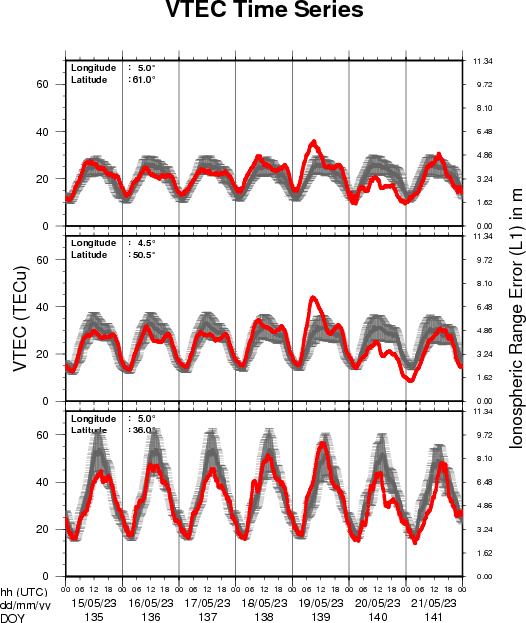
The figure shows the time evolution of the Vertical Total Electron Content (VTEC) (in red) during the last week at three locations:
a) in the northern part of Europe(N 61deg E 5deg)
b) above Brussels(N 50.5deg, E 4.5 deg)
c) in the southern part of Europe(N 36 deg, E 5deg)
This figure also shows (in grey) the normal ionospheric behaviour expected based on the median VTEC from the 15 previous days.
The VTEC is expressed in TECu (with TECu=10^16 electrons per square meter) and is directly related to the signal propagation delay due to the ionosphere (in figure: delay on GPS L1 frequency).
The Sun's radiation ionizes the Earth's upper atmosphere, the ionosphere, located from about 60km to 1000km above the Earth's surface.The ionization process in the ionosphere produces ions and free electrons. These electrons perturb the propagation of the GNSS (Global Navigation Satellite System) signals by inducing a so-called ionospheric delay.
See http://stce.be/newsletter/GNSS_final.pdf for some more explanations ; for detailed information, see http://gnss.be/ionosphere_tutorial.php
Calendar
Check out our activity calendar: activities and encounters with the Sun-Space-Earth system and Space Weather as the main theme. We provide occasions to get submerged in our world through educational, informative and instructive activities.
If you want your event in our calendar, contact us: stce_coordination at stce.be
* May 29 - June 1, PITHIA-NRF Training School, Rome, Italy
* June 7, STCE seminar: Physics-informed neural networks for solar magnetic field simulations, Meridian room@ROB and online, Brussels, Belgium
* June 12-14, STCE Space Weather Course for BKG, Brussels, Belgium
* June 29, STCE annual meeting, Brussels, Belgium
* Nov 18-19, e-SWAN Space Weather School: data, models and services, by the STCE, Toulouse, France
The dates for 2 additional 'Space Weather Introductory Course' and a new course on 'Space Weather Impacts on the ionosphere, focus on GNSS and HF' will be published soon.
Check: https://www.stce.be/calendar