- Table of Content
- 1.Steady as she ...
- 2.Review of spac...
- 3.PROBA2 Observa...
- 4.International ...
- 5.Noticeable Sol...
- 6.Geomagnetic Ob...
- 7.The SIDC Space...
- 8.Review of Iono...
- 9.Calendar
2. Review of space weather
3. PROBA2 Observations (29 May 2023 - 4 Jun 2023)
4. International Sunspot Number by SILSO
5. Noticeable Solar Events
6. Geomagnetic Observations in Belgium
7. The SIDC Space Weather Briefing
8. Review of Ionospheric Activity
9. Calendar
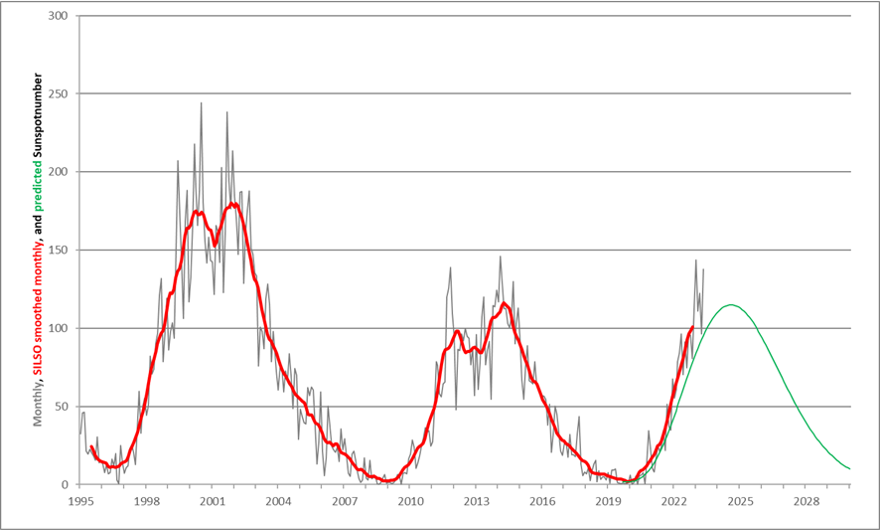
Steady as she goes...
The STCE's SC25 Tracking page (https://www.stce.be/content/sc25-tracking ) has been updated to reflect the latest evolution in some critical space weather parameters for the ongoing solar cycle 25 (SC25), from sunspot numbers over geomagnetic indices all the way to cosmic rays. The multiple graphs allow for a comparison with previous solar cycles at similar stages in their evolution.
Solar activity remained at the enhanced levels already recorded in December 2022 and January 2023. The provisional monthly sunspot number reached values between about 100 and 140 (SILSO - https://www.sidc.be/silso/ ), reminiscent of the previous solar cycle maximum. Based on this surge in solar activity, the Solar Cycle Science webpage (http://solarcyclescience.com/forecasts.html ) now gives a maximum for SC25 around 135 In October 2024 (best fitting curve for a single maximum). The results from the SILSO prediction methodologies (12-month window ; https://www.sidc.be/silso/ssngraphics ) are somewhat diverging, but favor sunspot numbers well above the ones initially predicted by the SC25 panel, i.e. well above 115. These numbers can change further pending the evolution of solar activity in the coming months. Also, there's still a good possibility that SC25 may have a similar outlook as SC24, i.e. with 2 moderate, well-separated maxima.
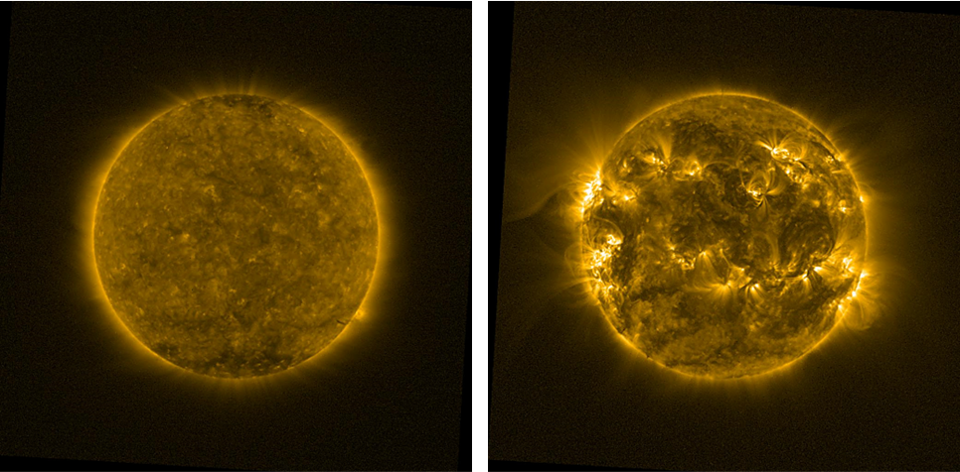
The increase in sunspot numbers was accompanied by a corresponding enhancement in other solar parameters, such as the solar radio flux and the number of solar flares. Also the number of coronal mass ejections (CME) was near an average of 6/day. The February to April 2023 period saw some important geomagnetic storms. A strong geomagnetic storm on 26-27 February 2023 affected drilling operations in Manitoba, Canada. The severe storms from 23-24 March (Dst = -163 nT) and 23-24 April (Dst = -212 nT) resulted in spectacular aurora and also impacted some GNSS applications. The April storm was the strongest since the famous St-Patrick Day's event of 17 March 2015. The images underneath show the Sun in extreme ultraviolet, as pictured by the PROBA2/SWAP instrument (https://proba2.sidc.be/ssa ). Both images were taken on 10 February, but the one to the left dates from 2020 near solar cycle minimum, while the one to the right was taken in 2023 and exemplifies the increased solar activity that has been observed during the last few months.
Review of space weather
Solar Active Regions (ARs) and flares
The week started with seven active regions visible on the solar disk. Later this week, ten more active regions were visible, for a total of 17 throughout the week (NOAA ARs 3310 to 3326). The X-ray background was above the C-level all week. NOAA ARs 3315 and 3319 reached a beta-gamma-delta magnetic field configuration. Seven M-class flares occurred, on 30 May (NOAA ARs 3310 and 3315), 31 May (NOAA ARs 3319 and 3323), and 2 June (NOAA AR 3324).
Solar wind disturbances: Coronal mass ejections
A filament eruption occurred in the southwestern quadrant of the Sun from around 08:30 UTC on June 4th. The associated coronal mass ejection (CME) was observed in SoHO/LASCO C2 coronagraph data from 10:36 UTC on June 4th. The CME was directed to the south-west and the bulk of the CME is not expected to be Earth directed. However, a glancing blow of the shock may impact Earth in the late evening of June 07 or in the first half of June 08.
Solar wind disturbances: Coronal Holes
Two positive polarity, one at the equator (small) and one in the southern hemisphere, the corresponding high speed streams did not arrive to the Earth.
Solar Proton flux levels
Below the storm threshold.
Electron fluxes at GEO
Below storm threshold.
Solar wind
The solar wind was slow throughout of the week. On 1 June it reached 500 km/s during some hours. The interplanetary magnetic field was below 10 nT the whole week except some brief peaks on 4 June, with mostly negative polarity (towards the Sun).
Geomagnetism
The week was mostly quiet to moderate with the exception of some periods of K_Belgium and Kp reaching 4, on 31 May, 1 June and 4 June.
PROBA2 Observations (29 May 2023 - 4 Jun 2023)
Solar Activity
Solar flare activity fluctuated from low to moderate during the week.
In order to view the activity of this week in more detail, we suggest to go to the following website from which all the daily (normal and difference) movies can be accessed: https://proba2.oma.be/ssa
This page also lists the recorded flaring events.
A weekly overview movie can be found here (SWAP week 688). https://proba2.oma.be/swap/data/mpg/movies/weekly_movies/weekly_movie_2023_05_29.mp4
Details about some of this week's events can be found further below.
If any of the linked movies are unavailable they can be found in the P2SC movie repository here https://proba2.oma.be/swap/data/mpg/movies/
Wednesday May 31
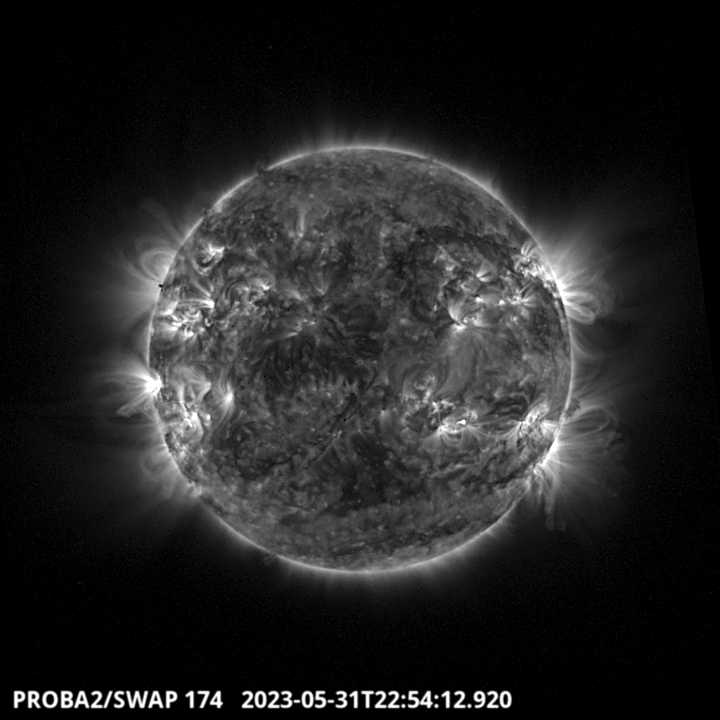
The largest flare of the week, a M4.2 flare, was produced by the active region NOAA 3323, on the East limb (see SWAP movie). https://proba2.sidc.be/swap/movies/20230531_swap_movie.mp4
International Sunspot Number by SILSO

The daily Estimated International Sunspot Number (EISN, red curve with shaded error) derived by a simplified method from real-time data from the worldwide SILSO network. It extends the official Sunspot Number from the full processing of the preceding month (green line), a few days more than one solar rotation. The horizontal blue line shows the current monthly average. The yellow dots give the number of stations that provided valid data. Valid data are used to calculate the EISN. The triangle gives the number of stations providing data. When a triangle and a yellow dot coincide, it means that all the data is used to calculate the EISN of that day.
Noticeable Solar Events
| DAY | BEGIN | MAX | END | LOC | XRAY | OP | 10CM | TYPE | Cat | NOAA |
| 30 | 0754 | 0810 | 0819 | S0E0 | M1.2 | SF | 93 | 3310 | ||
| 30 | 1015 | 1022 | 1029 | M1.3 | 210 | 93 | 3310 | |||
| 30 | 1336 | 1338 | 1341 | S20W41 | M1.4 | 1B | III/2 | 1 | 3315 | |
| 31 | 0424 | 0438 | 0444 | M1.3 | 3323 | |||||
| 31 | 1223 | 1226 | 1230 | M1.0 | 7 | 3319 | ||||
| 31 | 2147 | 2208 | 2214 | S7E81 | M1.0 | SF | 3323 | |||
| 31 | 2214 | 2252 | 2312 | S7E81 | M4.2 | SF | 3323 | |||
| 02 | 0232 | 0241 | 0245 | M1.5 | 3324 |
| LOC: approximate heliographic location | TYPE: radio burst type |
| XRAY: X-ray flare class | Cat: Catania sunspot group number |
| OP: optical flare class | NOAA: NOAA active region number |
| 10CM: peak 10 cm radio flux |
Geomagnetic Observations in Belgium

Local K-type magnetic activity index for Belgium based on data from Dourbes (DOU) and Manhay (MAB). Comparing the data from both measurement stations allows to reliably remove outliers from the magnetic data. At the same time the operational service availability is improved: whenever data from one observatory is not available, the single-station index obtained from the other can be used as a fallback system.
Both the two-station index and the single station indices are available here: http://ionosphere.meteo.be/geomagnetism/K_BEL/
The SIDC Space Weather Briefing
The Space Weather Briefing presented by the forecaster on duty from May 28 to June 4. It reflects in images and graphs what is written in the Solar and Geomagnetic Activity report: https://www.stce.be/briefings/20230605_SWbriefing.pdf
If you need to access the movies, contact us: stce_coordination at stce.be
Review of Ionospheric Activity

The figure shows the time evolution of the Vertical Total Electron Content (VTEC) (in red) during the last week at three locations:
a) in the northern part of Europe(N 61deg E 5deg)
b) above Brussels(N 50.5deg, E 4.5 deg)
c) in the southern part of Europe(N 36 deg, E 5deg)
This figure also shows (in grey) the normal ionospheric behaviour expected based on the median VTEC from the 15 previous days.
The VTEC is expressed in TECu (with TECu=10^16 electrons per square meter) and is directly related to the signal propagation delay due to the ionosphere (in figure: delay on GPS L1 frequency).
The Sun's radiation ionizes the Earth's upper atmosphere, the ionosphere, located from about 60km to 1000km above the Earth's surface.The ionization process in the ionosphere produces ions and free electrons. These electrons perturb the propagation of the GNSS (Global Navigation Satellite System) signals by inducing a so-called ionospheric delay.
See http://stce.be/newsletter/GNSS_final.pdf for some more explanations ; for detailed information, see http://gnss.be/ionosphere_tutorial.php
Calendar
Check out our activity calendar: activities and encounters with the Sun-Space-Earth system and Space Weather as the main theme. We provide occasions to get submerged in our world through educational, informative and instructive activities.
If you want your event in our calendar, contact us: stce_coordination at stce.be
* June 12-14, STCE Space Weather Course for BKG, Brussels, Belgium
* June 13, CmPA Seminar: Forward Modeling of Solar Coronal Magnetic Field Diagnostics, 200B 02.18@KU Leuven and online, Leuven, Belgium
* June 29, STCE annual meeting, Brussels, Belgium
* Nov 18-19, e-SWAN Space Weather School: data, models and services, by the STCE, Toulouse, France
Check: https://www.stce.be/calendar