- Table of Content
- 1.Slowly but sur...
- 2.Review of sola...
- 3.International ...
- 4.PROBA2 Observa...
- 5.Noticeable Sol...
- 6.Geomagnetic Ob...
- 7.Review of Iono...
- 8.The SIDC Space...
- 9.STCE courses a...
2. Review of solar and geomagnetic activity
3. International Sunspot Number by SILSO
4. PROBA2 Observations
5. Noticeable Solar Events
6. Geomagnetic Observations in Belgium
7. Review of Ionospheric Activity
8. The SIDC Space Weather Briefing
9. STCE courses and lectures
Slowly but surely
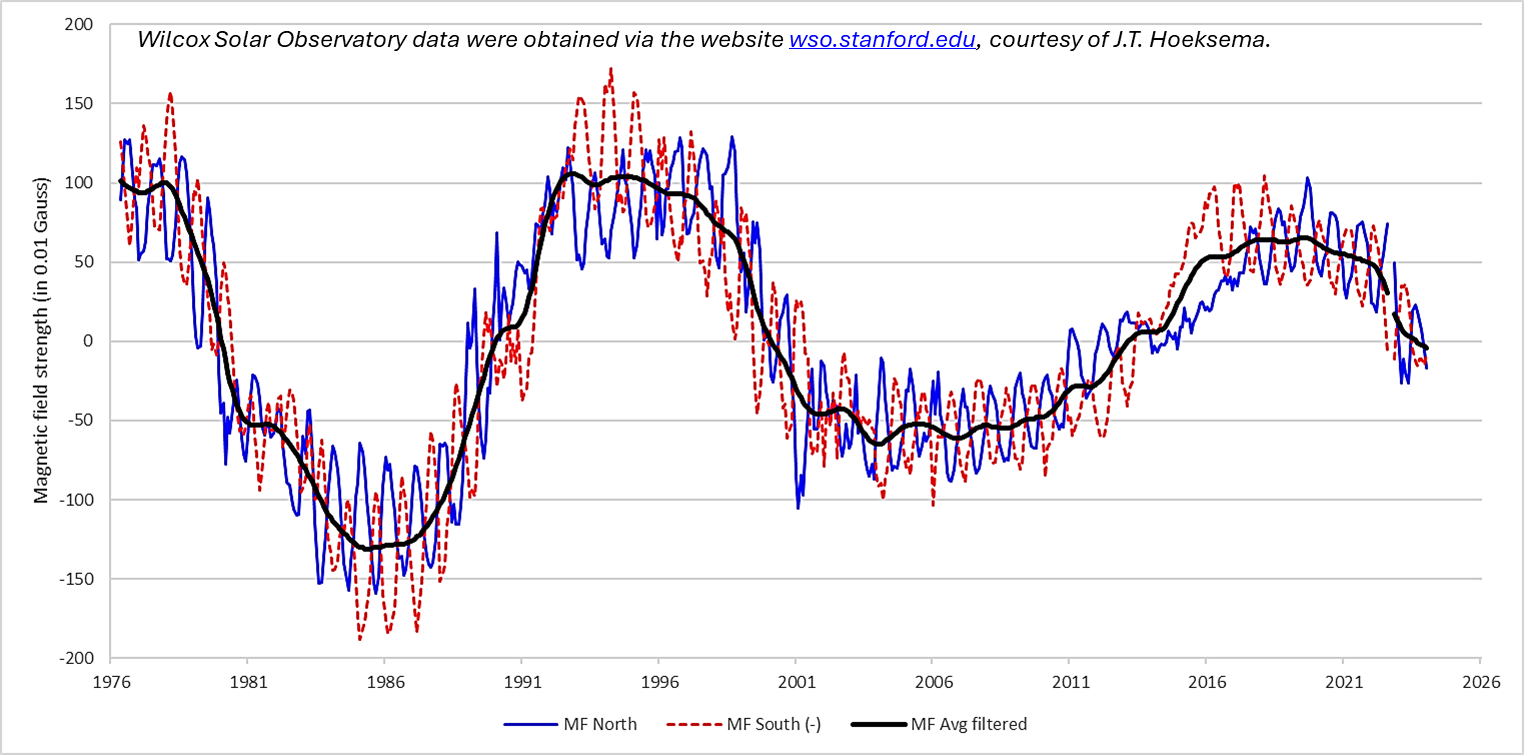
Each solar cycle, during the period of maximum activity, the magnetic field at the solar poles disappears and gets replaced by a magnetic field of opposite polarity (see e.g. this STCE newsitem at https://www.stce.be/news/664/welcome.html ). These reversals are a key feature of the solar dynamo, and may take several months and longer before they are permanently established. Recent measurements by the Wilcox Solar Observatory (WSO - http://wso.stanford.edu/ ) of the Sun's polar magnetic fields confirm that this reversal is still ongoing, with the magnetic field strengths still close to zero Gauss, i.e. they are still alternating between positive and negative values at both poles.
In the graph underneath, polar magnetic field strength (WSO) is shown per month and per solar hemisphere (solid blue: north pole, dashed red: south pole) as well as the average value (thick black line). The magnetic field strength is expressed in units of 0.01 Gauss. The ups-and-downs in the curves for the north and south polar region are due to a seasonal effect: in the course of a year, as the Earth orbits the Sun, the instruments have a better look on the Sun's southern polar region during the January-April timeframe, and a better view on the northern polar region during the July-October period. The average magnetic field strength (black curve) has been filtered such that (most of) these ups-and-downs have been removed. The graph shows that the magnetic polarity for both polar regions has already been reversed briefly, but not permanently. Based on the available data points (last 4 solar cycles), the reversal at a single pole may take 1.5 years (median), with an uncertainty of one year. In view of the different evolution of the reversals at the different poles, and because of the long time a field reversal may take, it's no surprize that for several months around solar maximum, the Sun may exhibit two poles both with the same magnetic polarity. This creates very complex magnetic structures around the Sun, which in turn affect the rest of the solar system and helps for example to further reduce access of the cosmic rays to the earth environment - see the STCE's SC25 Tracking page (https://www.stce.be/content/sc25-tracking#cosmicrays ).
When the filtered average magnetic field (black curve) reaches 0 Gauss, it usually takes another 6 months (median) before the smoothed monthly international sunspot number (ISN - SILSO - https://www.sidc.be/SILSO/home ) reaches its maximum, albeit with an uncertainty of again 12 months. The filtered average magnetic field strength switched sign in September 2023, but is currently still very near 0 Gauss. Taking into account the median delay of 6 months and the associated uncertainty, this confirms a solar cycle maximum in 2024 is very likely.
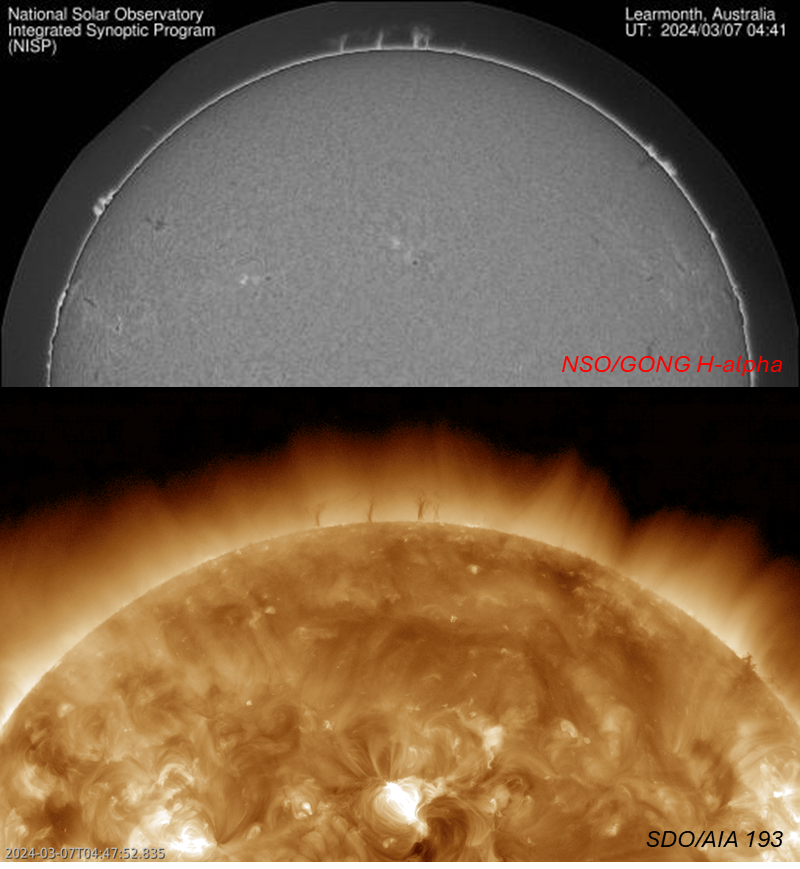
That the polar field reversal is still ongoing is also clear from other observations. For example, the new polar coronal holes are still not firmly established. Though small and medium sized coronal holes with the new magnetic field polarity (North: positive, South: negative) are appearing at medium latitudes around 50 degrees, there's nothing substantial enough yet to build these new polar coronal holes. The presence of opposite magnetic field polarities near the poles is also clear from observations in H-alpha. Prominences at very high latitudes (80 degrees or more) could be observed last week near the Sun's north pole. Solar prominences are clouds of charged particles ("plasma") above the solar surface squeezed between magnetic regions of opposite polarity. Being cooler and denser than the plasma underneath and their surroundings, they appear as dark lines when seen on the solar disk (then they are called "filaments") and as bright blobs when seen near the solar limb. Special filters are required to observe these features, and can be obtained from the NSO/GONG network (https://gong.nso.edu/ ). These prominences were also observable in the much hotter extreme ultraviolet filters, where the "cold" features contrast as dark dynamic structures against the much brighter and hotter coronal background (SDO/AIA 193 - http://sdo.gsfc.nasa.gov/data/aiahmi/ ). Imagery in H-alpha and AIA 193 for the Sun's north pole can be found underneath.
Review of solar and geomagnetic activity
WEEK 1210 from 2024 Mar 04
Solar Active Regions and flares
Over the week solar flaring activity started at low levels and then went to moderate levels towards the end, particularly on March 08 and March 10. There were 12 numbered active regions on the visible solar disc, which produced 48 C-class flares and 2 M-class flares. The strongest flare was a GOES M7.4 flare from NOAA Active Region (AR) 3599 (beta-gamma-delta) which peaked at 12:13 UTC on March 10. NOAA AR 3599 was very active and produced several C-class flares and all (2) M-class flares observed during last week.
Coronal mass ejections
Multiple corona mass ejections (CMEs), which were associated with flares, filaments, and prominence eruptions, were observed during last week. Among them, a partial halo CME associated with a filament eruption on the SE quadrant of the Sun was observed in SOHO/LASCO-C2 images at 21:24 UTC on March 5. The bulk of the mass related to this CME was going strongly southward from the Sun-Earth line, so only a glancing blow impact on Earth was expected on March 09, but it did not arrive at Earth. Two other noticeable partial halo CMEs, related to prominence eruptions on the SE and NE limbs, were observed on March 09 with no anticipated glancing blow impact on Earth.
Coronal Holes
A small equatorial (negative polarity) coronal hole (CH) crossed the central meridian on March 06. The Earth came under the influence of the high speed stream originating from this CH on March 08. Two other positive polarity CHs, a narrow CH in the northern hemisphere and another CH spanning 5 N - 20 S, started to cross the central meridian on March 09 and March 10, respectively.
Proton flux levels
The greater than 10 MeV proton flux remained below the 10 pfu threshold level over the past week.
Electron fluxes at GEO
The greater than 2 MeV electron flux was below the 1000 pfu threshold throughout the entire week. The corresponding electron fluence was at nominal levels.
Solar wind
At the start of the week, the solar wind parameters were under the influence of an interplanetary coronal mass ejection (ICME) from Feb 28. The solar wind speed increased to about 440 km/s, the North-South component of the interplanetary magnetic field (Bz) decreased to -18 nT, and the interplanetary magnetic field itself (Bt) reached 19 nT. Solar wind parameters were then under the influence of the high speed stream (HSS) from the equatorial (negative polarity) coronal hole that crossed the central meridian on March 06. Due to the HSS, the solar wind speed increased around 500 km/s, Bz decreased to -7 nT, and the Bt reached 8 nT. Solar wind conditions transitioned from a fast to a slow wind regime on March 10.
Geomagnetism
At the beginning of the week, geomagnetic conditions globally reached moderate storm conditions (Kp 6-) starting at 18:00 UTC on March 03, and locally reaching minor storm conditions (K_Bel 5). This was due to the arrival of a coronal mass ejection (CME) observed on Feb 28. For the rest of the week, geomagnetic conditions remained quiet to unsettled (NOAA Kp and K BEL 1 to 3), except for active conditions (NOAA Kp and K BEL 4) for shorter intervals on March 08 and March 09. Geomagnetic conditions were at active level due to the arrival of the high speed stream originating from the small equatorial (negative polarity) coronal hole that had crossed the central meridian on March 06.
International Sunspot Number by SILSO
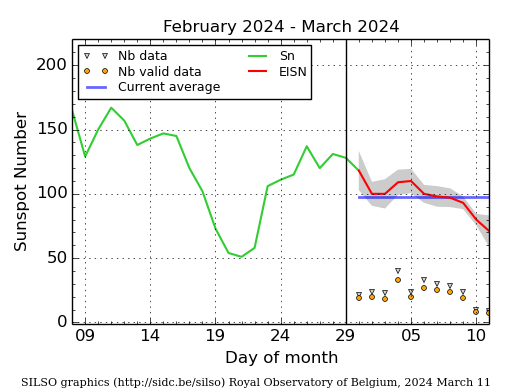
The daily Estimated International Sunspot Number (EISN, red curve with shaded error) derived by a simplified method from real-time data from the worldwide SILSO network. It extends the official Sunspot Number from the full processing of the preceding month (green line), a few days more than one solar rotation. The horizontal blue line shows the current monthly average. The yellow dots give the number of stations that provided valid data. Valid data are used to calculate the EISN. The triangle gives the number of stations providing data. When a triangle and a yellow dot coincide, it means that all the data is used to calculate the EISN of that day.
PROBA2 Observations
Solar Activity
Solar flare activity fluctuated from low and moderate during the week.
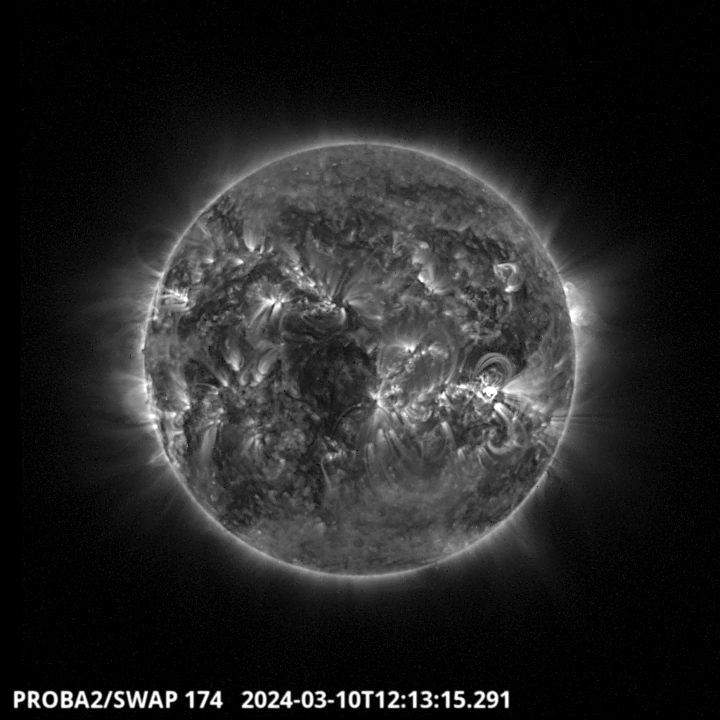
In order to view the activity of this week in more detail, we suggest to go to the following website from which all the daily (normal and difference) movies can be accessed: https://proba2.oma.be/ssa
This page also lists the recorded flaring events.
A weekly overview movie can be found here (SWAP week 728): https://proba2.sidc.be/swap/data/mpg/movies/weekly_movies/weekly_movie_2024_03_04.mp4
Details about some of this week's events can be found further below.
If any of the linked movies are unavailable they can be found in the P2SC movie repository here: https://proba2.oma.be/swap/data/mpg/movies/
Saturday Mar 09

A prominence occurred around 03:19 UT in the Southeastern quadrant of the solar disk.
Find a SWAP movie of the event here: https://proba2.sidc.be/swap/movies/20240309_swap_movie.mp4
A strong flare, a M7.4, has been produced around 12:13 UT by the active region 3599 located in the South West part of the solar disk. Find a SWAP movie of the event here: https://proba2.sidc.be/swap/movies/20240310_swap_movie.mp4
Noticeable Solar Events
| DAY | BEGIN | MAX | END | LOC | XRAY | OP | 10CM | TYPE | Cat | NOAA |
| 08 | 2118 | 2126 | 2131 | S14W15 | M1.3 | SF | 99 | 3599 | ||
| 10 | 1200 | 1213 | 1220 | M7.4 | V/3II/3 | 99 | 3599 |
| LOC: approximate heliographic location | TYPE: radio burst type |
| XRAY: X-ray flare class | Cat: Catania sunspot group number |
| OP: optical flare class | NOAA: NOAA active region number |
| 10CM: peak 10 cm radio flux |
Geomagnetic Observations in Belgium
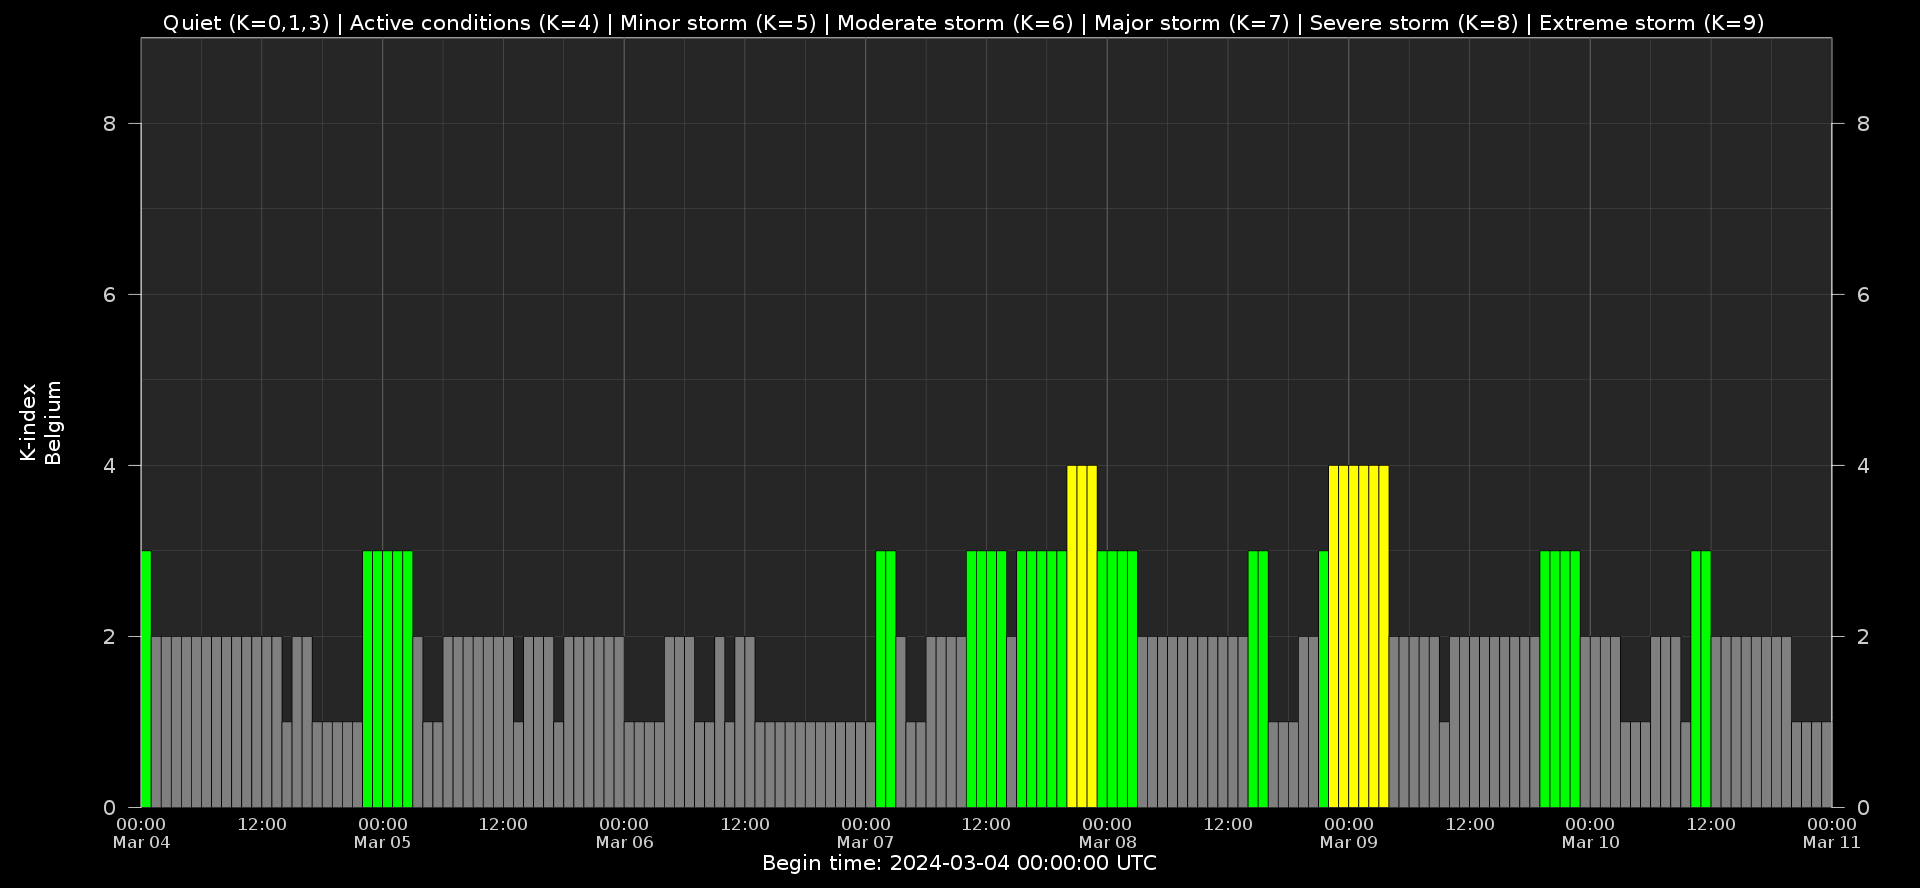
Local K-type magnetic activity index for Belgium based on data from Dourbes (DOU) and Manhay (MAB). Comparing the data from both measurement stations allows to reliably remove outliers from the magnetic data. At the same time the operational service availability is improved: whenever data from one observatory is not available, the single-station index obtained from the other can be used as a fallback system.
Both the two-station index and the single station indices are available here: http://ionosphere.meteo.be/geomagnetism/K_BEL/
Review of Ionospheric Activity
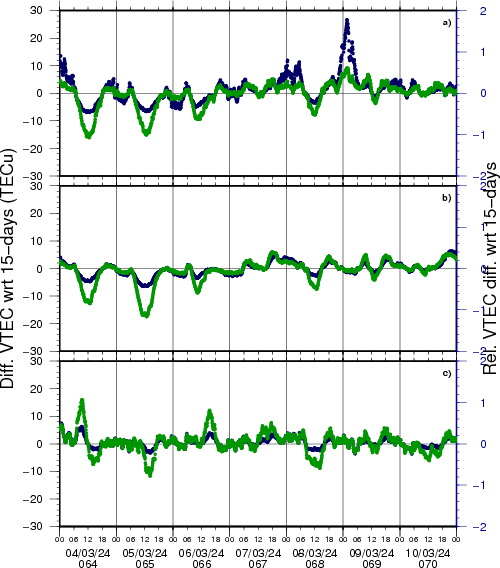
NEW! The time series below illustrates (in green) the VTEC deviation from normal quiet behaviour.
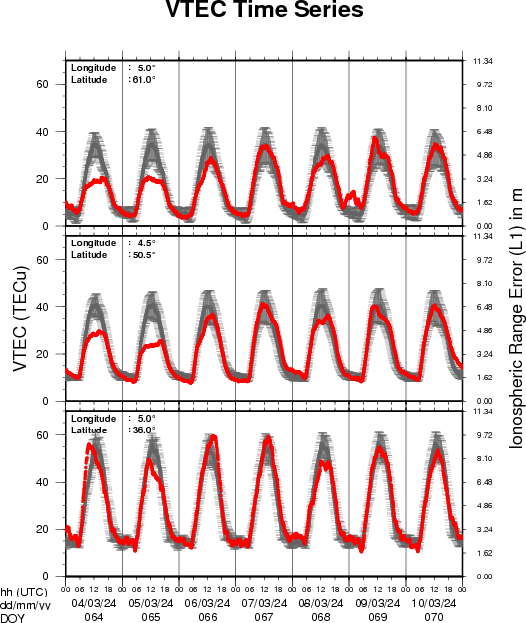
VTEC time series at 3 locations in Europe from 4 Mar 2024 till 10 Mar 2024
The top figure shows the time evolution of the Vertical Total Electron Content (VTEC) (in red) during the last week at three locations:
a) in the northern part of Europe(N 61deg E 5deg)
b) above Brussels(N 50.5deg, E 4.5 deg)
c) in the southern part of Europe(N 36 deg, E 5deg)
This top figure also shows (in grey) the normal ionospheric behaviour expected based on the median VTEC from the 15 previous days.
The time series below shows the VTEC difference (in green) and relative difference (in blue) with respect to the median of the last 15 days in the North, Mid (above Brussels) and South of Europe. It thus illustrates the VTEC deviation from normal quiet behaviour.
The VTEC is expressed in TECu (with TECu=10^16 electrons per square meter) and is directly related to the signal propagation delay due to the ionosphere (in figure: delay on GPS L1 frequency).
The Sun's radiation ionizes the Earth's upper atmosphere, the ionosphere, located from about 60km to 1000km above the Earth's surface.The ionization process in the ionosphere produces ions and free electrons. These electrons perturb the propagation of the GNSS (Global Navigation Satellite System) signals by inducing a so-called ionospheric delay.
See http://stce.be/newsletter/GNSS_final.pdf for some more explanations; for more information, see https://gnss.be/SpaceWeather
The SIDC Space Weather Briefing
The forecaster on duty presented the SIDC briefing that gives an overview of space weather from March 4 to 10. The pdf of that presentation can be found here: https://www.stce.be/briefings/20240311_SWbriefing.pdf

STCE courses and lectures
Courses and presentations with the Sun-Space-Earth system and Space Weather as the main theme. We provide occasions to get submerged in our world through educational, informative and instructive activities.
* March 26, Solar physics and Space Weather: Sunspots and Solar Radio Astronomy, online course - Registrations are open
* March 28-29, 2024, STCE Space Weather Introductory Course, focus on aviation, online - Registrations are open
* April 22-24, 2024, STCE Space Weather Introductory Course, Brussels, Belgium - Registrations are open
* April 26, Public presentation Proba-3: a solar eclipse maker, MIRA, Grimbergen
* April 30, Solar physics and Space Weather: Proba-2 and Proba-3, online course - Registrations are open
* May 3, STCE seminar An Echo of the Sun, Brussels, Belgium
* May 6, An Echo of the Sun, PhD defense Pepa Ivanova, Brussels, Belgium
* May 13, lecture by the STCE, From physics to forecasting, ESA Space Weather Training Course 2024, Euro Space Center, Redu, Belgium
* May 13 - 17, lectures by the STCE, solar and heliospheric weather; magnetosphere, ionosphere, aviation, and ground based impact, Course Operational Space Weather Fundamentals, L'Aquila, Italy
* May 18, Public presentation, The PROBA-3 Mission: Artificial Total Solar Eclipse in Space, FotonFest, Urania, Hove, Belgium
* May 28, Solar physics and Space Weather: Solar Orbiter Spacecraft, online course - Registrations are open
* June 9, Public presentation Total Eclipse of the Sun, Helios, Averbode, Belgium
* June 25, Solar physics and Space Weather: predictions and services, online course - Registrations are open
To register for a course or lecture, check the page of the STCE Space Weather Education Center: https://www.stce.be/SWEC
If you want your event in the STCE newsletter, contact us: stce_coordination at stce.be