- Table of Content
- 1.Sunspots and a...
- 2.Review of sola...
- 3.Review of sola...
- 4.International ...
- 5.Noticeable Sol...
- 6.PROBA2 Observa...
- 7.Geomagnetic Ob...
- 8.The SIDC Space...
- 9.Review of Iono...
- 10.STCE activitie...
2. Review of solar and geomagnetic activity (29 April-05 May)
3. Review of solar and geomagnetic activity (06 May-12 May)
4. International Sunspot Number by SILSO
5. Noticeable Solar Events
6. PROBA2 Observations (6 May 2024 - 12 May 2024)
7. Geomagnetic Observations in Belgium
8. The SIDC Space Weather Briefing
9. Review of Ionospheric Activity
10. STCE activities
Sunspots and aurora
Last weekend's polar lights have been witnessed by millions around the world. While many drove to dark places to watch this celestial spectacle, others grabbed a lawn chair and watched the baffling show from their own backyard. Children were woken up by their parents to watch the colours in the sky. The 10-11 May aurora certainly captured the attention and awe of the public and the media. The evolution of this impressive geomagnetic storm can be found on the dedicated STCE webpage https://www.stce.be/news/701/welcome.html
The timing of these aurora is no coincidence. Indeed, the maximum of the ongoing solar cycle 25 (SC25) is expected for the second half of this year and with smoothed monthly sunspot numbers near 140 (see the SILSO cycle forecasts at https://www.sidc.be/SILSO/forecasts ). The solar cycle is the waxing and waning of the solar activity over a period of about 11 years. This variation is best known from the rise and fall of the sunspot number. Sunspots are the dark "freckles" on the Sun, indicative of local magnetic disturbances at the solar surface. During the solar cycle maximum, there are more and more complex sunspot groups visible than during a solar cycle minimum. Such a large and complex group (NOAA 3664) developed just last week and was the source of several solar eruptions, sending magnetic clouds of charged particles to the Earth that eventually would lead to the extremely severe geomagnetic storm and aurora from 10-11 May. A description of this activity can be found on the website of the STCE at https://www.stce.be/news/700/welcome.html
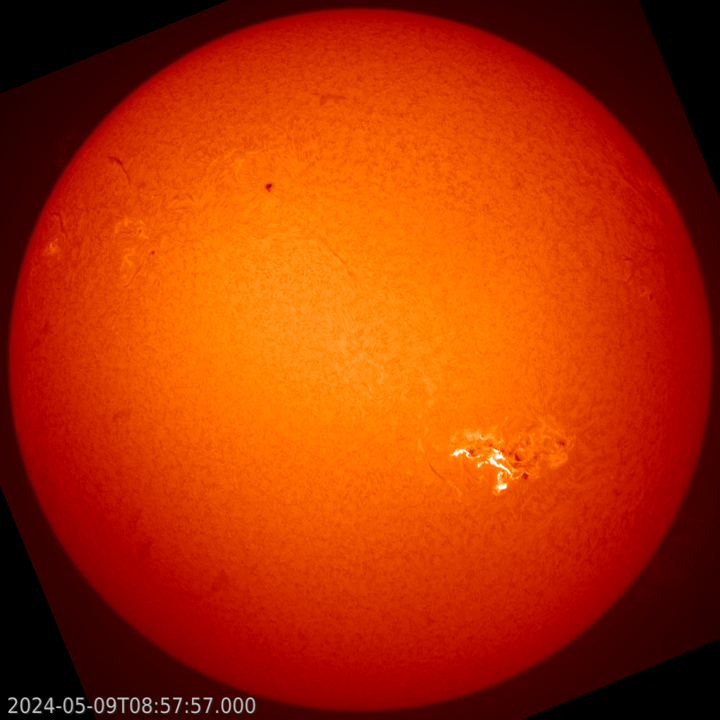
The picture above was taken by solar astronomers from SILSO on 9 May (USET - https://www.sidc.be/uset/ ). It shows a powerful eruption produced by NOAA 3664 as observed in the chromosphere, this is the inner atmosphere of the Sun. Some of the largest spots from NOAA 3664 can still be seen.
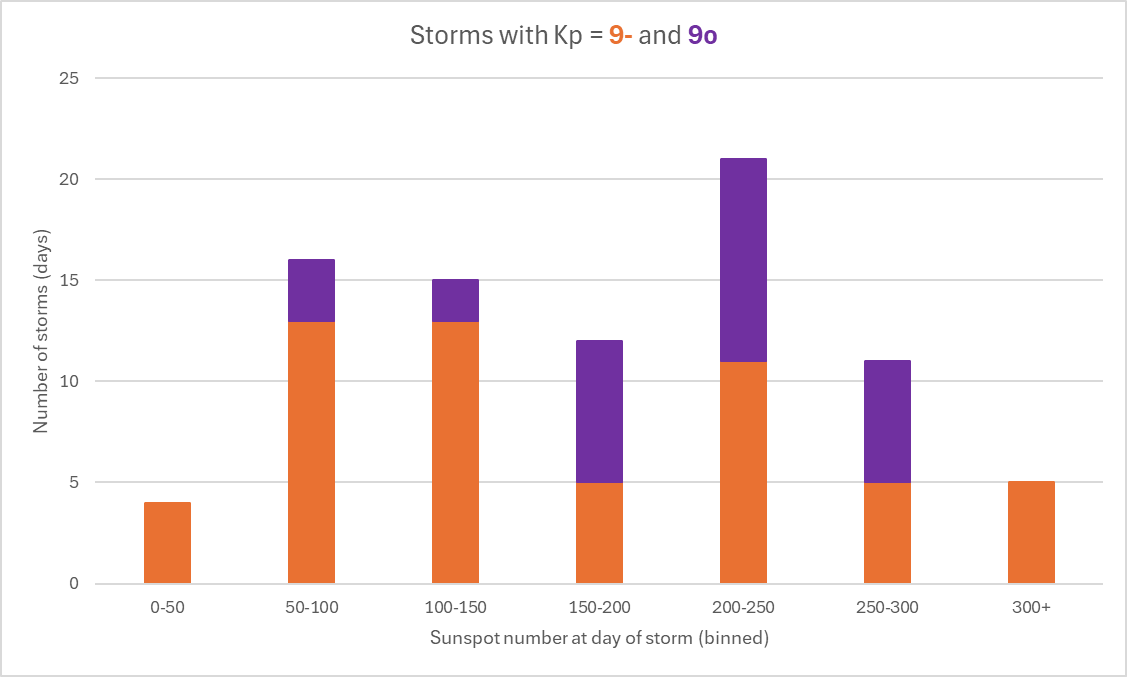
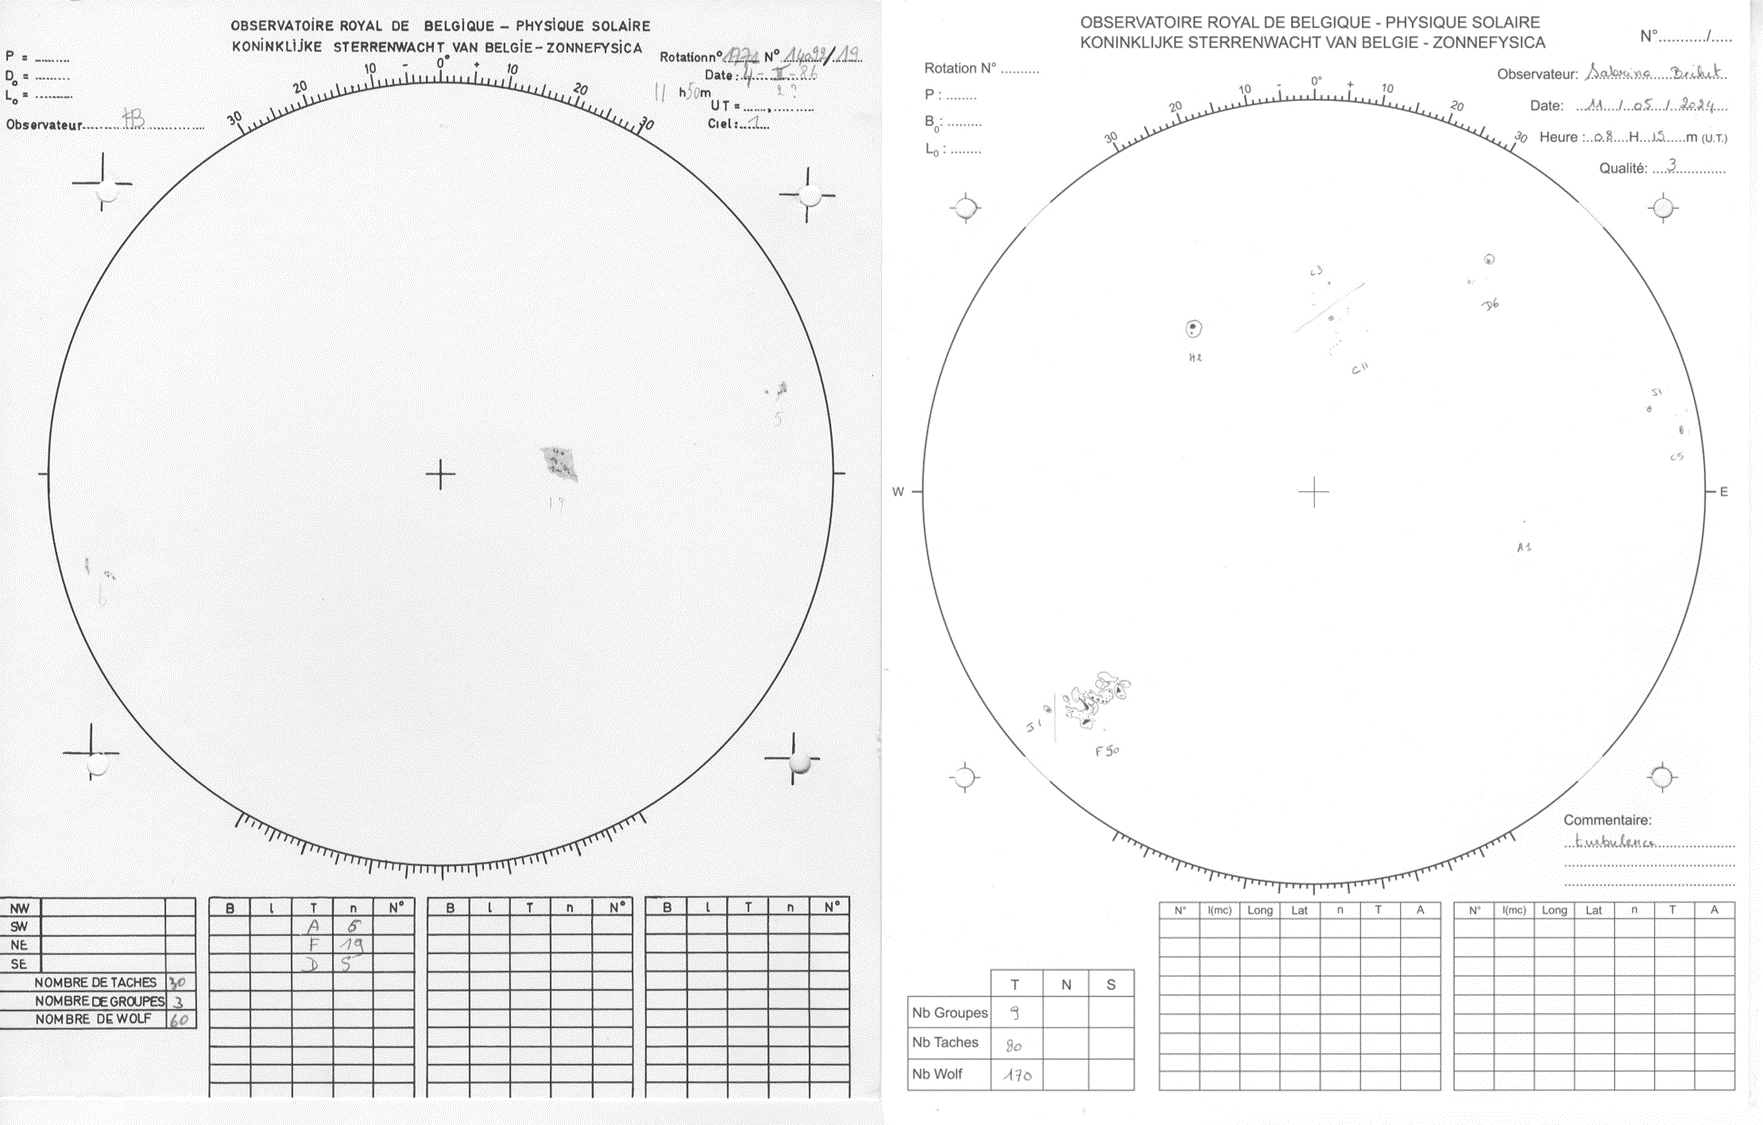
Contrary to popular belief, strong geomagnetic storms do not necessarily require high sunspot numbers. The bar diagram above shows, for the period from 1932 till present, the number of days with extreme or severe geomagnetic storming (technically, and in this article: "Kp = 9o or Kp = 9-") binned in daily sunspot numbers (per 50). As an example, there have been 21 extreme/severe storming days during which the daily sunspot number was between 200 and 250. It's clear there are also storming days when the sunspot number is much lower, e.g. 20 storms happened when the sunspot number was less than 100! An example is the 8 February 1986 extreme geomagnetic storm which happened during a solar cycle minimum with sunspot numbers only around 65! In the end, it is the presence of a well-positioned, complex, actively flaring sunspot group that determines if a geomagnetic storm will be the result. During a solar cycle maximum, such groups are of course more likely than during a solar cycle minimum, but it's not exclusive. The solar drawings underneath were made by solar observers from SILSO on 4 February 1986 (left) and 11 May 2024 (right), when the sunspot numbers were resp. 66 and 162.
Review of solar and geomagnetic activity (29 April-05 May)
WEEK 1218 from 2024 Apr 29
Solar Active Regions and flares
Solar flaring activity over the past week started at moderate levels, until May 3 when they went to high levels until the end of the week. A total of 17 active regions (ARs) were visible on the solar disk throughout the week. A total of 47 C-class flares, 26 M-class flares and 3 X-class flares were recorded, the strongest being an X1.6 flare with peak time 02:22 UTC on May 03 associated with NOAA AR 3663. Throughout the week, most of the flaring activity came from NOAA AR 3654, 3663 and 3364, with all of the X-class flares coming from NOAA AR 3663.
Coronal mass ejections
Four notable coronal mass ejections (CMEs) were observed over the course of the week. The first was a north-west directed CME, detected in LASCO C2 data on April 29 at 12:36 UTC and associated with NOAA AR 3654. This CME probably impacted the Earth on May 02. The second was a westward directed CME, detected in LASCO C2 data on May 01 at 06:36 UTC and associated with NOAA AR 3654. This CME probably impacted the Earth on May 05. The third was a north-east directed partial halo CME, detected in LASCO C2 data on May 03 at 03:01 UTC and associated with NOAA AR 3663 and a X1.6 flare. This CME probably arrived on May 05 or 06. The fourth was a north-east directed CME detected in LASCO C2 data on May 04 at 21:17 UTC.
Coronal Holes
At the start of the week, the Earth was under the influence of a high-speed stream (HSS) from a small positive polarity coronal hole and a large negative polarity coronal hole stretching from the north pole to the equator. The negative polarity coronal hole then broke up into two smaller coronal holes. The Earth may have come under the influence of a high-speed stream from one of these coronal holes on May 03. Three more small positive polarity coronal holes rotated on disk throughout the week. A high-speed stream from one of these coronal holes may have influenced the earth environment on May 05.
Proton flux levels
The 10 MeV proton flux was at nominal levels throughout the week.
Electron fluxes at GEO
The greater than 2 MeV electron flux measured by GOES-16 was at background levels throughout the week. The 24h electron fluence was at nominal levels throughout the week.
Solar wind
At the start of the week, the solar wind conditions were enhanced under the influence of a high-speed stream. After returning to slow solar wind conditions, they became enhanced again on April 30th due to the arrival of an ICME and then the solar wind conditions became enhanced again due to the arrival of an ICME on May 02 and the influence of a HSS, with the Bz reaching a minimum of -19 nT. At the end of the week on May 05, the solar wind conditions were disturbed due to the possible arrival of 2 ICMEs and a high-speed stream. Throughout the week, the solar wind speed varied between 304 and 536 km/s. The interplanetary magnetic field varied between 0 nT and 21 nT, with the Bz reaching a minimum value of -19 nT. The phi-angle was mainly in the positive sector (directed away from the Sun) with periods in the negative sector.
Geomagnetism
The geomagnetic conditions over the past week were quiet to unsettled. Active conditions globally (Kp 4) and minor storm conditions locally (K_BEL 5) were reached on April 30 in response to the perturbed solar wind associated with the passage of an ICME. Major storm conditions globally (Kp 7-) and moderate storm conditions locally (K_Bel 6) were reached on May 02 in response to the perturbed solar wind associated with the passage of another ICME.
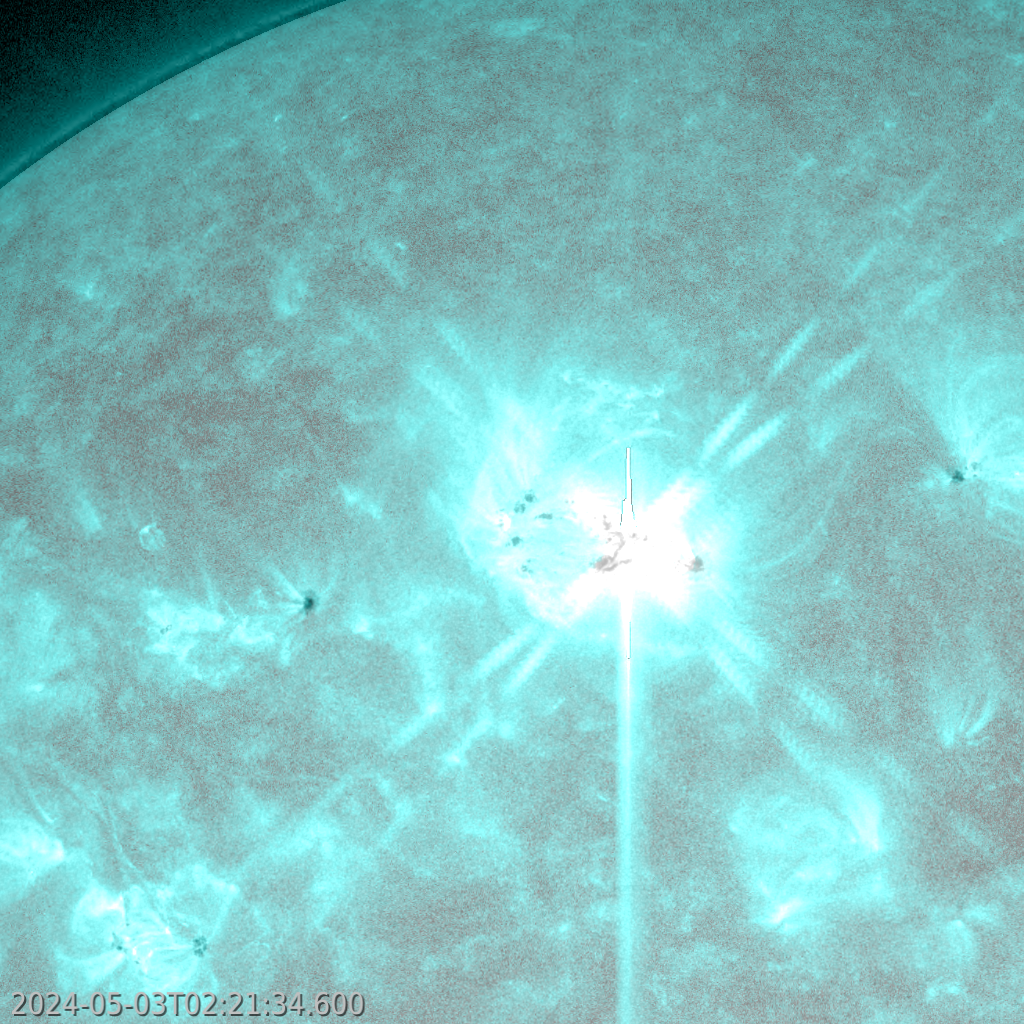
The image underneath is an overlay of extreme ultraviolet image (SDO/AIA 131) over white light image, clearly showing the location of the X1.6 flare (May 03) over the delta structure of NOAA 3663.
Review of solar and geomagnetic activity (06 May-12 May)
WEEK 1219 from 2024 May 06
Solar Active Regions (ARs) and flares
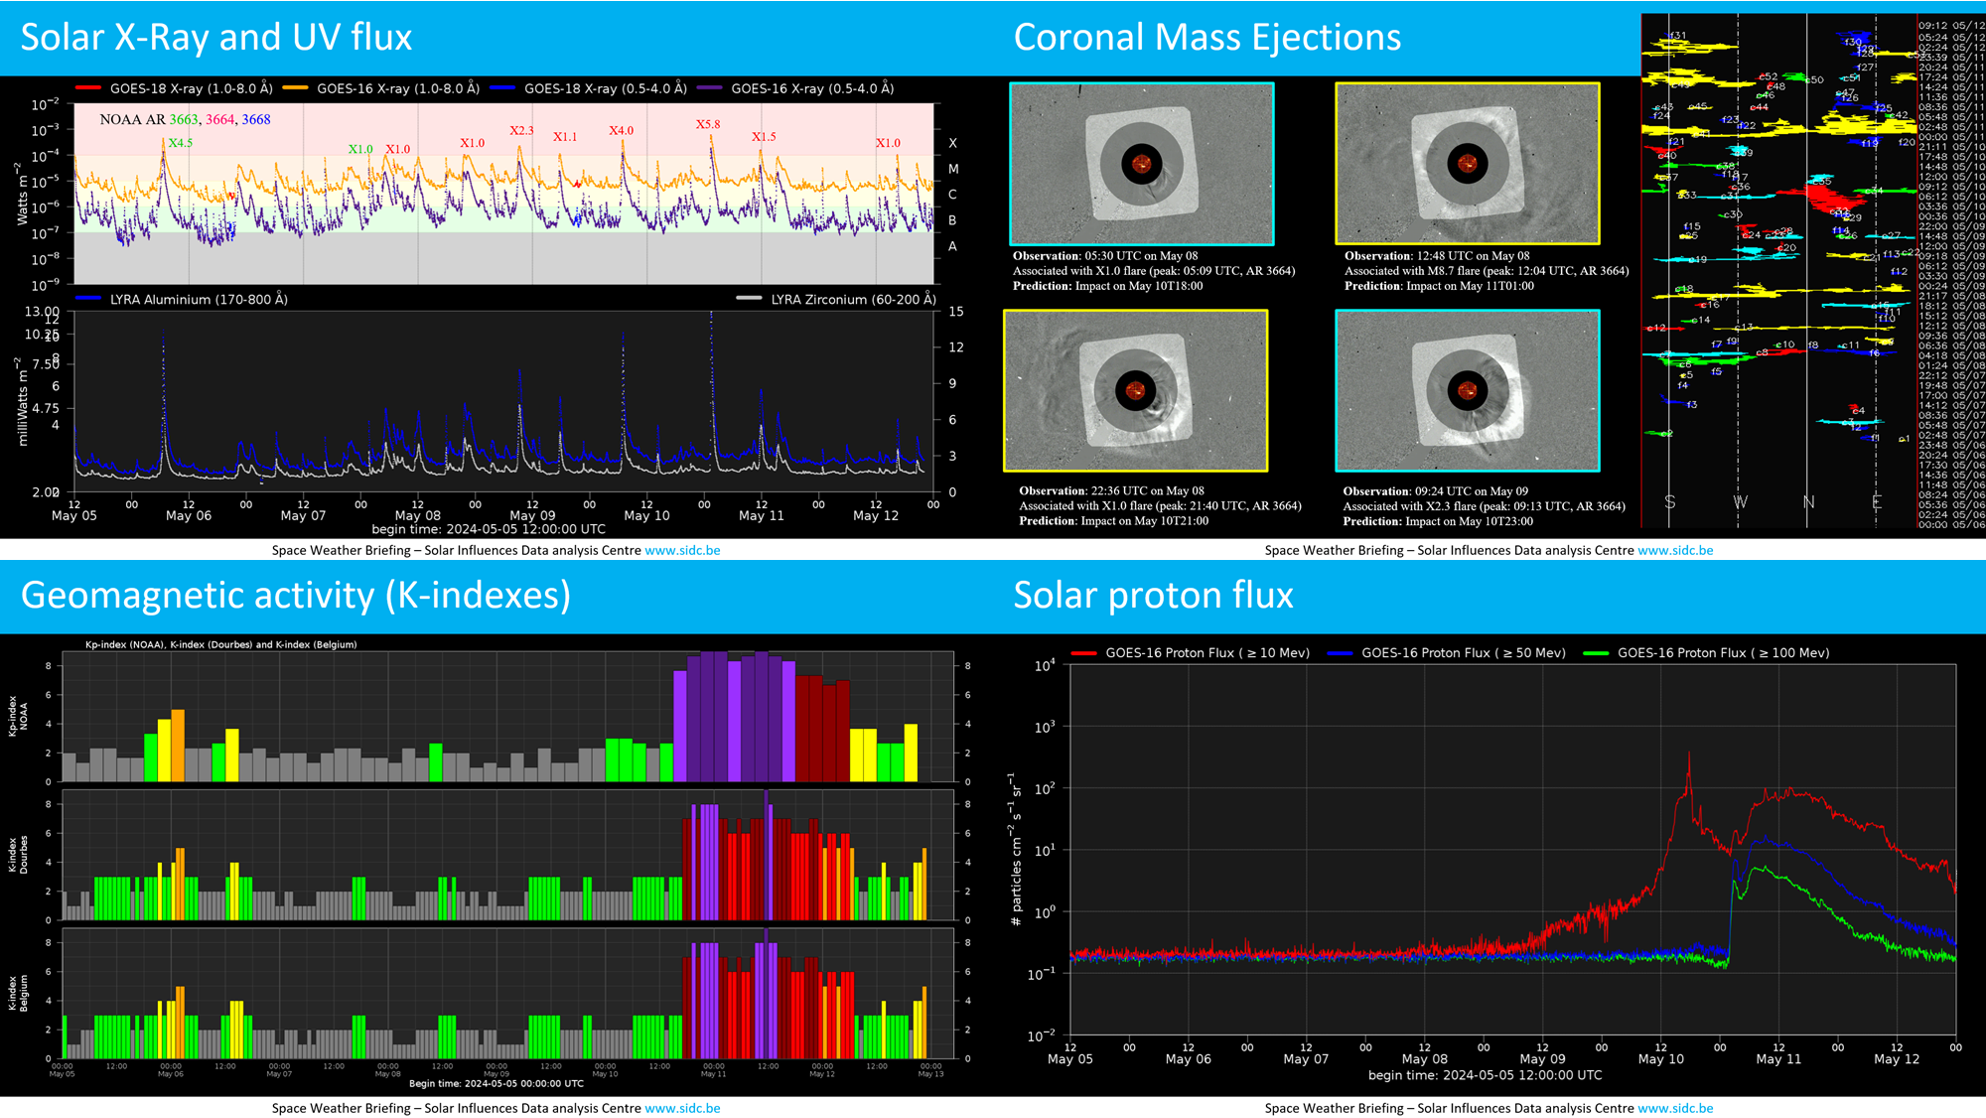
The solar flaring activity was at high to very high levels with several M-class flares and X-class flares over the past week. There were 16 numbered active regions on the visible solar disk throughout the week, which produced 49 C-class flares, 75 M-class flares, and 10 X-class flares. The strongest flare was a GOES X5.8 flare from NOAA Active Regions (AR) 3664 (beta-gamma-delta) which peaked at 01:23 UTC on May 11. NOAA AR 3663 (beta-gamma-delta), AR 3664 (beta-gamma-delta), and AR 3668 (beta-gamma) were the magnetically complex regions which produced almost all flaring activities.
Coronal mass ejections
During the past week, eight notable coronal mass ejections (CMEs) were observed. Among these, two were halo CMEs and six were partial halo CMEs. All these CMEs were associated with X-class/M-class flares from the NOAA active region (AR) 3664.
- First halo CME was observed on SOHO/LASCO-C2 images 05:30 UTC on May 08, with a speed of about 530 km/s. This halo CME was associated with an X1.0 flare which peaked at 05:09 UTC, and associated type II and type IV radio emissions were observed starting at 05:01 UTC and 05:08 UTC, respectively.
- The second halo CME was observed on LASCO-C2 images around 12:48 UTC on May 08, with a speed of about 670 km/s. This halo CME was associated with a M8.7 flare which peaked at 12:04 UTC.
- The first partial halo CME was observed on LASCO-C2 images around 22:36 UTC on May 08. This CME was associated with a X1.0 flare which peaked at 21:40 UTC. It had a projected width of about 184 degrees (as measured by the Cactus tool) and a speed of about 840 km/s.
- The second partial halo CME was observed on LASCO-C2 images around 09:24 UTC on May 09. This CME was associated with an X2.3 flare which peaked at 09:13 UTC. It had a projected width of about 180 degrees and a projected speed of about 1000 km/s. Associated type II and type IV radio emissions were detected at 09:02 UTC and 09:10 UTC, respectively.
All the above mentioned halo and partial halo CMEs possibly arrived at Earth on May 10-11.
- The third partial halo CME was first observed on LASCO-C2 images around 18:58 UTC (with data gap before in LASCO-C2 images) on May 09, with a speed of about 800 km/s. This CME was associated with an X1.1 flare which peaked at 17:44 UTC, and associated type II and type IV radio emissions were detected at 17:32 UTC and 17:45 UTC, respectively.
- The fourth partial halo CME was observed on LASCO-C2 images around 07:12 UTC on May 10, with a speed of about 950 km/s. This CME was associated with a X4.0 flare which peaked at 06:54 UTC. Associated type II and type IV radio emissions were detected at 06:46 UTC and 06:51 UTC, respectively. The third and fourth partial halo CMEs possibly arrived at Earth on May 11-12.
- The fifth bright partial halo CME was observed on LASCO-C2 images around 01:36 UTC on May 11. This CME was associated with an X5.8 flare which peaked at 01:23 UTC. Associated type II and type IV radio emissions were detected at 01:13 UTC and 01:24 UTC, respectively. This CME had a speed of about 1050 km/s which possibly arrived at Earth on May 12.
- Another possibly partial halo CME was observed in LASCO-C2 images around 02:00 UTC on May 12 with a speed of about 600 km/s, which was possibly associated with a filament eruption on the southeast quadrant of the Sun.
Coronal Holes
Two coronal holes (CH) have crossed the central meridian during the past week. The first one was a positive polarity, equatorial, north CH. The second one was a negative polarity, mid-latitude, south CH. Both CHs crossed the central meridian on May 10, and the associated high speed stream possibly started to enhance the earth environment on May 11.
Proton flux levels
The greater than 10 MeV GOES proton flux was below the 10 pfu threshold level at the beginning of the week. It started to increase around 11:00 UTC on May 09, associated with coronal mass ejections and flaring activities from NOAA AR 3664, and crossed the 10 pfu threshold level around 13:30 UTC on May 10. It briefly dropped below the 10 pfu threshold level from 01:10 UTC to 02:10 UTC on May 11 before increasing again from 02:10 UTC on May 11 and dropping below the threshold level at 12:45 UTC on May 12. The greater than 50 MeV GOES proton flux began to increase from 01:40 UTC on May 11, crossed the 10 pfu threshold level at 05:50 UTC on May 11, and dropped below the threshold level around 17:00 UTC on May 11. The greater than 100 MeV GOES proton flux also started to enhance from 01:40 UTC on May 11 but it remained below the 10 pfu threshold throughout the week. By the end of the week, all three proton fluxes (greater than 10 MeV, greater than 50 MeV, and greater than 100 MeV) were below the 10 pfu threshold level and decreasing.
Electron fluxes at GEO
The greater than 2 MeV electron flux, as measured by the GOES-16 satellite, was below the threshold level during the past week. The 24h electron fluence was at normal levels during the past week.
Solar wind
- At the beginning of the past week, the solar wind parameters were disturbed due to the influence of interplanetary coronal mass ejections (ICME) associated with CMEs observed on May 01-03, as well as high speed streams (HSS) originating from three positive polarity coronal holes (CH) that crossed the central meridian during May 02-04. The solar wind speed increased to values as high as 560 km/s, the strength of the interplanetary magnetic field (IMF) reached 16 nT, and North-South component (Bz) decreased to as low as -12 nT following the arrival of ICME and HSS. The solar wind speed decreased to 400 km/s on May 10 noon just before the arrival of strongest ICME.
- Earth came under the influence of strongest ICMEs in 20 years on the evening of May 10. The first shock was detected in the solar wind data around 16:42 UTC on May 10. The strength of the IMF jumped from 4 nT to 44 nT, the solar wind speed jumped from 460 km/s to 700 km/s and the solar wind density at the shock increased from 5/cm3 to 30/cm3. The second shock was observed around 21:39 UTC on May 10. The solar wind speed increased to values as high as 800 km/s, the strength of the IMF peaked at 74 nT, and the Bz component decreased to values as low as -50 nT. These two shocks were related to the CMEs observed during May 08-09, and possibly two to four associated ICMEs arrived at Earth during May 10-11.
- The third shock-like structure was detected in the solar wind data around 17:55 UTC on May 11. The strength of the IMF jumped from 8 nT to 47 nT, the solar wind speed jumped from 800 km/s to 895 km/s. The fourth shock-like structure was detected around 08:59 UTC on May 12. The interplanetary magnetic field jumped from 5 nT to 12 nT, the solar wind speed jumped from 830 km/s to 900 km/s. The fifth shock-like structure was observed at 08:58 UTC on May 12, during which the speed increased from 830 km/s to 850 km/s and the strength of the IMF increased from 5 nT to 12 nT. These three shock-like structures were probably related to the arrival of ICMEs associated with CMEs observed during May 09-11.
- HSS originating from two CHs, which crossed the central meridian from May 08 onwards, also possibly started to arrive at Earth on May 11. With the arrival of multiple ICMEs and HSS, the solar wind speed increased to values as high as about 1000 km/s. By the end of the week, the solar wind speed was about 830 km/s and the strength of the IMF had returned to more stable values below 5 nT.
Geomagnetism
- At the beginning of the past week, geomagnetic conditions were globally and locally at quiet to minor storm conditions (NOAA Kp and K BEL 2 to 5). It increased from quiet to minor storm conditions between 18:00 UTC on May 05 and 03:00 UTC on May 06. This could be possibly initially due to the arrival of coronal mass ejections (CME), which were observed during May 01-03, and later due to the arrival of high speed streams (HSS) originating from three positive polarity coronal holes (CHs) which crossed the central meridian during May 02-04. From the evening of May 06 until the evening of May 10, geomagnetic conditions were at quiet to unsettled levels (NOAA Kp and K BEL 2 to 3) both globally and locally.
- Geomagnetic conditions were globally at severe to extreme storm levels (NOAA Kp 8 to 9) from 15:00 UTC on May 10 to 16:00 UTC on May 11, and then remained at major storm levels until the end of the past week. Locally over Belgium, geomagnetic conditions were at severe storm levels (K BEL=8) from 17:00 UTC on May 10 to 01:00 UTC on May 11 and again from 09:00 UTC to 14:00 UTC on May 12, reaching the extreme storm levels (K BEL=9) from 11:00 UTC to 12:00 UTC on May 12. This was due to the arrival of multiple CMEs observed during May 08-11, as well the arrival of HSS originating from coronal holes that started to cross the central meridian on May 08. At the end of the week, geomagnetic conditions were at active levels (K BEL=4) locally over Belgium.
Note
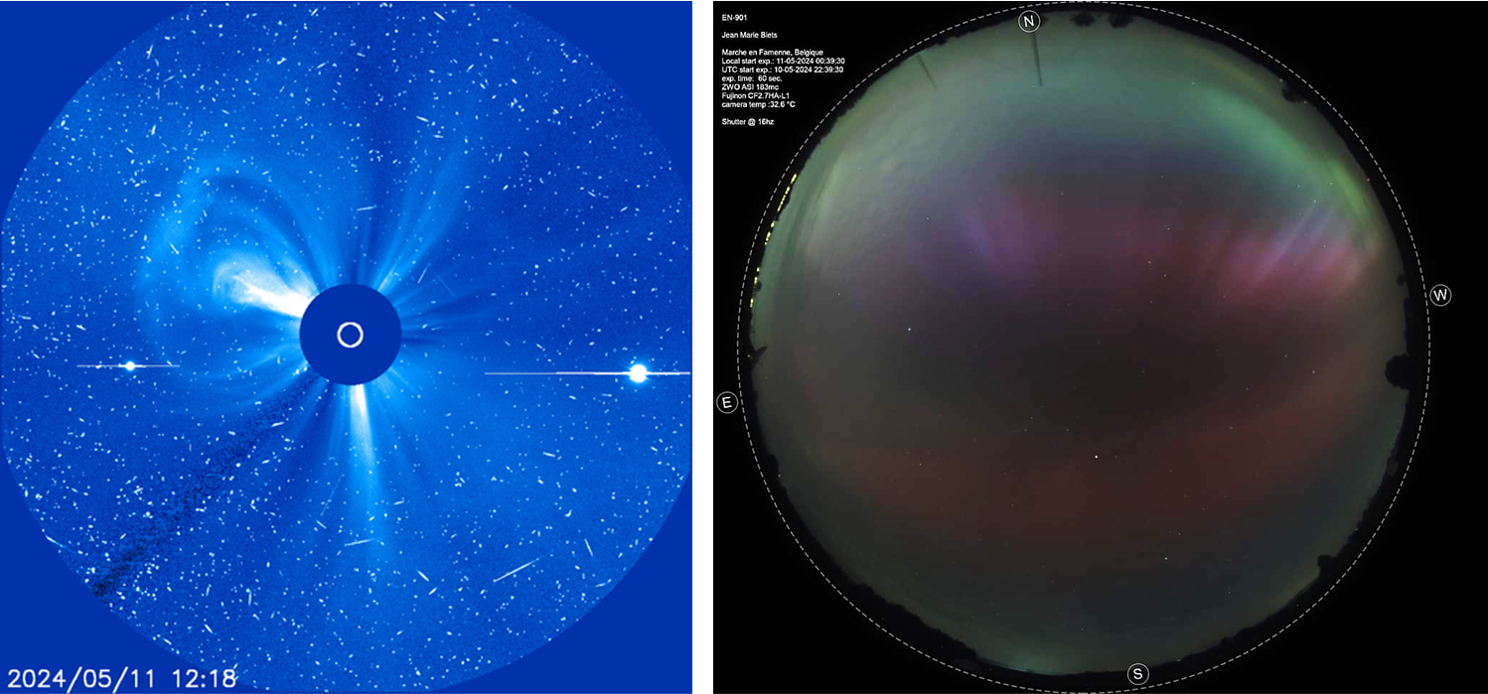
The STCE maintained 2 dedicated webpages to follow resp. the evolution of the solar activity (https://www.stce.be/news/700/welcome.html) and the geomagnetic storm of 10-11 May (https://www.stce.be/news/701/welcome.html ). The left image underneath shows a coronagraphic image by SOHO/LASCO C2 on 12 May during the ongoing proton event ("noise" in the image). The CME to the upper left is unrelated to NOAA 3664 activity, and the two bright spots are the planets Jupiter (left) and Venus (right). The image to the right is a 60-seconds exposure with an all-sky camerea taken by Jean-Marie Biets from Marche-en-Famenne, not far from the Humain Radioastronomy Station, at 22:40 UTC on 10 May. At that time, the geomagnetic storm was globally at extremely severe levels. It shows the pinkish-bluish-greenish hues of the aurora, and the faint orange glow of the Stable Auroral Red arc (SAR - https://www.stce.be/news/673/welcome.html ).
International Sunspot Number by SILSO
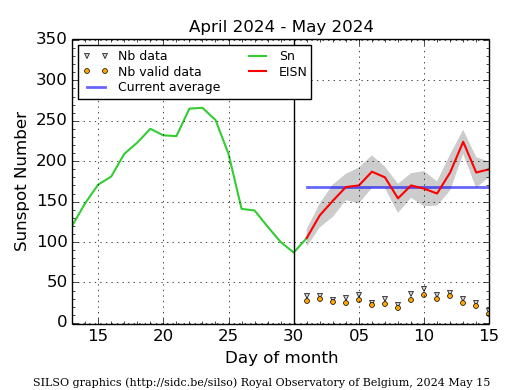
The daily Estimated International Sunspot Number (EISN, red curve with shaded error) derived by a simplified method from real-time data from the worldwide SILSO network. It extends the official Sunspot Number from the full processing of the preceding month (green line), a few days more than one solar rotation. The horizontal blue line shows the current monthly average. The yellow dots give the number of stations that provided valid data. Valid data are used to calculate the EISN. The triangle gives the number of stations providing data. When a triangle and a yellow dot coincide, it means that all the data is used to calculate the EISN of that day.
Noticeable Solar Events
| DAY | BEGIN | MAX | END | LOC | XRAY | OP | 10CM | TYPE | Cat | NOAA |
| 06 | 0047 | 0106 | 0114 | N24W32 | M1.6 | 2F | 84 | 3663 | ||
| 06 | 0509 | 0528 | 0538 | M1.3 | III/1 | 84 | 3663 | |||
| 06 | 0538 | 0635 | 0647 | N24W32 | X4.5 | 3B | VI/1III/1 | 84 | 3663 | |
| 06 | 0949 | 0959 | 1004 | M1.5 | 84 | 3663 | ||||
| 06 | 2137 | 2148 | 2158 | N25W42 | M1.2 | 2N | 84 | 3663 | ||
| 06 | 2158 | 2227 | 2307 | M4.3 | 84 | 3663 | ||||
| 07 | 0041 | 0058 | 0123 | N27W40 | M2.6 | SF | VI/1 | 84 | 3663 | |
| 07 | 0558 | 0616 | 0627 | M5.1 | 84 | 3663 | ||||
| 07 | 0818 | 0823 | 0840 | S19E6 | M1.3 | SN | 86 | 3664 | ||
| 07 | 1140 | 1150 | 1201 | S18E3 | M2.4 | 2N | 86 | 3664 | ||
| 07 | 1243 | 1254 | 1259 | N27W53 | M1.5 | SF | III/1 | 84 | 3663 | |
| 07 | 1316 | 1325 | 1332 | M1.0 | /1 | 84 | 3663 | |||
| 07 | 1332 | 1335 | 1339 | M1.0 | 36M/1I/1 | 86 | 3664 | |||
| 07 | 1621 | 1630 | 1636 | M8.2 | /2M/1I/136 | 84 | 3663 | |||
| 07 | 1958 | 2022 | 2034 | M2.1 | 86 | 3664 | ||||
| 07 | 2113 | 2126 | 2142 | M3.3 | 84 | 3663 | ||||
| 07 | 2142 | 2153 | 2208 | M3.2 | 84 | 3663 | ||||
| 08 | 0133 | 0141 | 0148 | X1.0 | B | 84 | 3663 | |||
| 08 | 0216 | 0227 | 0236 | M3.4 | 86 | 3664 | ||||
| 08 | 0319 | 0327 | 0338 | M1.8 | II/1 | 86 | 3664 | |||
| 08 | 0437 | 0509 | 0532 | X1.0 | B | II/2I/2I/3 8V/2 | 86 | 3664 | ||
| 08 | 0644 | 0653 | 0703 | M7.1 | 86 | 3664 | ||||
| 08 | 0729 | 0741 | 0753 | M4.5 | F | 84 | 3663 | |||
| 08 | 0931 | 0937 | 0942 | M1.8 | V/1 | 84 | 3663 | |||
| 08 | 0943 | 0948 | 0956 | M2.1 | F | 84 | 3663 | |||
| 08 | 1109 | 1122 | 1126 | M4.1 | F | I/2 | 84 | 3663 | ||
| 08 | 1126 | 1204 | 1217 | M8.6 | ||||||
| 08 | 1732 | 1753 | 1800 | M7.9 | N | I/3 | 86 | 3664 | ||
| 08 | 1814 | 1836 | 1851 | M2.9 | F | II/3 | 84 | 3663 | ||
| 08 | 1915 | 1921 | 1929 | M2.0 | 86 | 3664 | ||||
| 08 | 2027 | 2034 | 2039 | M1.7 | 86 | 3664 | ||||
| 08 | 2108 | 2140 | 0307 | X1.0 | I/2V/3 | 86 | 3664 | |||
| 08 | 2205 | 2227 | 2312 | M9.8 | I/2V/3 | 86 | 3664 | |||
| 09 | 0307 | 0317 | 0323 | M4.0 | B | 86 | 3664 | |||
| 09 | 0323 | 0332 | 0345 | M4.5 | B | 86 | 3664 | |||
| 09 | 0444 | 0449 | 0455 | M1.7 | F | 86 | 3664 | |||
| 09 | 0603 | 0613 | 0624 | M2.3 | 86 | 3664 | ||||
| 09 | 0830 | 0840 | 0845 | M2.1 | ||||||
| 09 | 0845 | 0913 | 0936 | X2.2 | B | I/2 1V/3 | 86 | 3664 | ||
| 09 | 1152 | 1156 | 1202 | M3.1 | II/3 | 86 | 3664 | |||
| 09 | 1205 | 1212 | 1220 | M2.9 | 86 | 3664 | ||||
| 09 | 1316 | 1323 | 1329 | M3.7 | N | 86 | 3664 | |||
| 09 | 1723 | 1744 | 1800 | S14W28 | X1.1 | 2B | IV/2 | 86 | 3664 | |
| 09 | 2115 | 2121 | 2125 | N28W88 | M1.0 | SF | 84 | 3663 | ||
| 09 | 2208 | 2215 | 2224 | M1.0 | ||||||
| 09 | 2224 | 2241 | 2247 | M2.6 | ||||||
| 09 | 2304 | 2308 | 2313 | S17W43 | M1.2 | SF | CTM/1 | 86 | 3664 | |
| 09 | 2344 | 2351 | 2355 | M1.5 | VI/2 | 86 | 3664 | |||
| 10 | 0010 | 0013 | 0022 | M1.3 | 86 | 3664 | ||||
| 10 | 0315 | 0329 | 0340 | M1.4 | 86 | 3664 | ||||
| 10 | 0614 | 0624 | 0627 | M1.3 | III/2II/2 | |||||
| 10 | 0627 | 0654 | 0706 | X3.9 | III/2II/3IV/2 | 86 | 3664 | |||
| 10 | 1010 | 1014 | 1019 | M2.2 | 86 | 3664 | ||||
| 10 | 1358 | 1411 | 1423 | S14W39 | M5.9 | 1N | III/2 | 86 | 3664 | |
| 10 | 1826 | 1832 | 1838 | M1.1 | 86 | 3664 | ||||
| 10 | 1838 | 1848 | 1857 | S16W44 | M1.7 | 1F | VI/2 | 86 | 3664 | |
| 10 | 1857 | 1905 | 1910 | M2.0 | 86 | 3664 | ||||
| 10 | 1935 | 1953 | 1956 | M1.1 | 86 | 3664 | ||||
| 10 | 1956 | 2003 | 2018 | M1.9 | 86 | 3664 | ||||
| 11 | 0110 | 0123 | 0139 | S15W45 | X5.8 | 2B | VI/3IV/2II/3 | 86 | 3664 | |
| 10 | 2059 | 2108 | 2112 | M3.8 | 86 | 3664 | ||||
| 11 | 1003 | 1018 | 1034 | M3.1 | 86 | 3664 | ||||
| 11 | 1053 | 1056 | 1100 | M1.6 | 86 | 3664 | ||||
| 11 | 1115 | 1144 | 1205 | S22W44 | X1.5 | 2B | 86 | 3664 | ||
| 11 | 1345 | 1349 | 1408 | S18W52 | M1.7 | 1N | 86 | 3664 | ||
| 11 | 1446 | 1525 | 1552 | S15W49 | M8.8 | 2N | III/2VI/1 | 86 | 3664 | |
| 11 | 2032 | 2041 | 2047 | M1.2 | 86 | 3664 | ||||
| 12 | 0041 | 0045 | 0052 | S20W68 | M3.2 | SF | IV/1 | 86 | 3664 | |
| 12 | 0537 | 0552 | 0606 | S20W65 | M2.4 | SF | 86 | 3664 | ||
| 12 | 1227 | 1241 | 1254 | S9E78 | M1.6 | SF | VI/1 | 86 | 3664 | |
| 12 | 1340 | 1347 | 1349 | S9E78 | M1.0 | SF | 3679 | |||
| 12 | 1349 | 1356 | 1408 | S21W70 | M1.5 | SF | 86 | 3664 | ||
| 12 | 1611 | 1626 | 1638 | S18W72 | X1.0 | 1F | 86 | 3664 | ||
| 12 | 2017 | 2032 | 2049 | S18W74 | M4.8 | SN | III/2VI/1 | 86 | 3664 | |
| 12 | 2201 | 2206 | 2212 | S16W80 | M1.1 | SF | VI/1 | 86 | 3664 | |
| 12 | 2214 | 2218 | 2224 | S21E11 | M1.1 | SF | 3676 | |||
| 12 | 2300 | 2310 | 2314 | S18W77 | M1.0 | SF | III/1VI/1 | 86 | 3664 |
| LOC: approximate heliographic location | TYPE: radio burst type |
| XRAY: X-ray flare class | Cat: Catania sunspot group number |
| OP: optical flare class | NOAA: NOAA active region number |
| 10CM: peak 10 cm radio flux |
PROBA2 Observations (6 May 2024 - 12 May 2024)
Solar Activity
Solar flare activity fluctuated from moderate to very high during the week.
In order to view the activity of this week in more detail, we suggest to go to the following website from which all the daily (normal and difference) movies can be accessed: https://proba2.oma.be/ssa
This page also lists the recorded flaring events.
A weekly overview movie can be found here (SWAP week 737). https://proba2.sidc.be/swap/data/mpg/movies/weekly_movies/weekly_movie_2024_05_06.mp4
Details about some of this week�s events can be found further below.
If any of the linked movies are unavailable they can be found in the P2SC movie repository her https://proba2.sidc.be/swap/data/mpg/movies/
Throughout the week, there was a notable surge in solar activity, marked by an exceptional number of
flares and CMEs. Multiple X-class flares, predominantly originating from two significant active regions
identified as AR 3663 and 3664, garnered considerable attention from the astronomical community.
They caused the geomagnetic storm that produced the auroras observed all over the country. Such a
sequence of solar flares had not been observed since the noteworthy Halloween storm of 2003. The
week was also marked by the most powerful solar flare recorded since 2017.
Saturday May 11

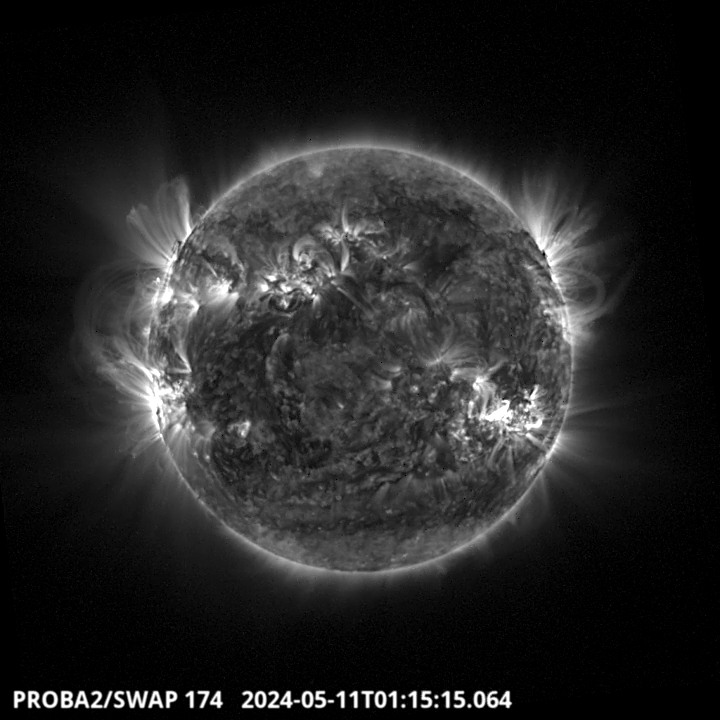
One of the highest flares of the cycle 25, a X5.8, has been recorded by LYRA and SWAP around 1:15 am.
It has been produced by the active region 3664 located on the South West part of the solar disk.
A halo coronal mass ejection (CME) was also observed on SOHO/LASCO-C2. The corresponding
interplanetary coronal mass ejections impacted the Earth on the evening of May 12. Auroras have been
visible until Belgium and France latitudes.
Geomagnetic Observations in Belgium

Local K-type magnetic activity index for Belgium based on data from Dourbes (DOU) and Manhay (MAB). Comparing the data from both measurement stations allows to reliably remove outliers from the magnetic data. At the same time the operational service availability is improved: whenever data from one observatory is not available, the single-station index obtained from the other can be used as a fallback system.
Both the two-station index and the single station indices are available here: http://ionosphere.meteo.be/geomagnetism/K_BEL/
The SIDC Space Weather Briefing
The SIDC forecaster on duty presented an overview of what happened in the space weather domain during the week of May 6 to May 12. The pdf of this SIDC briefing can be found at: https://www.stce.be/briefings/20240513_SWbriefing.pdf
Review of Ionospheric Activity
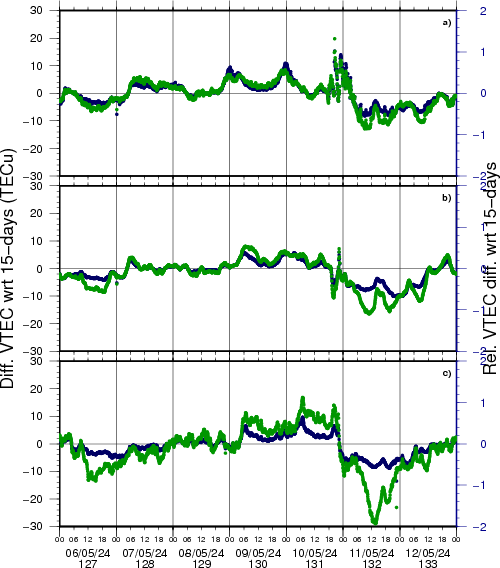
NEW! The time series below illustrates (in green) the VTEC deviation from normal quiet behaviour.
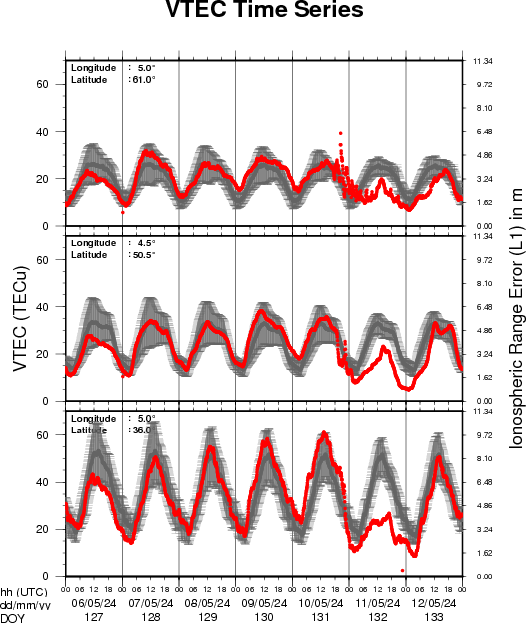
VTEC time series at 3 locations in Europe from 6 May 2024 till 12 May 2024
The top figure shows the time evolution of the Vertical Total Electron Content (VTEC) (in red) during the last week at three locations:
a) in the northern part of Europe(N 61deg E 5deg)
b) above Brussels(N 50.5deg, E 4.5 deg)
c) in the southern part of Europe(N 36 deg, E 5deg)
This top figure also shows (in grey) the normal ionospheric behaviour expected based on the median VTEC from the 15 previous days.
The time series below shows the VTEC difference (in green) and relative difference (in blue) with respect to the median of the last 15 days in the North, Mid (above Brussels) and South of Europe. It thus illustrates the VTEC deviation from normal quiet behaviour.
The VTEC is expressed in TECu (with TECu=10^16 electrons per square meter) and is directly related to the signal propagation delay due to the ionosphere (in figure: delay on GPS L1 frequency).
The Sun's radiation ionizes the Earth's upper atmosphere, the ionosphere, located from about 60km to 1000km above the Earth's surface.The ionization process in the ionosphere produces ions and free electrons. These electrons perturb the propagation of the GNSS (Global Navigation Satellite System) signals by inducing a so-called ionospheric delay.
See http://stce.be/newsletter/GNSS_final.pdf for some more explanations; for more information, see https://gnss.be/SpaceWeather
STCE activities
Courses and presentations with the Sun-Space-Earth interaction and Space Weather as the main theme.
We provide occasions to get submerged in our world through educational, informative and instructive
activities.
* May 18, Public presentation, The PROBA-3 Mission: Artificial Total Solar Eclipse in Space, FotonFest,
Urania, Hove, Belgium
* May 28, Solar physics and Space Weather: Solar Orbiter Spacecraft, online course - Registrations
are open
* June 7, STCE seminar, Ground level enhancements: probing conditions of the geospace environment
* June 9, Public presentation Total Eclipse of the Sun, Helios, Averbode, Belgium
* June 13, STCE seminar, Solar Prominence Eruptions: Insights from UV Imaging with EUI/FSI
* June 25, Solar physics and Space Weather: predictions and services, online course - Registrations
are open
* June 27, STCE annual meeting, Brussels, Belgium
* June 28, public presentation Help! Het stormt in de ruimte!?, Wetenschappelijke middagen, Brussels,
Belgium
To register for a course or lecture, check the page of the STCE Space Weather Education Center: https://www.stce.be/SWEC If you want your event in the STCE newsletter, contact us: stce_coordination at stce.be