- Table of Content
- 1.Cruising throu...
- 2.Comet viewing
- 3.Review of sola...
- 4.PROBA2 Observa...
- 5.Noticeable Sol...
- 6.International ...
- 7.Geomagnetic Ob...
- 8.The SIDC Space...
- 9.Review of Iono...
- 10.STCE Space Wea...
2. Comet viewing
3. Review of solar activity
4. PROBA2 Observations (14 Oct 2024 - 20 Oct 2024)
5. Noticeable Solar Events
6. International Sunspot Number by SILSO
7. Geomagnetic Observations in Belgium
8. The SIDC Space Weather Briefing
9. Review of Ionospheric Activity
10. STCE Space Weather Education Centre
Cruising through SC25 maximum
The STCE's SC25 Tracking page https://www.stce.be/content/sc25-tracking has been updated to reflect the latest evolution of some critical space weather parameters for the ongoing solar cycle 25 (SC25). It covers various aspects of space weather, from sunspot numbers over geomagnetic indices all the way to cosmic rays. The multiple graphs allow for a comparison with previous solar cycles at similar stages in their evolution.
The smoothed monthly sunspot number reached a first maximum of 125.3 in June 2023, which exceeded already the maximum of the previous solar cycle SC24 (116.4). After a brief and mild decrease, the smoothed monthly sunspot number then increased again following high sunspot activity starting in April 2024 and continuing throughout the summer. Both in April, July and August 2024, there were several days when the provisional daily sunspot number exceeded 250. The provisional monthly sunspot number reached a maximum of 215.5 in August, which is the highest since September 2001 (238.2). This evolution indicates that SC25 is moving towards its second maximum, thought to occur later in 2024. The SILSO forecasts for SC25 maximum (12-month window) are converging to a maximum between 138 and 161 that would take place sometime between May and October 2024 (see this STCE newsitem https://www.stce.be/news/725/welcome.html ), remaining well above the initial prediction by the SC25 Panel (115). Of note is also that the Sun has reversed its polar fields in 2023 as announced by WSO (http://wso.stanford.edu/ ): The south in mid 2023 and the north late 2023. This is a clear sign we are cruising now through solar cycle maximum (see this STCE newsitem https://www.stce.be/news/690/welcome.html ).
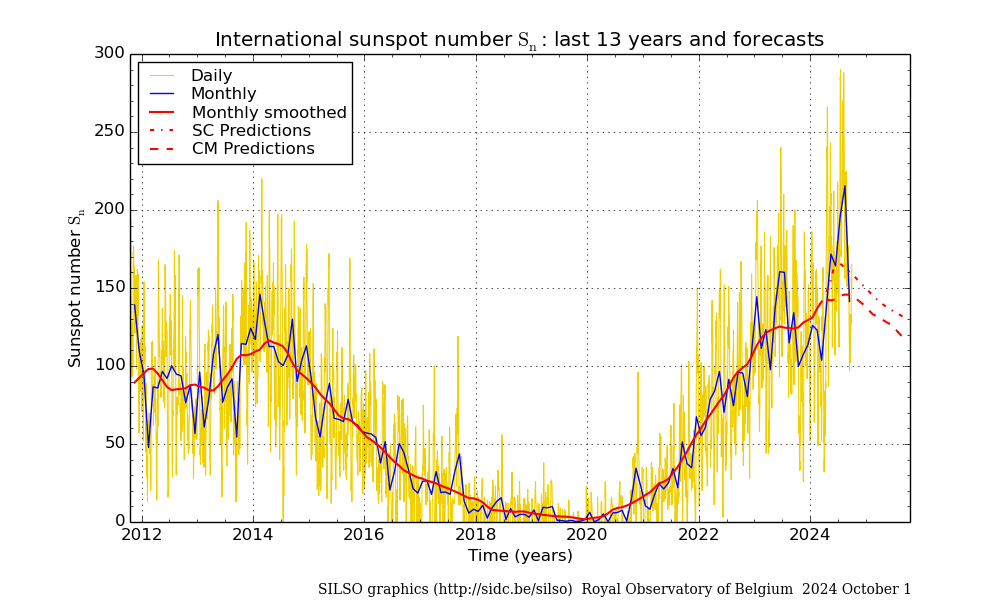
Many other space weather related indices have reached high values during the last few months. Since the high solar activity started in April this year, the daily solar radio flux exceeded 200 sfu (non-flare driven!) on several days. The monthly radio flux value of 251.7 sfu recorded in August 2024 was the highest since August 1990 (252.1 sfu)! The enhanced solar activity has been accompanied by continuing high levels of solar EUV and x-ray emission. Consequently, the thermosphere has been getting hotter and expanded which may result in drag effects altering satellite orbits. The Thermosphere Climate Index (https://saber.gats-inc.com/ ) reached high values in September and October 2024, values that have not been observed since the maximum of SC23.
The number of solar flares followed suit, with SC25 now (up to 30 September 2024) having produced 1259 M- and X-class flares. About 11% of these events were produced in May 2024 (especially by NOAA 3664) and we have to go back to March 1991 to find a month with even more M/X flares (resp. 179 vs 143). March 1991 also has 2 X-class flares more than May 2024 (23 vs 21). Finally, May 2024 was the first month with more than 10 X-class flares in a single month since September 2005 with the famous active region NOAA 10808. The strongest solar flares so far during SC25 have been an X9.0 flare on 3 October 2024 by NOAA 3842 (https://www.stce.be/news/727/welcome.html ) and an X8.7 flare by NOAA 3664 (https://www.stce.be/news/700/welcome.html ) on 14 May this year. The strongest geomagnetic storms in SC25 occurred on 10-11 May (STCE newsitem at https://www.stce.be/news/704/welcome.html ) and on 10-11 October 2024 (STCE news item at https://www.stce.be/news/729/welcome.html ). We have to go back to the declining phase of SC23, i.e. 2003-2004, to find geomagnetic storms of similar intensity.
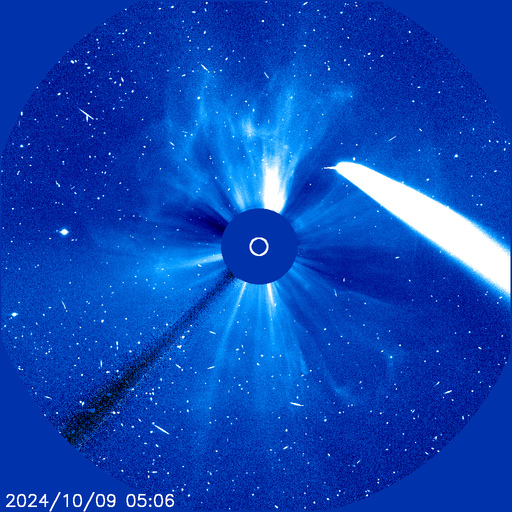
The SOHO/LASCO C3 coronagraphic image underneath shows the halo CME early on 9 October that would cause the severe geomagnetic storm on 10 and 11 October, the associated proton event which was the strongest so far in SC25 (most of the "noise" in the image), the planet Mercury (bright dot to the left), and the comet Tsuchinshan–ATLAS which passed through the coronagraph's field of view. A clip covering the period from 7 till 15 October is in the online version of this article at https://www.stce.be/news/730/welcome.html
Comet viewing
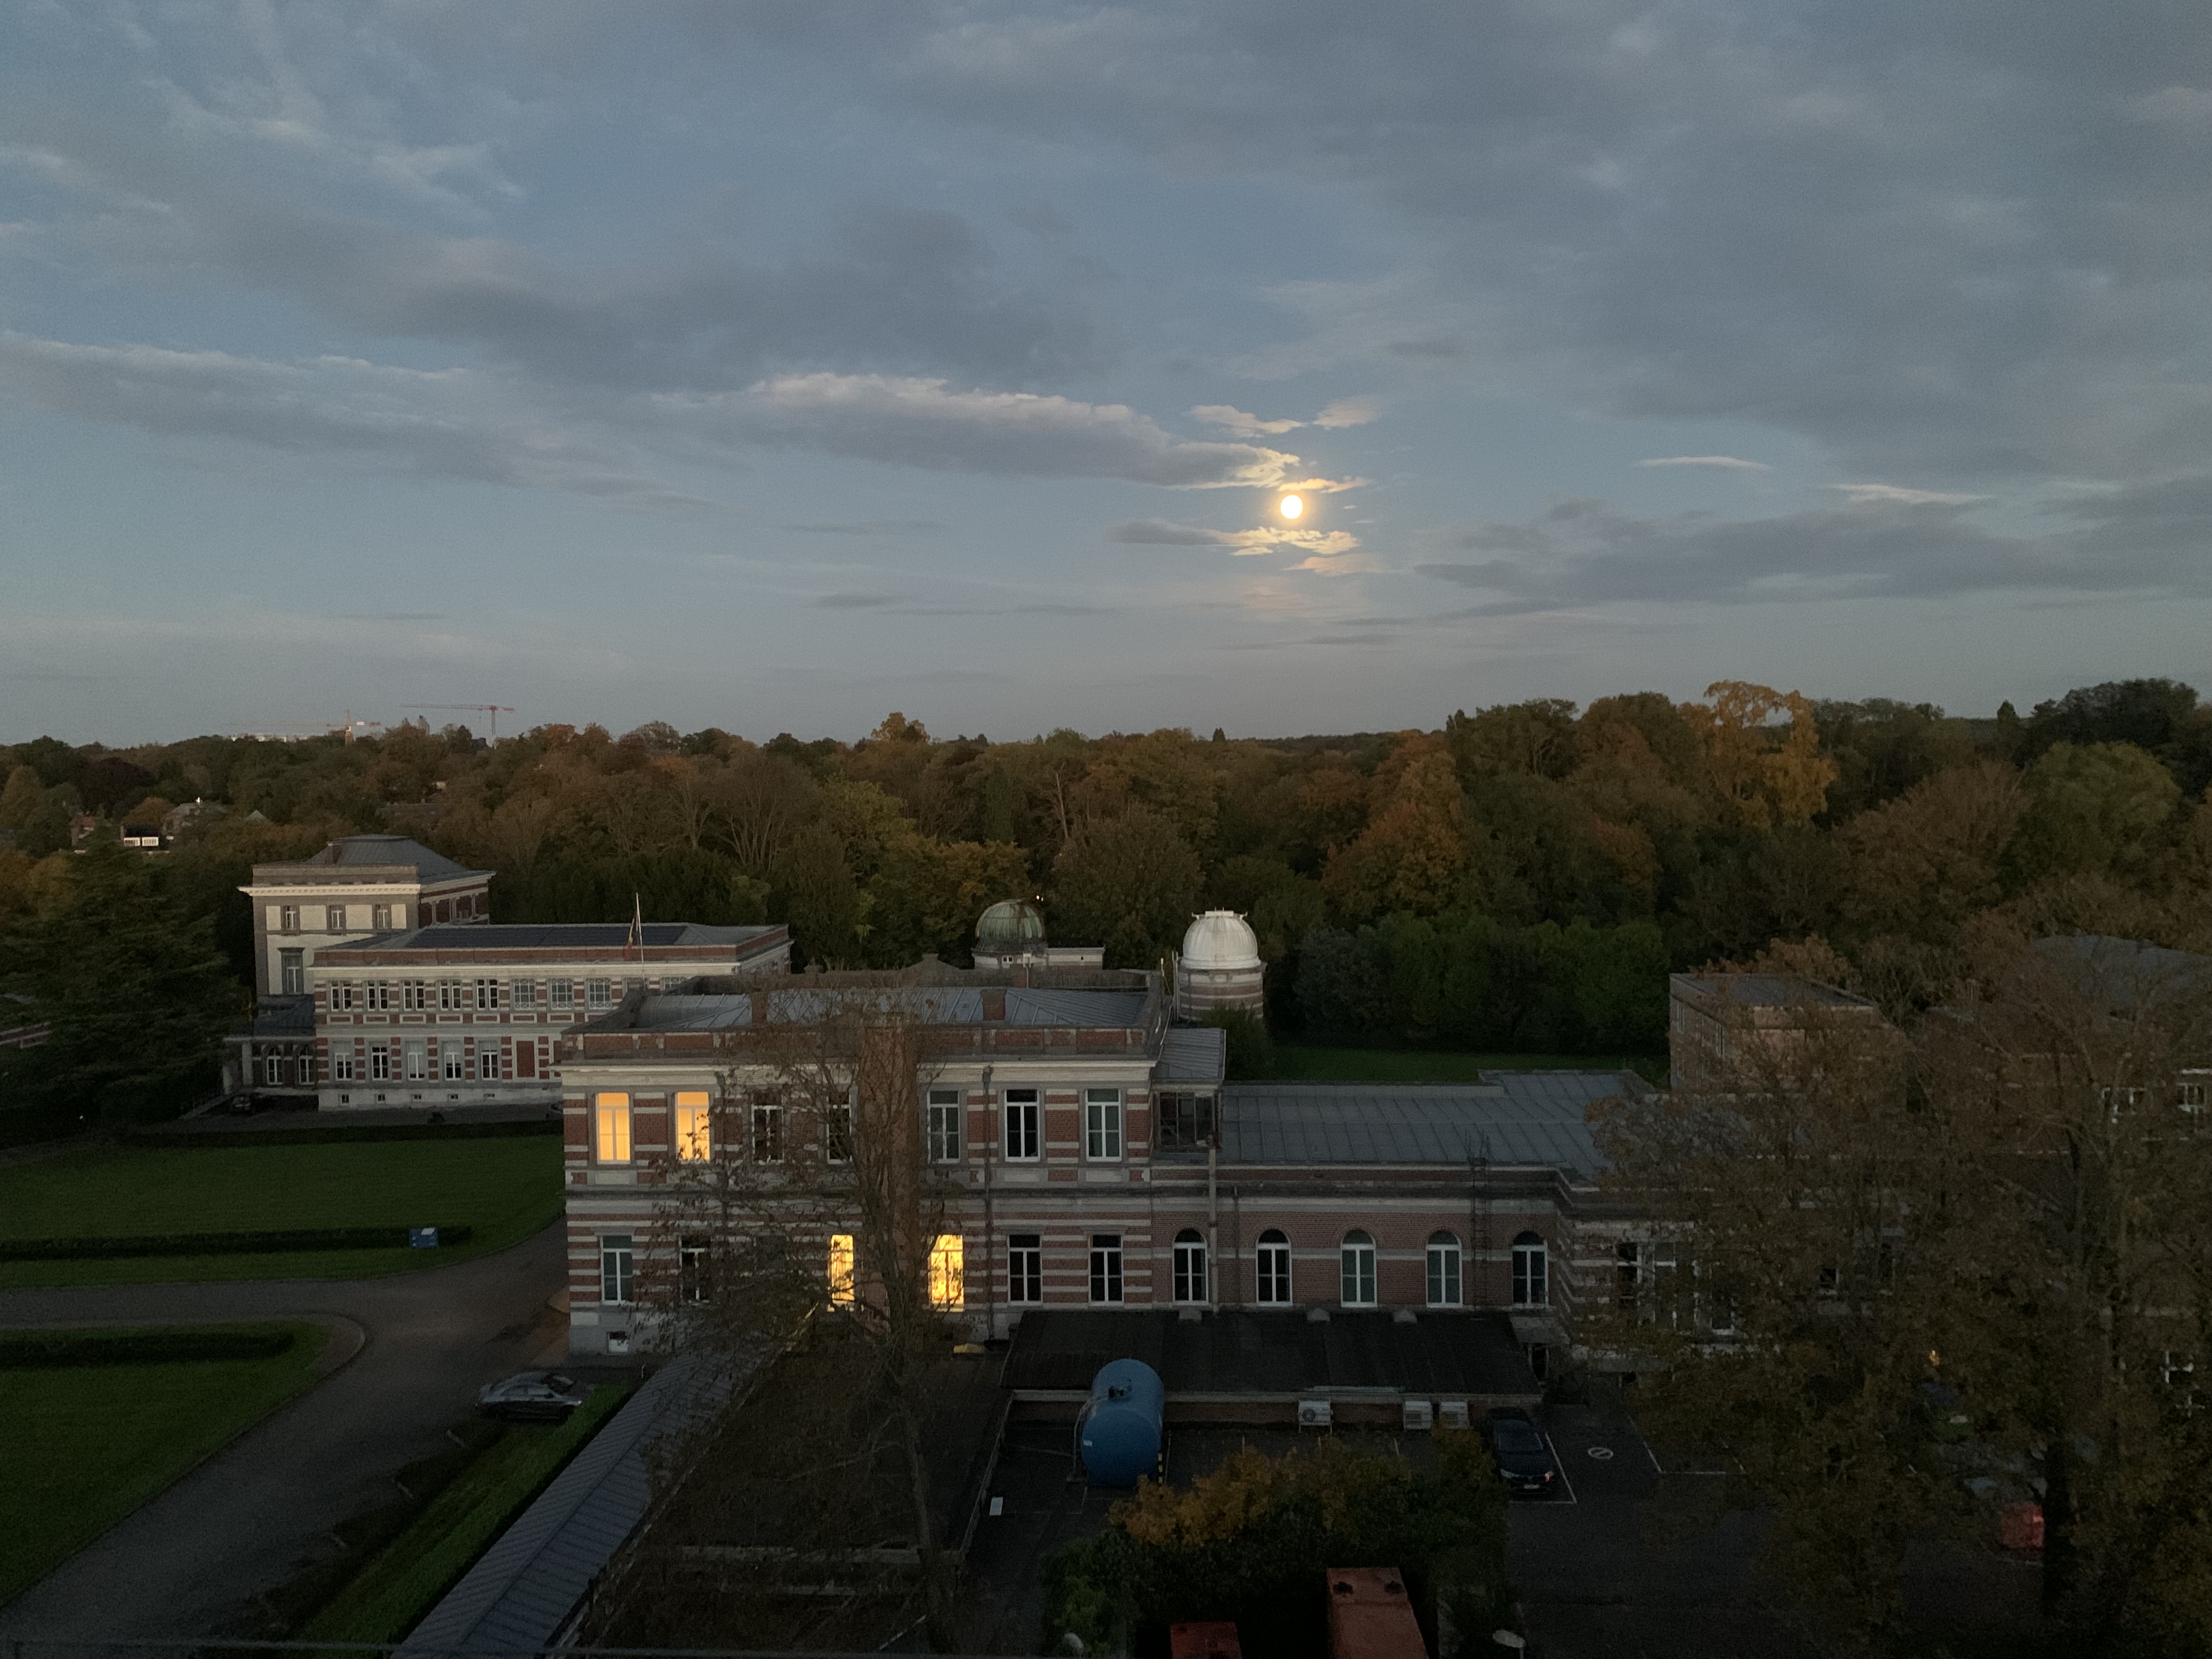
Just like everywhere else in the world, the halls of the STCE have been buzzing with conversations on the comet named C/2023 A3 (Tsuchinshan-ATLAS). For a long time, the weather was not cooperating and observing it was extremely difficult. Then (finally!), on Wednesday Oktober 16, the clouds cleared.
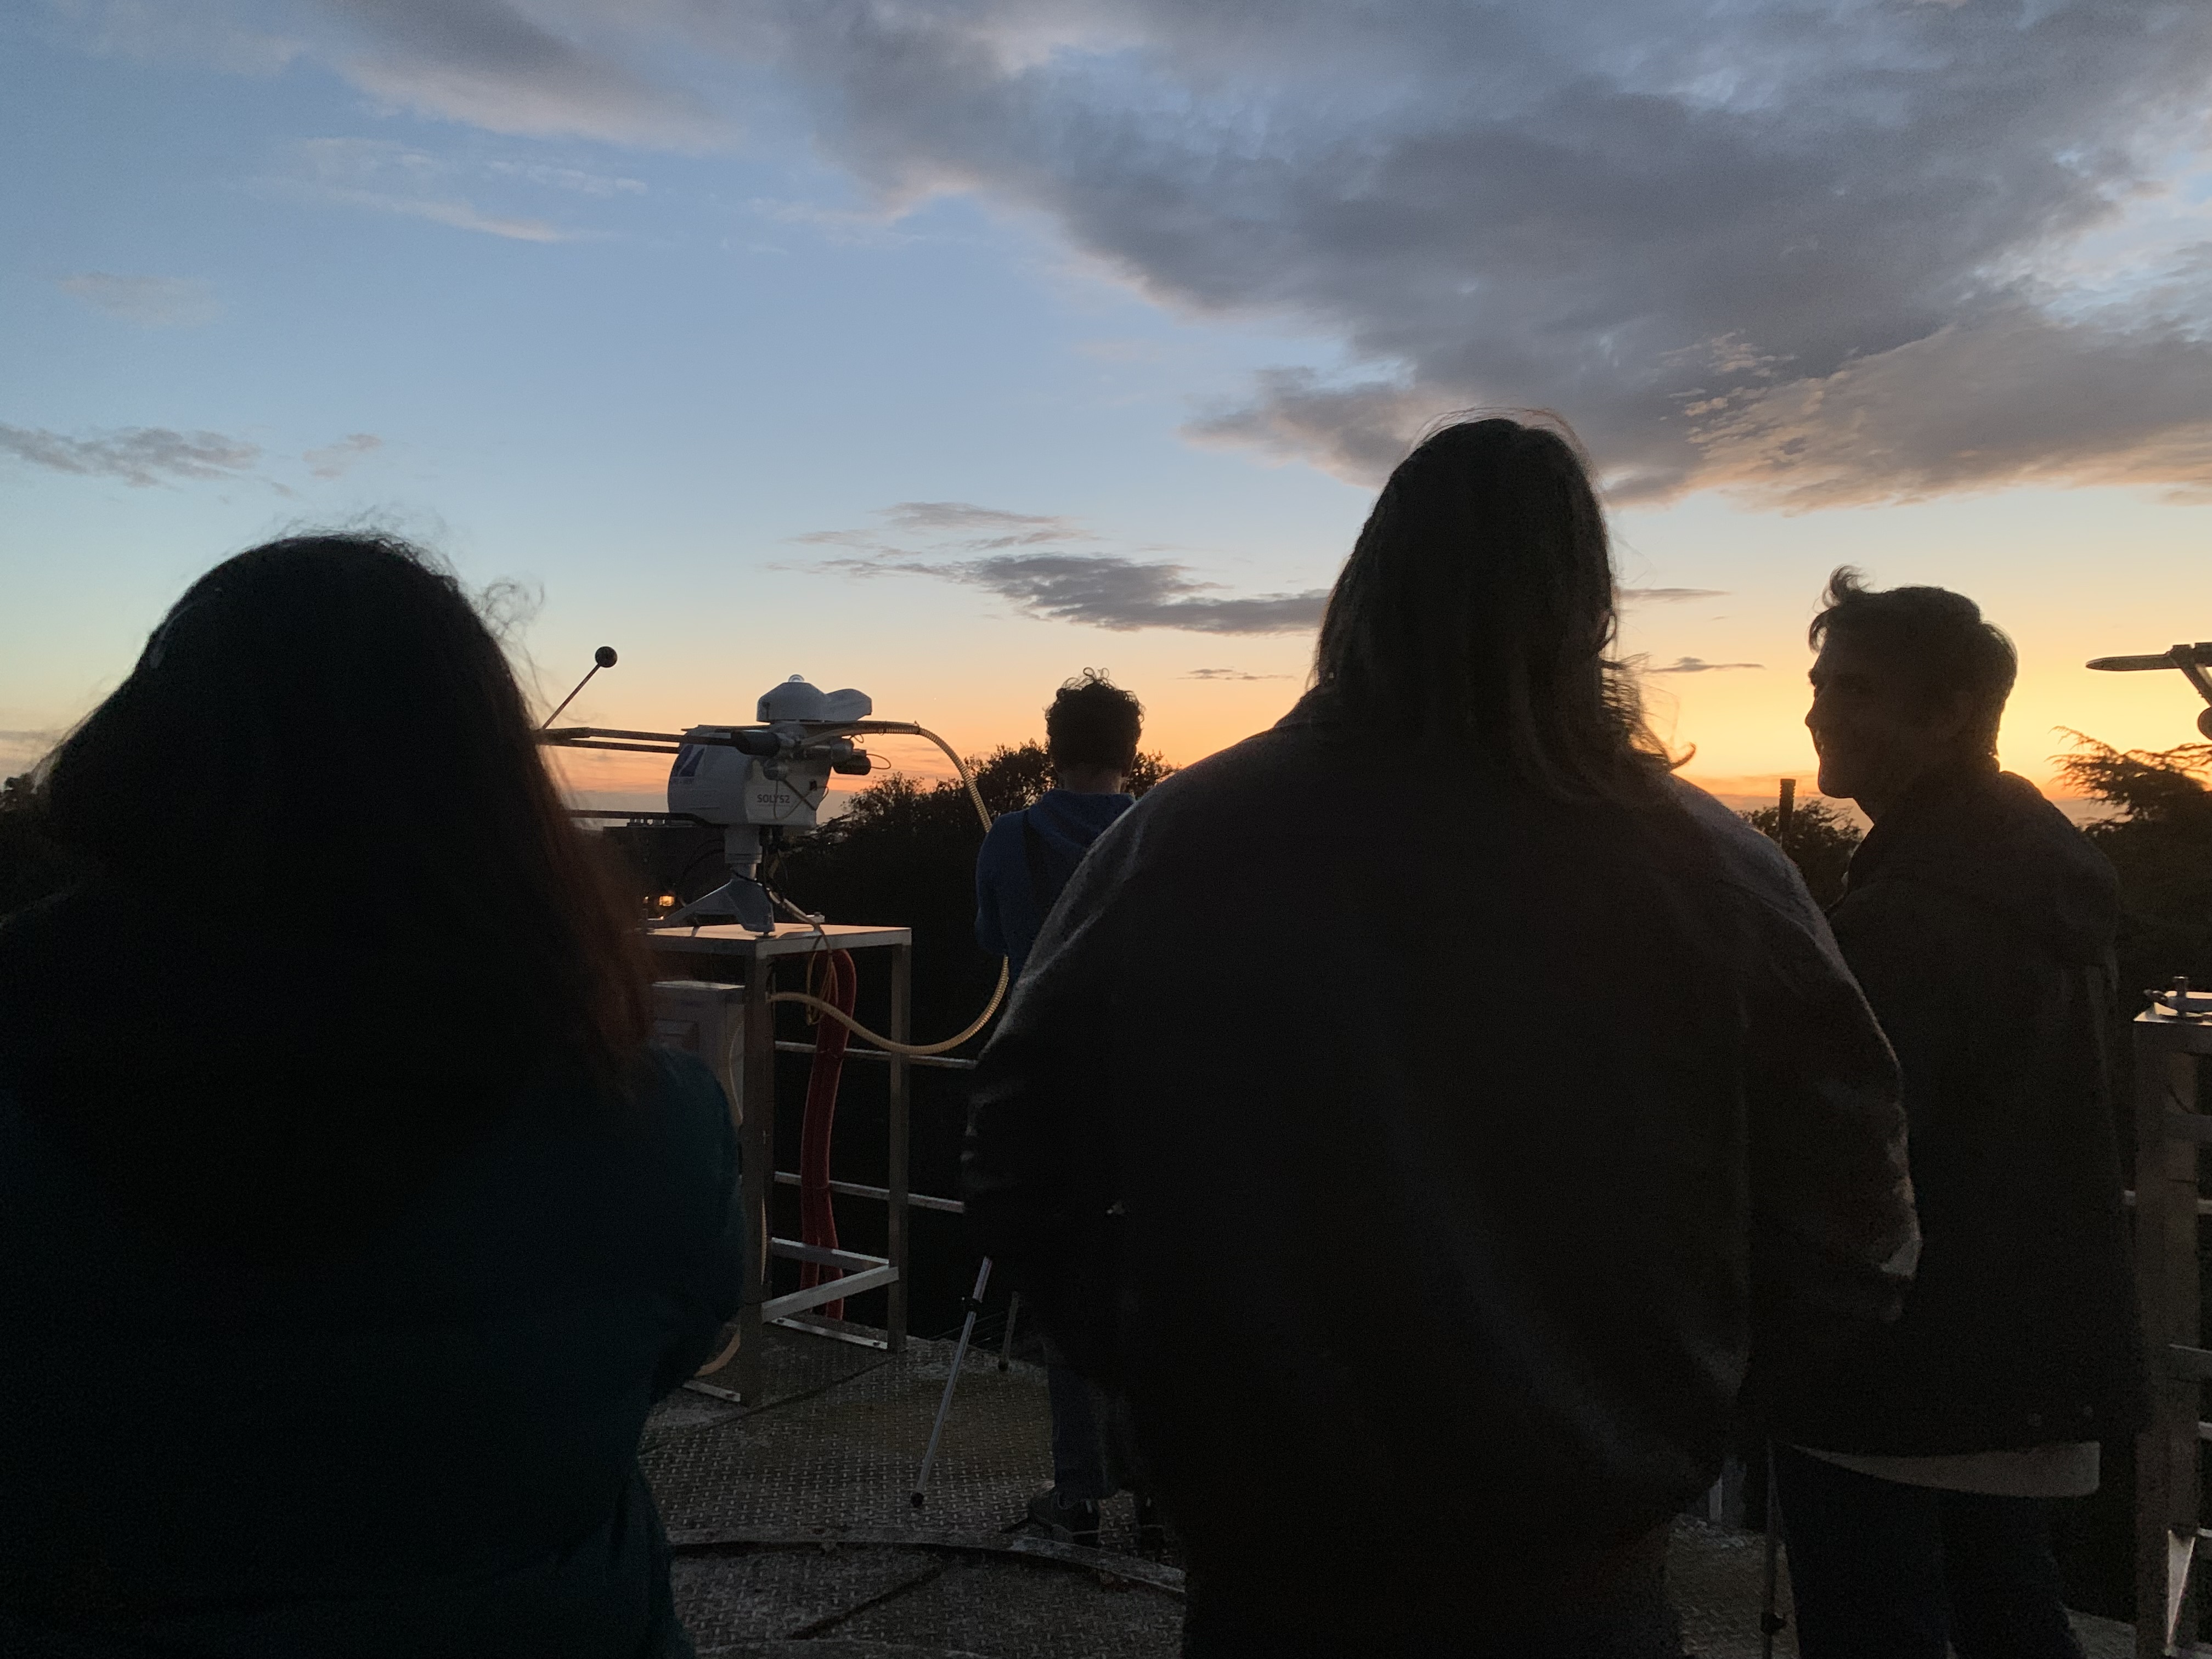
As soon as the Sun started to set, we climbed to the very top of the main building of the Royal Meteorological Institute and enjoyed the view!
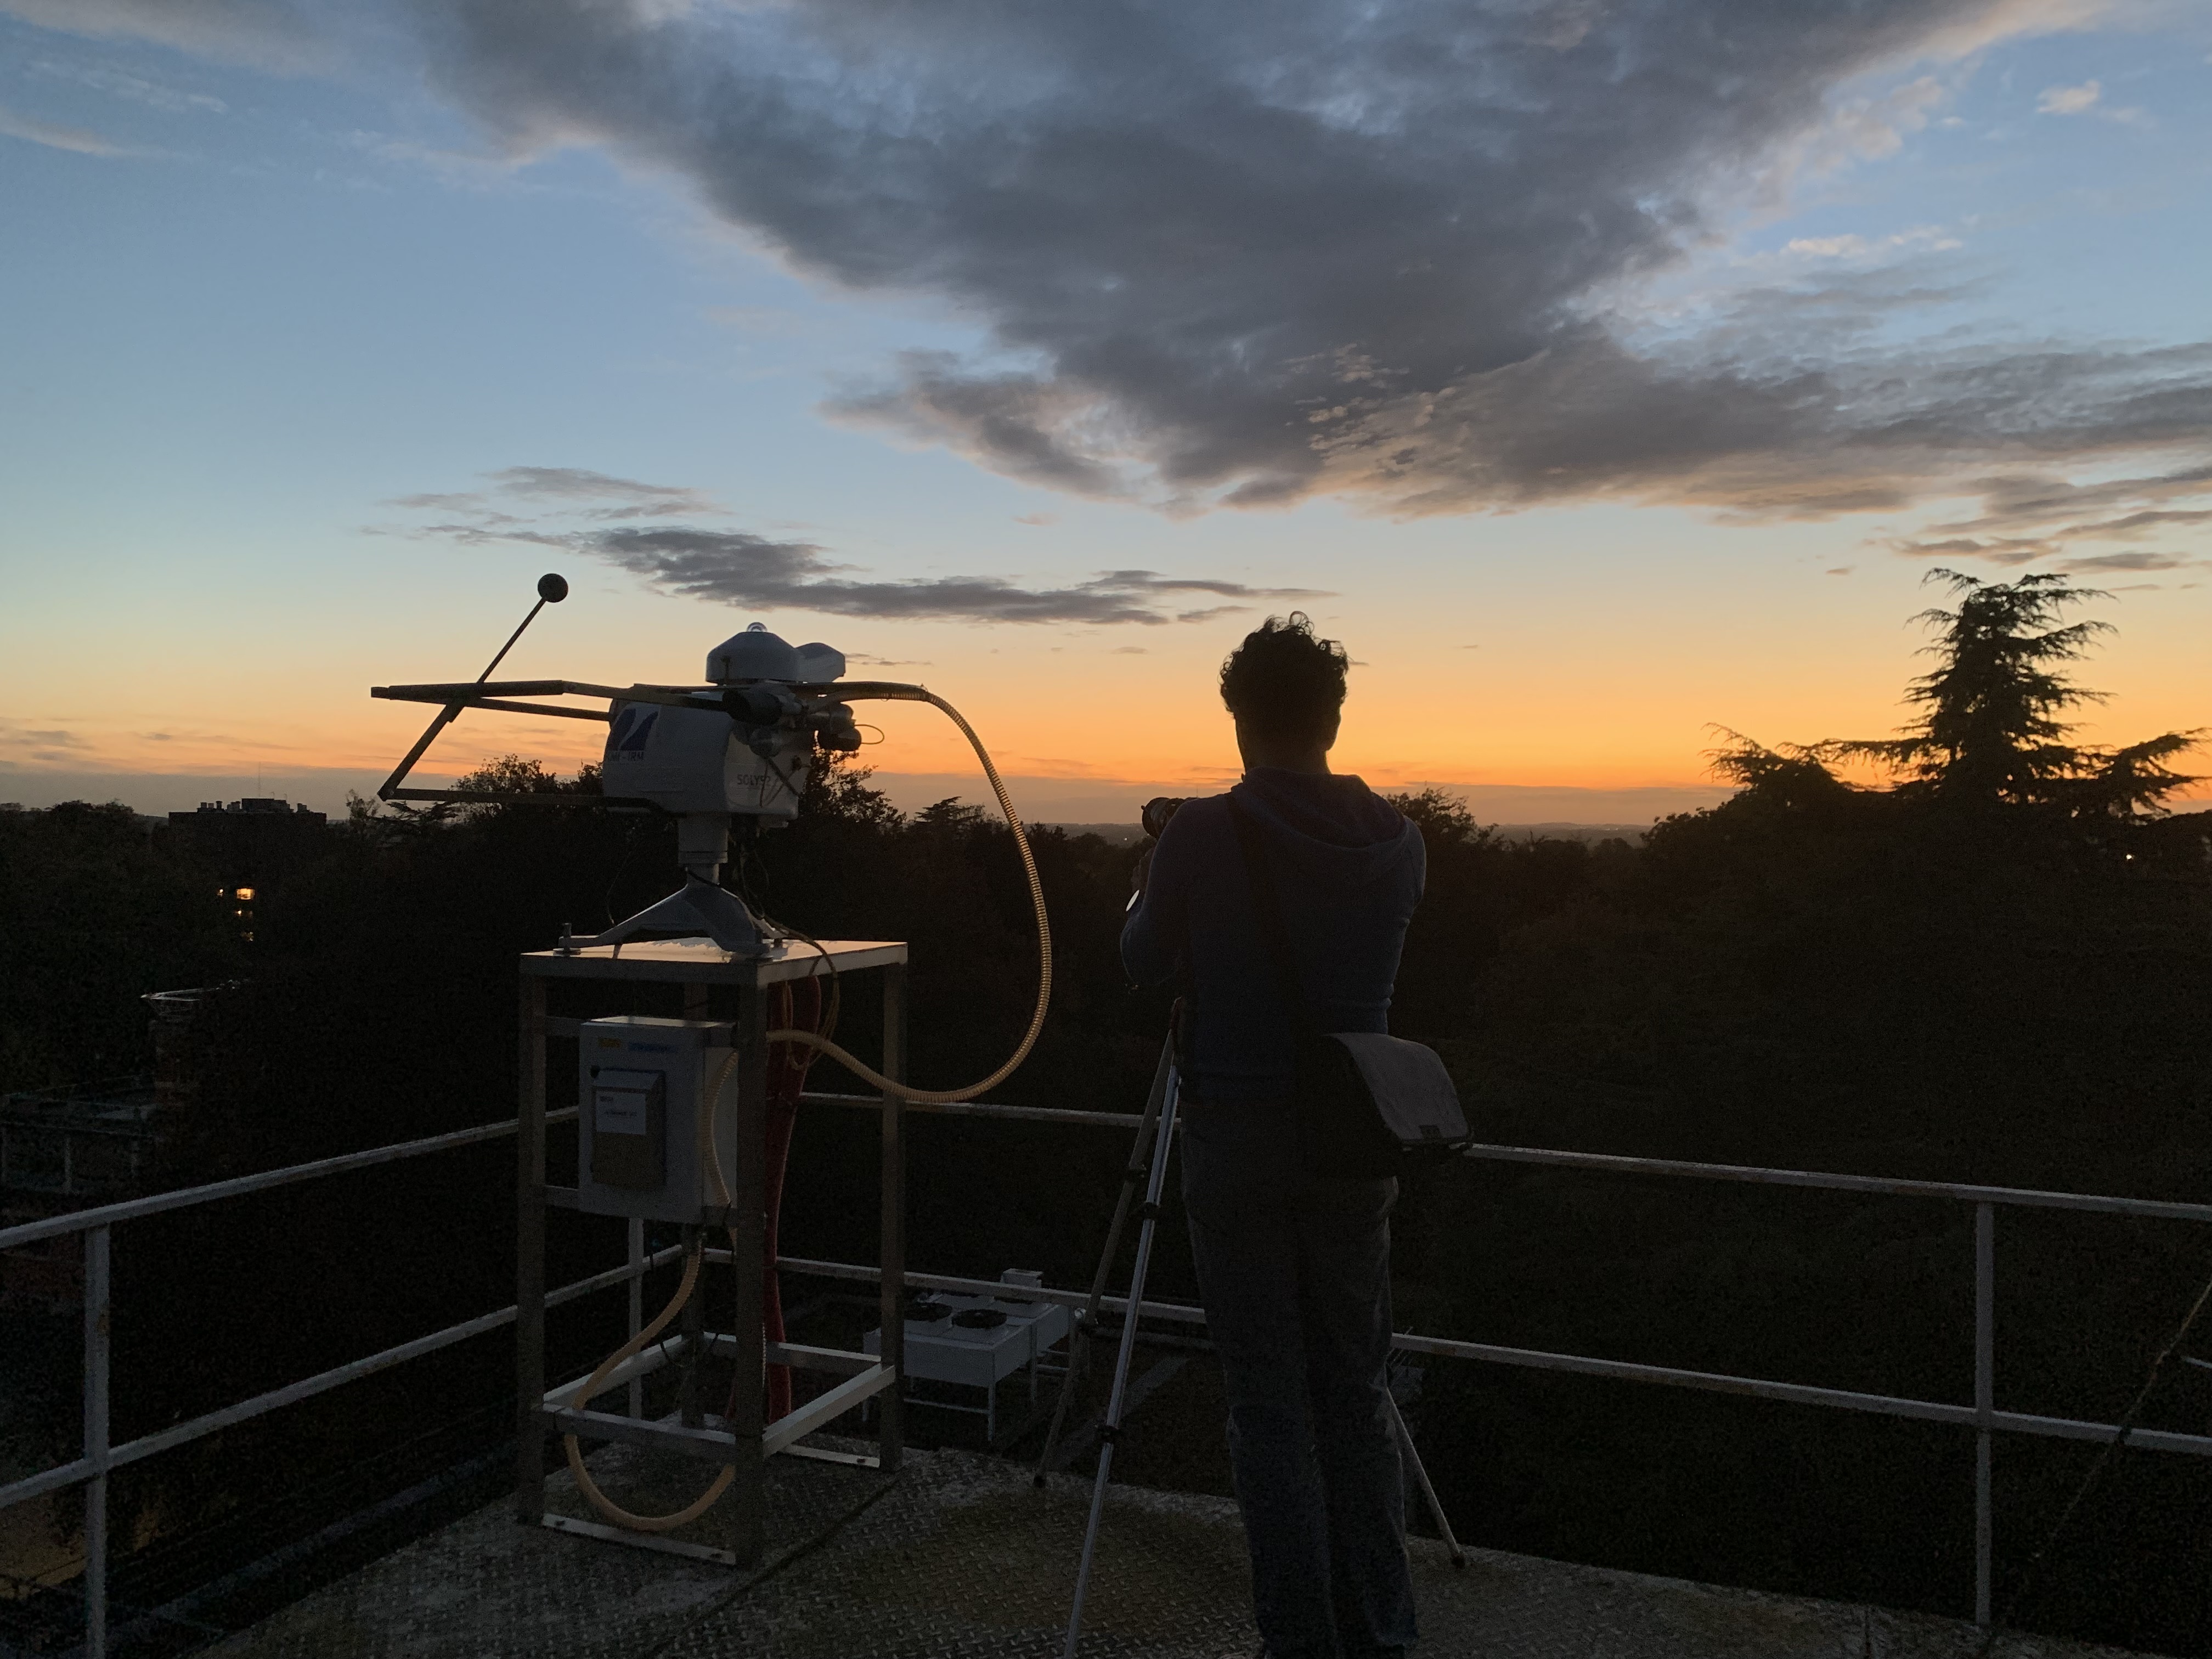
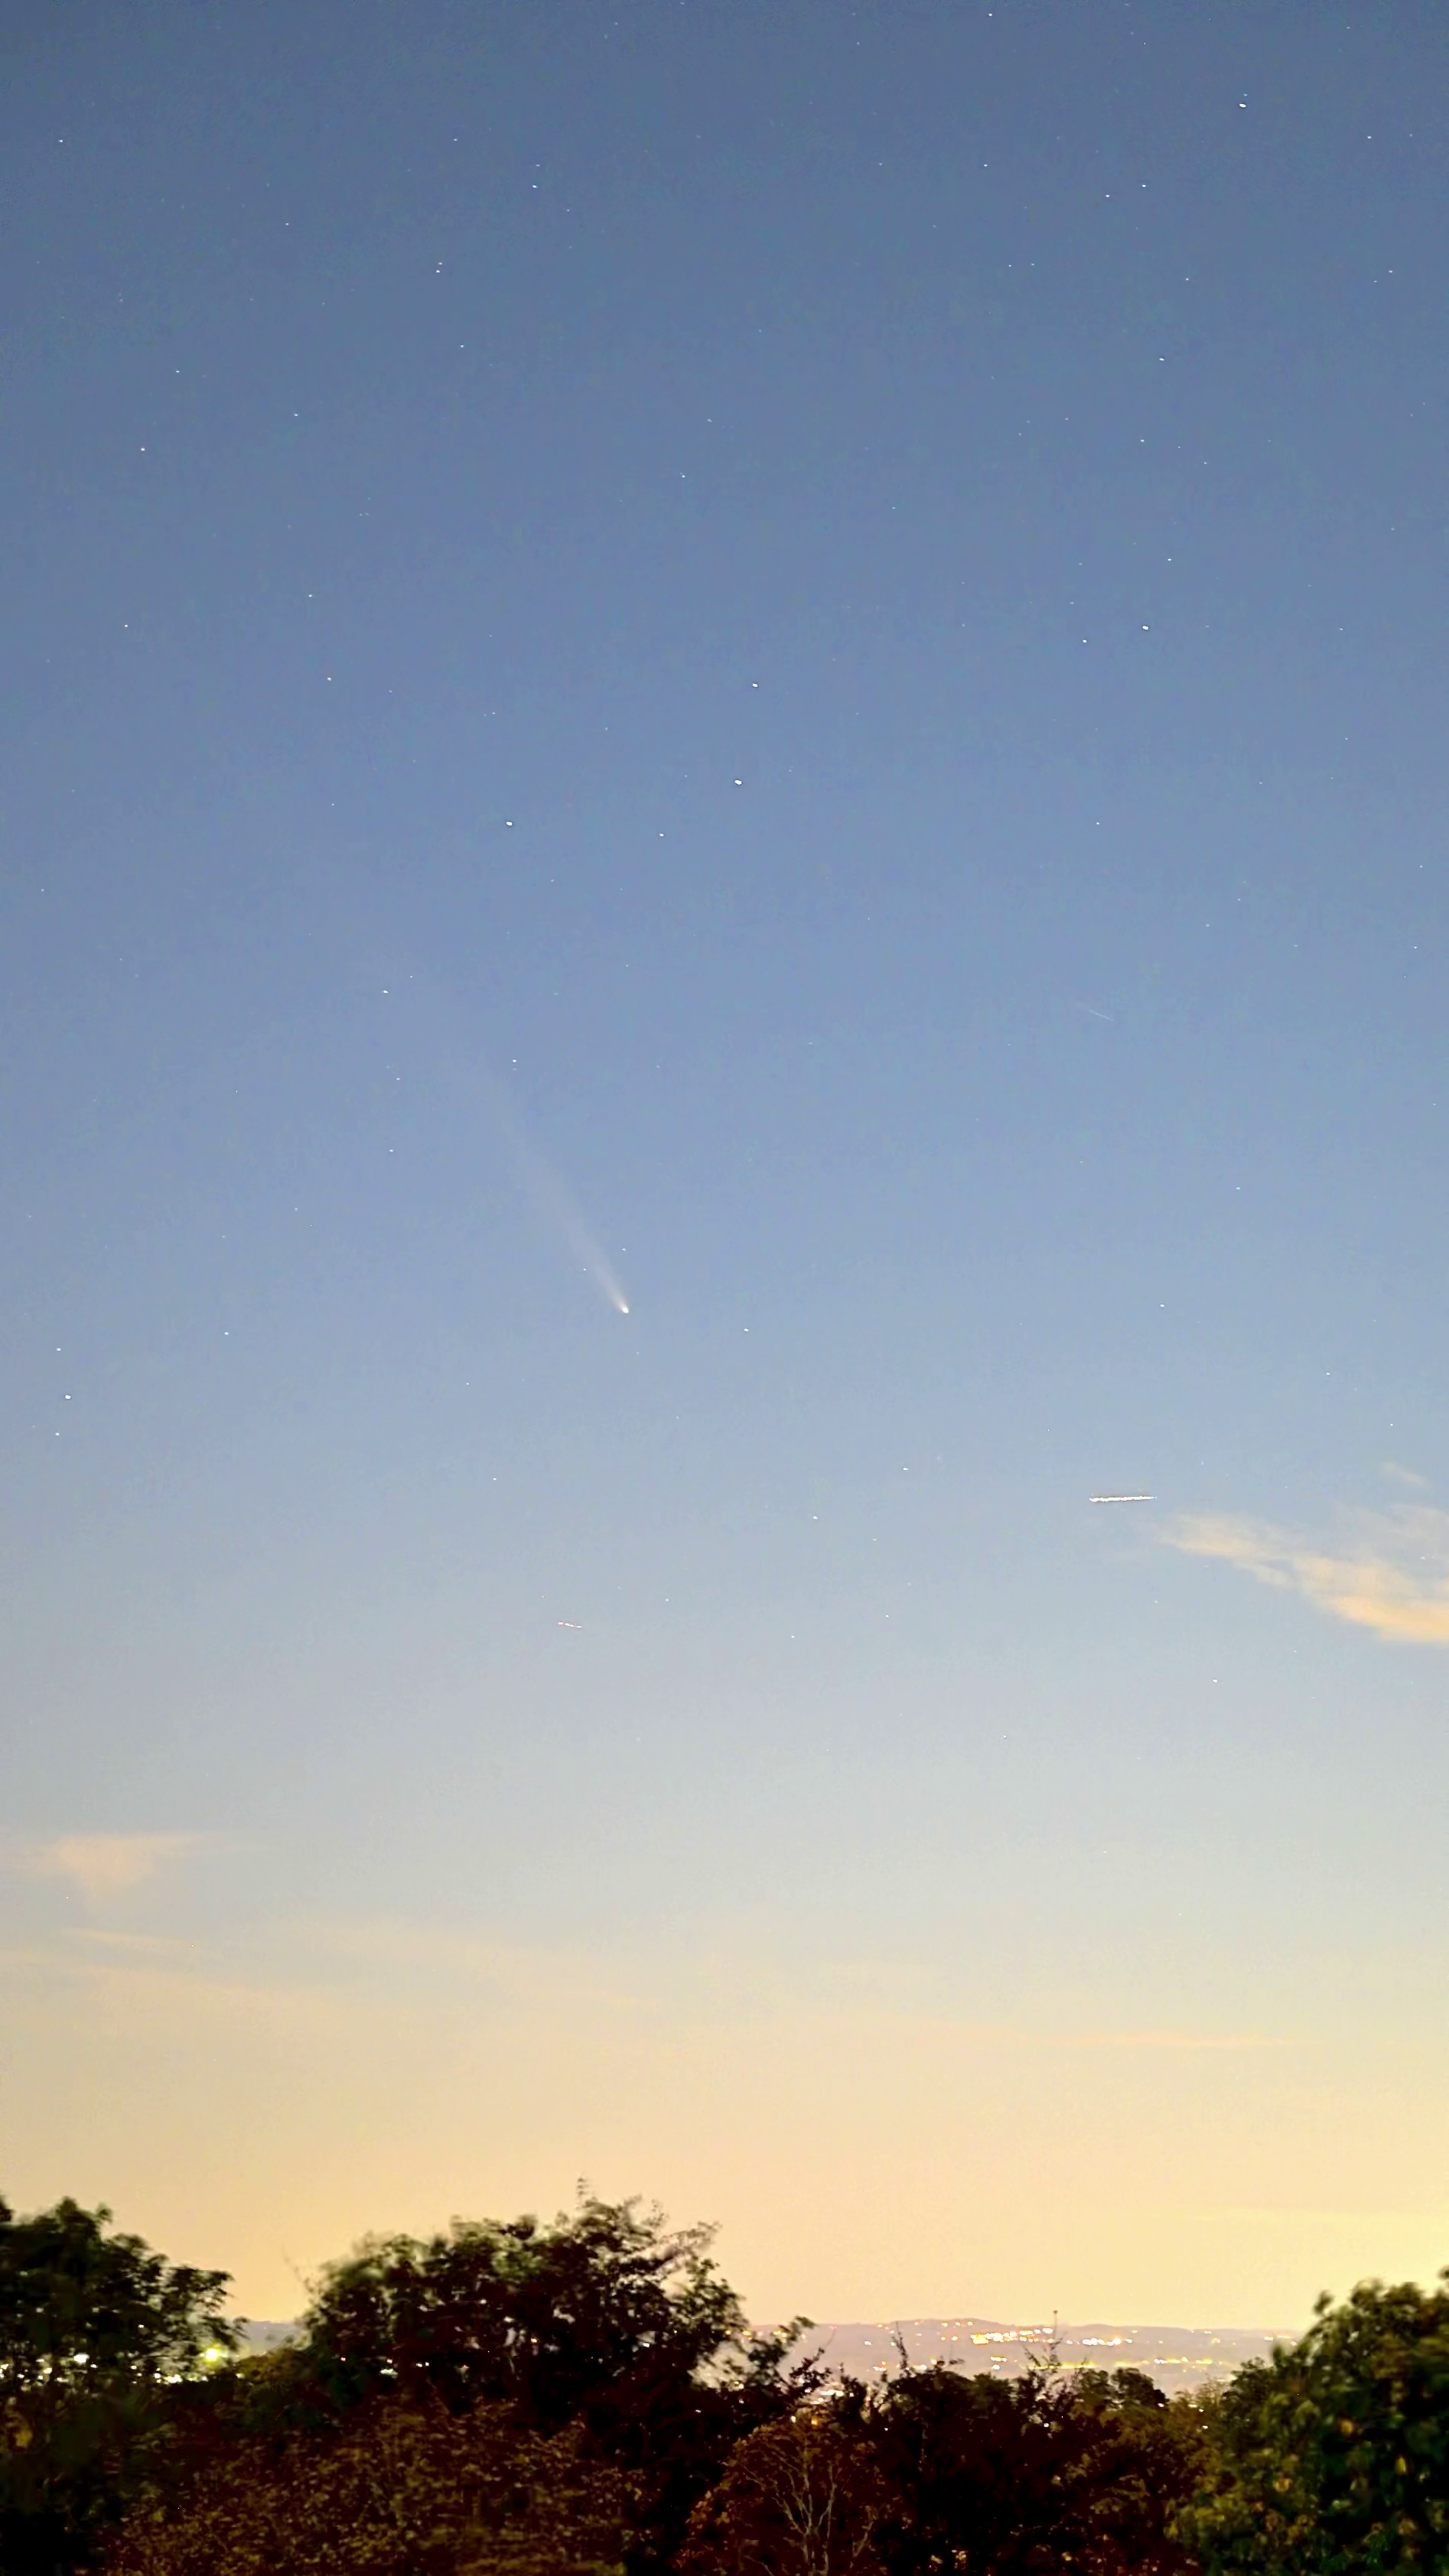
Another comet was discovered much more recently by Hawaii's Asteroid Terrestrial-impact Last Alert System (ATLAS) project and named C/2024 S1. It is a sungrazer. Those comets travel very close to the Sun, where they light up and often break into smaller pieces.
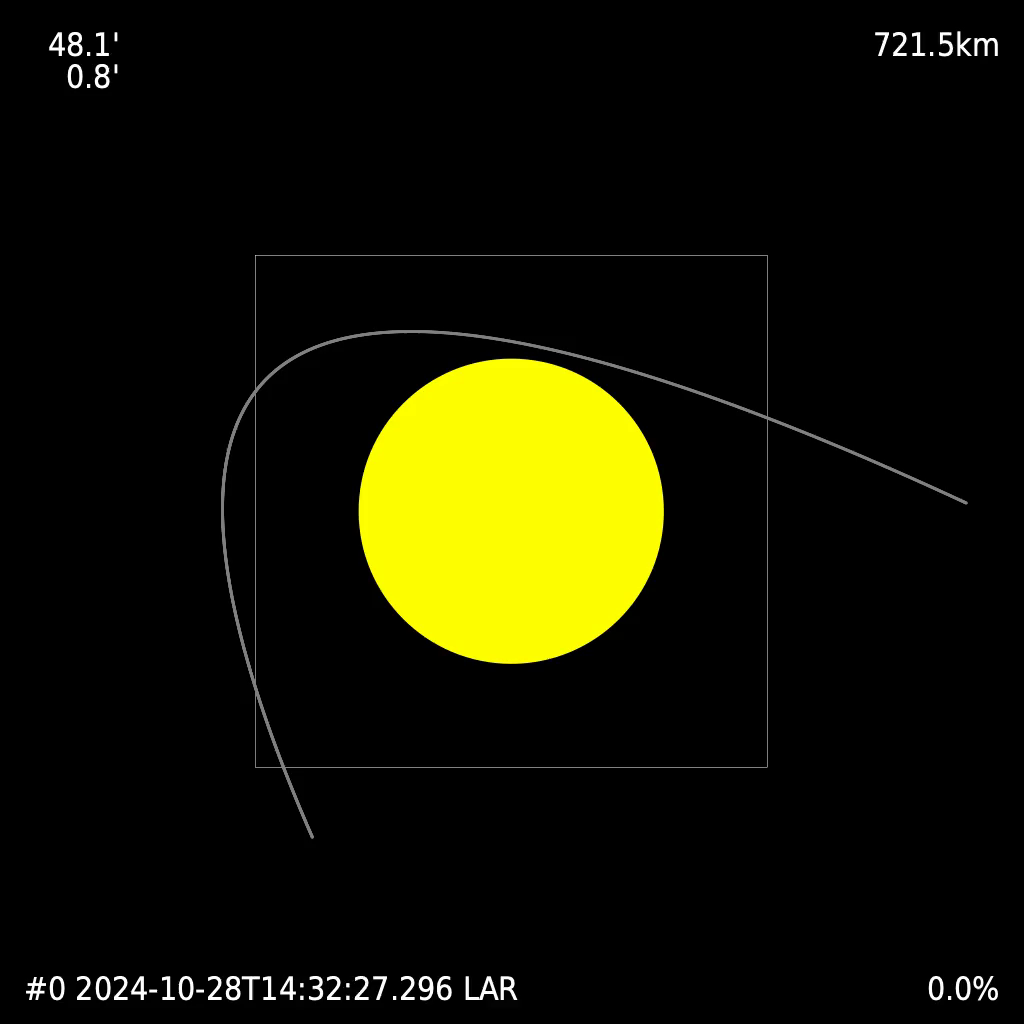
On October 28, C/2024 S1 will reach its closest point to the Sun. Many solar observatories are preparing special observation campaigns to try and catch this comet as it speeds by. There are many unknowns about the composition and brightness of this object, making the planning of the observations quite challenging. Nevertheless, our SolO/EUI and PROBA2/SWAP telescopes will be watching closely to see whether the comet survives its close encounter with our hot star.
The image below shows the trajectory in the PROBA2/SWAP field-of-view. PROBA2 will use off-points to follow even more of the trajectory as the comet flies around the sun. A full movie can be found here: https://proba2.sidc.be/Events/2024-Oct-28-CometC2024S1/proba2-atlas.mp4
Review of solar activity
Solar Active Regions (ARs) and flares
Solar flaring activity was moderate. There were a total number of 14 active regions observed on the visible solar disk. A total of 39 C-class flares and 19 M-class flares were observed. The largest flare was an M6.5, with peak time 06:56 UTC on October 19 2024, from NOAA AR 3854 (beta-gamma). NOAA AR 3848, 3854, 3852 were the most active regions and produced the M-class flares this week.
Coronal mass ejections
During the past week, no CME (Coronal Mass Ejection) with an Earth directed component was observed.
Coronal Holes
Two positive polarity Coronal Hole (CH) crossed the central meridian in the northern hemisphere on October 14, and October 18 respectively.
Proton flux levels
The greater than 10 MeV GOES proton flux was below the 10pfu threshold for the entire week.
Electron fluxes at GEO
The greater than 2 MeV electron flux as measured by GOES 18 remained mainly below the 1000 pfu (particle flux unit) threshold, but was above the threshold for a very short time on October 16 and October 17. The 24h electron fluence was at nominal levels.
Solar wind
The solar wind conditions at Earth were slow for the entire week. The solar wind ranged between 310km/s and 490 km/s and the interplanetary magnetic field was mainly around 9nT, with a short peak at 13nT, and with the Bz reaching a minimum value of -10 nT.
Geomagnetism
Geomagnetic conditions were mainly quiet to unsettled levels (Kp 3) both globally and locally over the week with a short period of active to minor storm conditions (Kp5-) on October 19 following a prolonged period of negative Bz.
PROBA2 Observations (14 Oct 2024 - 20 Oct 2024)
Solar Activity
Solar flare activity fluctuated from low to moderate during the week.
In order to view the activity of this week in more detail, we suggest to go to the following website from which all the daily (normal and difference) movies can be accessed: https://proba2.oma.be/ssa
This page also lists the recorded flaring events.
A weekly overview movie (SWAP week 760) can be found here: https://proba2.sidc.be/swap/data/mpg/movies/weekly_movies/weekly_movie_2024_10_14.mp4.
Details about some of this week's events can be found further below.
If any of the linked movies are unavailable they can be found in the P2SC movie repository here: https://proba2.oma.be/swap/data/mpg/movies/.
Saturday October 19
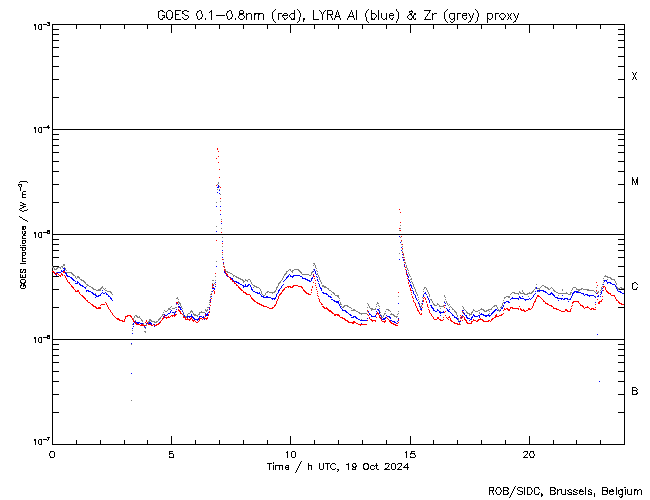
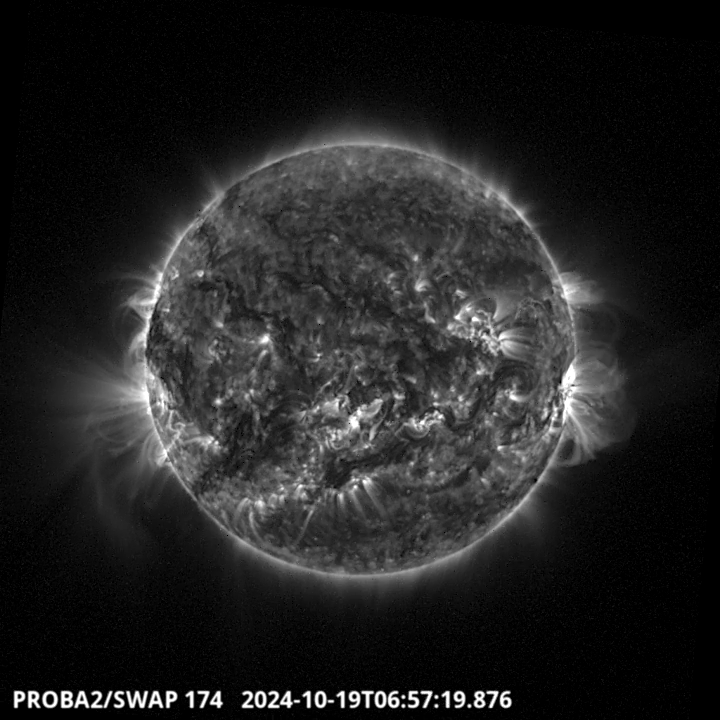
The largest flare of this week was an M6.5, and it was observed by LYRA (top panel) and SWAP (bottom panel). The flare peaked on 2024-Oct-19 at 06:56 UT. It occurred close to the equator at the western limb, originating from active region NOAA3854.
Find a SWAP movie of the event here: https://proba2.sidc.be/swap/movies/20241019_swap_movie.mp4.
Noticeable Solar Events
| DAY | BEGIN | MAX | END | LOC | XRAY | OP | 10CM | TYPE | Cat | NOAA |
| 14 | 0004 | 0017 | 0031 | N10W78 | M3.4 | SF | III/2II/3 | 36 | 3848 | |
| 14 | 1322 | 1337 | 1350 | M1.8 | III/2 | 36 | 3848 | |||
| 15 | 0202 | 0213 | 0223 | S11W23 | M1.9 | 1F | III/1VI/2 | 42 | 3852 | |
| 15 | 0223 | 0227 | 0231 | S11W23 | M1.1 | 1 | III/1VI/2 | 42 | 3852 | |
| 15 | 1000 | 1006 | 1010 | S7W30 | M1.3 | 1N | III/2 | 42 | 3852 | |
| 15 | 1800 | 1818 | 1828 | M1.7 | III/1II/2IV/1 | 3848 | ||||
| 15 | 1828 | 1833 | 1838 | S4W35 | M2.1 | SN | 3/2 88I/2II/2 | 45 | 3854 | |
| 16 | 0312 | 0319 | 0338 | M3.0 | II/3 | 42 | 3852 | |||
| 16 | 0338 | 0346 | 0359 | M3.7 | II/3 | 42 | 3852 | |||
| 16 | 0457 | 0515 | 0529 | S12W35 | M2.8 | 1N | I/2 | 42 | 3852 | |
| 16 | 1312 | 1327 | 1338 | S9W44 | M1.5 | 1 | 42 | 3852 | ||
| 16 | 1429 | 1442 | 1451 | S9W43 | M1.3 | 1N | 38 | 42 | 3852 | |
| 16 | 1451 | 1500 | 1504 | S5W45 | M1.3 | 1 | 42 | 3852 | ||
| 17 | 0212 | 0222 | 0238 | M1.0 | II/1 | 54 | 3856 | |||
| 17 | 0453 | 0505 | 0513 | S10W53 | M2.4 | SF | 42 | 3852 | ||
| 18 | 1728 | 1736 | 1741 | M1.1 | 45 | 3854 | ||||
| 18 | 1927 | 1938 | 1943 | S6W76 | M4.8 | SN | 45 | 3854 | ||
| 18 | 2313 | 2328 | 2338 | S11W80 | M4.7 | SF | II/1 | 42 | 3852 | |
| 19 | 0648 | 0656 | 0703 | M6.5 | 3854 | |||||
| 19 | 1427 | 1434 | 1440 | M1.7 | 3854 |
| LOC: approximate heliographic location | TYPE: radio burst type |
| XRAY: X-ray flare class | Cat: Catania sunspot group number |
| OP: optical flare class | NOAA: NOAA active region number |
| 10CM: peak 10 cm radio flux |
International Sunspot Number by SILSO
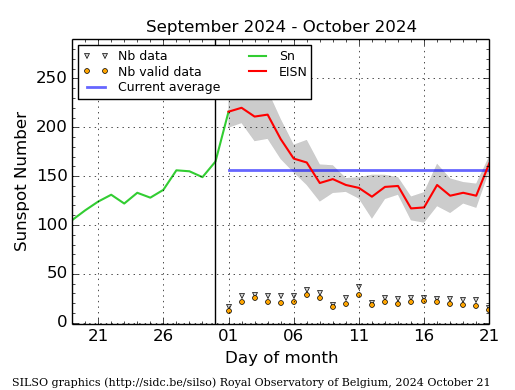
The daily Estimated International Sunspot Number (EISN, red curve with shaded error) derived by a simplified method from real-time data from the worldwide SILSO network. It extends the official Sunspot Number from the full processing of the preceding month (green line), a few days more than one solar rotation. The horizontal blue line shows the current monthly average. The yellow dots give the number of stations that provided valid data. Valid data are used to calculate the EISN. The triangle gives the number of stations providing data. When a triangle and a yellow dot coincide, it means that all the data is used to calculate the EISN of that day.
Geomagnetic Observations in Belgium
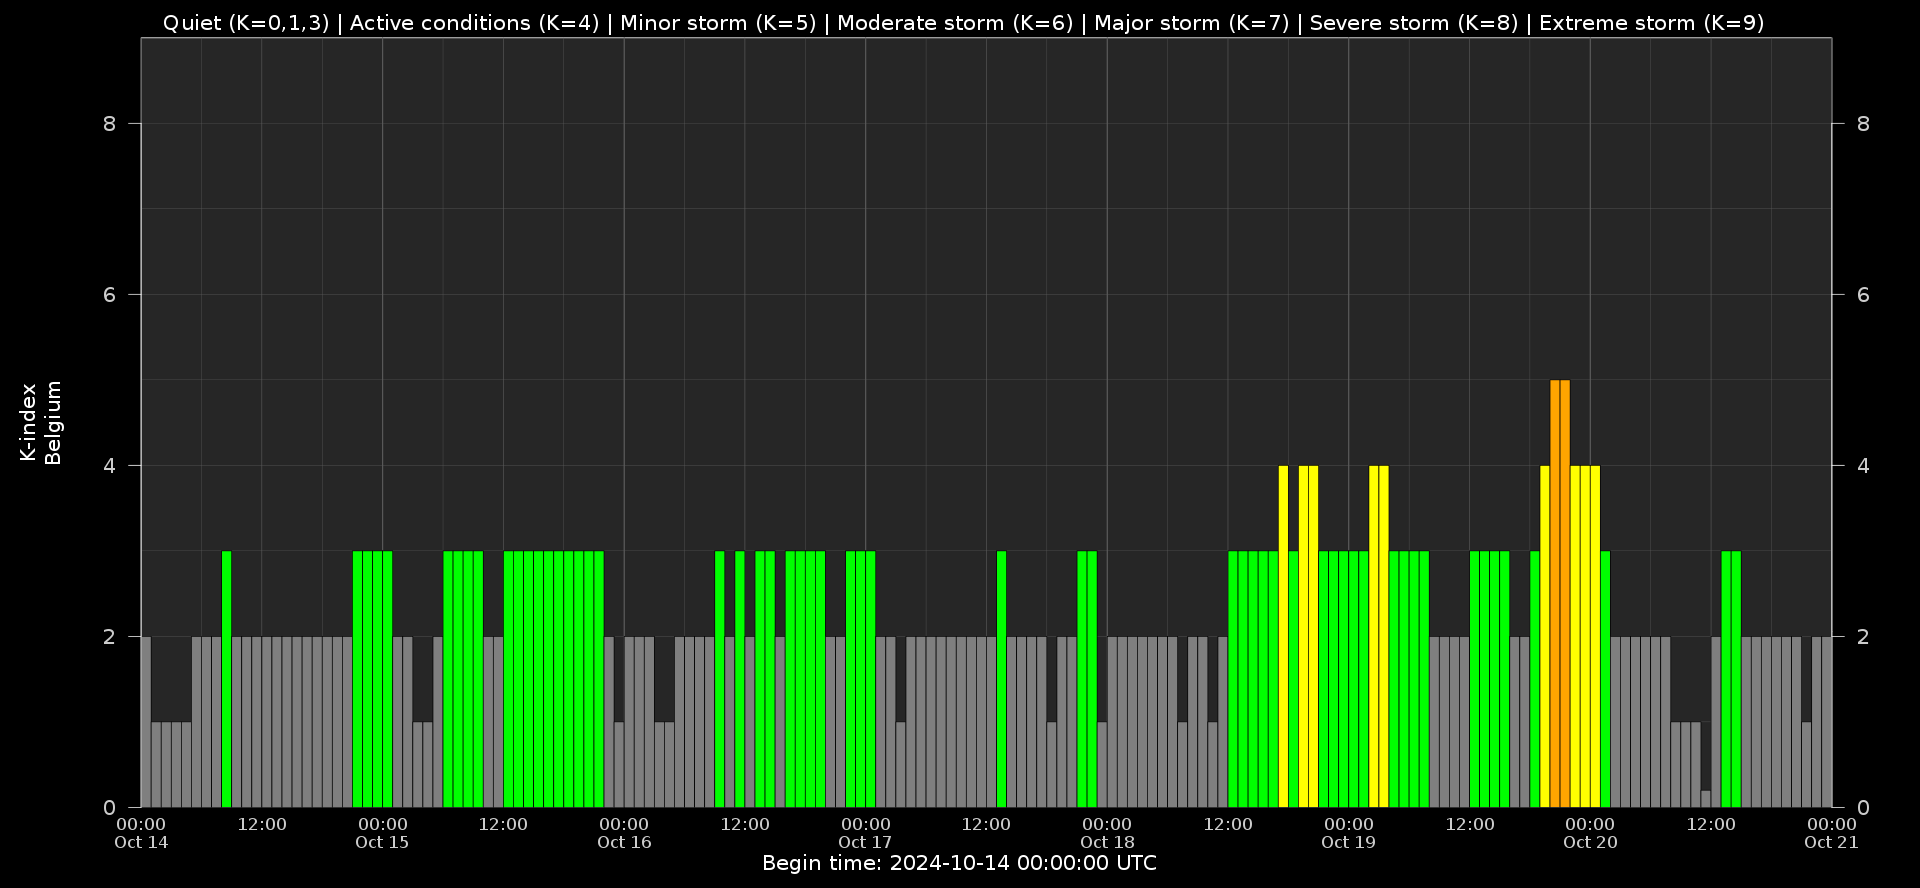
Local K-type magnetic activity index for Belgium based on data from Dourbes (DOU) and Manhay (MAB). Comparing the data from both measurement stations allows to reliably remove outliers from the magnetic data. At the same time the operational service availability is improved: whenever data from one observatory is not available, the single-station index obtained from the other can be used as a fallback system.
Both the two-station index and the single station indices are available here: http://ionosphere.meteo.be/geomagnetism/K_BEL/
The SIDC Space Weather Briefing
The Space Weather Briefing presented by the forecaster on duty from Oct 13 to 20.
The pdf of the presentation can be found here: https://www.stce.be/briefings/20241021_SWbriefing.pdf
Review of Ionospheric Activity
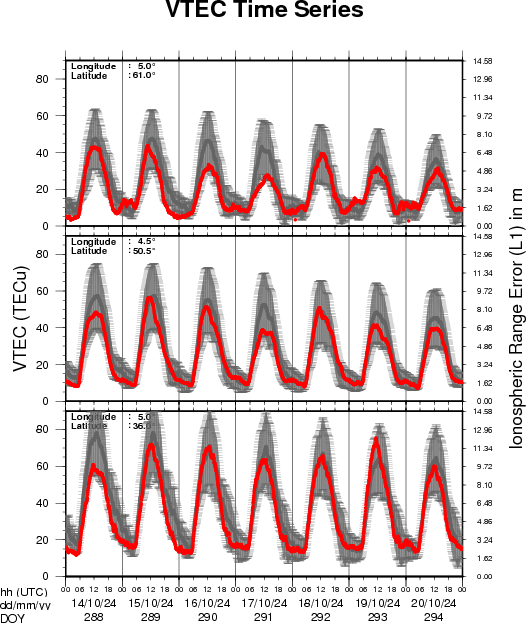
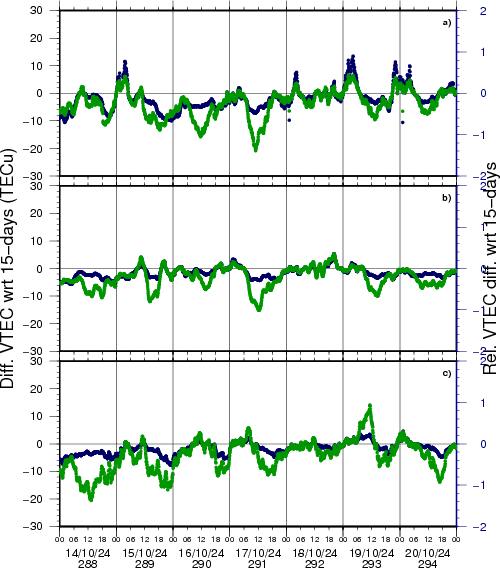
VTEC time series at 3 locations in Europe from 14 Oct 2024 till 20 Oct 2024
The top figure shows the time evolution of the Vertical Total Electron Content (VTEC) (in red) during the last week at three locations:
a) in the northern part of Europe(N 61deg E 5deg)
b) above Brussels(N 50.5deg, E 4.5 deg)
c) in the southern part of Europe(N 36 deg, E 5deg)
This top figure also shows (in grey) the normal ionospheric behaviour expected based on the median VTEC from the 15 previous days.
The time series below shows the VTEC difference (in green) and relative difference (in blue) with respect to the median of the last 15 days in the North, Mid (above Brussels) and South of Europe. It thus illustrates the VTEC deviation from normal quiet behaviour.
The VTEC is expressed in TECu (with TECu=10^16 electrons per square meter) and is directly related to the signal propagation delay due to the ionosphere (in figure: delay on GPS L1 frequency).
The Sun's radiation ionizes the Earth's upper atmosphere, the ionosphere, located from about 60km to 1000km above the Earth's surface.The ionization process in the ionosphere produces ions and free electrons. These electrons perturb the propagation of the GNSS (Global Navigation Satellite System) signals by inducing a so-called ionospheric delay.
See http://stce.be/newsletter/GNSS_final.pdf for some more explanations; for more information, see https://gnss.be/SpaceWeather
STCE Space Weather Education Centre
Courses, seminars and presentations with the Sun-Space-Earth system and Space Weather as the main theme. We provide occasions to get submerged in our world through educational, informative and instructive activities.
* Dec 5-6, STCE Course Space Weather impacts on aviation, Brussels, Belgium - Registrations are open, https://events.spacepole.be/event/205/
* Nov 4-8, European Space Weather Week, Coimbra, Portugal, https://esww2024.org/
* Jan 28-30, Role of the ionosphere and space weather in military communications, Brussels, Belgium - Registrations are open, https://events.spacepole.be/event/208/
* Mar 17-18, 2025, Inleiding tot het ruimteweer, enkel voor leden van volkssterrenwachten, Brussels, Belgium - registrations are open, https://events.spacepole.be/event/213/
* Mar 24, 2025, STCE Lecture From Physics to Forecasting, ESA Academy's Space Weather Training Course
If you want your event in the STCE newsletter, contact us: stce_coordination at stce.be

Website: https://www.stce.be/SWEC