- Table of Content
- 1.SC25 Tracking ...
- 2.PROBA-3 gazes ...
- 3.Topical Issue ...
- 4.Review of sola...
- 5.International ...
- 6.PROBA2 Observa...
- 7.Noticeable Sol...
- 8.Geomagnetic Ob...
- 9.Review of Iono...
- 10.The SIDC Space...
- 11.Upcoming Activ...
2. PROBA-3 gazes at stars
3. Topical Issue on "Space Climate" for JSWSC
4. Review of solar and geomagnetic activity
5. International Sunspot Number by SILSO
6. PROBA2 Observations
7. Noticeable Solar Events
8. Geomagnetic Observations in Belgium
9. Review of Ionospheric Activity
10. The SIDC Space Weather Briefing
11. Upcoming Activities
SC25 Tracking page updated
The STCE's SC25 Tracking page (https://www.stce.be/content/sc25-tracking ) has been updated to reflect the latest evolution of some critical space weather parameters for the ongoing solar cycle 25 (SC25). It covers various aspects of space weather, from sunspot numbers over geomagnetic indices all the way to cosmic rays. The multiple graphs allow for a comparison with previous solar cycles at similar stages in their evolution.
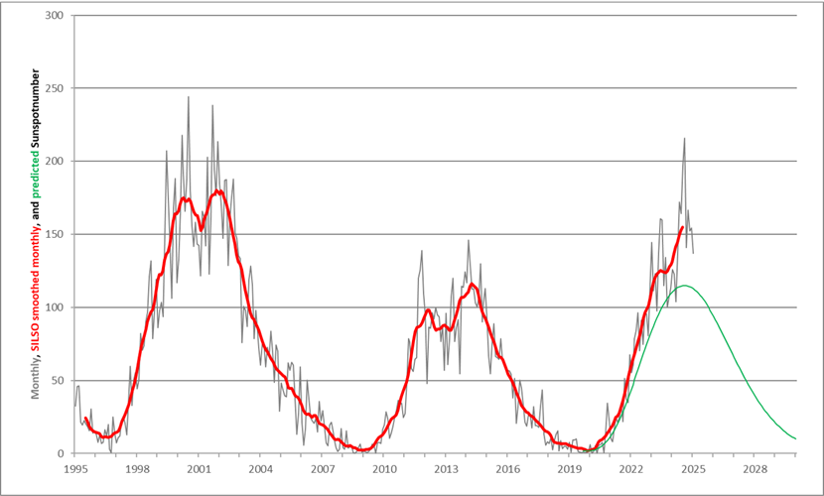
The graph below shows the monthly and SILSO smoothed monthly sunspot number (SIDC/SILSO - https://www.sidc.be/silso/) from around the start of SC23 up to the current SC25. The prediction for the ongoing solar cycle 25 which started in December 2019, is displayed in green. Following high solar activity during the first half of 2023, and even higher solar activity from April 2024 onwards, the smoothed monthly sunspot number can be seen rising to its maximum, with the SILSO predictions for SC25 maximum (12-month window; https://www.sidc.be/silso/ssngraphics ) converging to a maximum between 154 and 171 that would take place during the September-October 2024 timeframe. Thus, SC25 maximum would be well above the initial prediction by the SC25 Panel (115), but also -for the moment- well below the moderately strong SC23 (180.3).
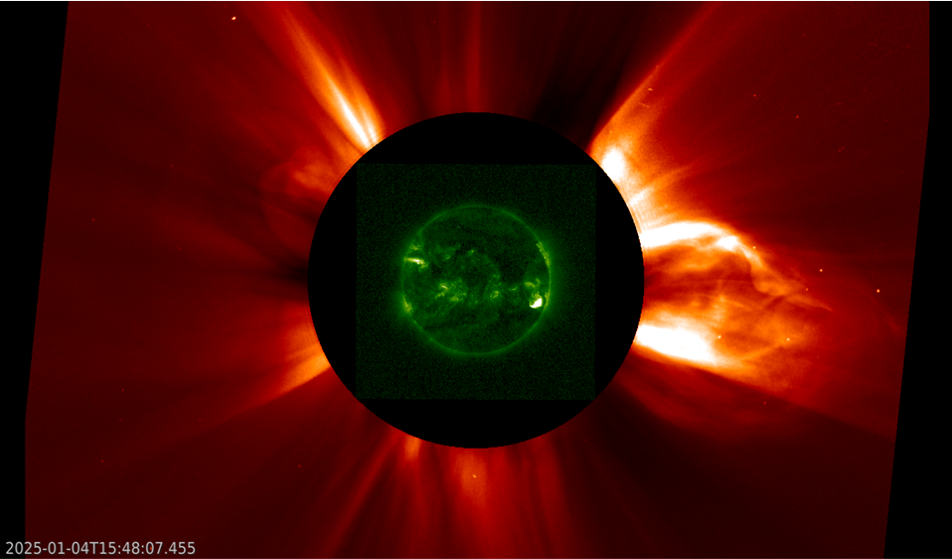
Many other parameters such as the 10.7cm radio flux, solar flaring and cosmic rays have reached values similar to SC23 or SC22, i.e. values not seen in 20 or more years. For example, the number of M- and X-class flares recorded in 2024 was at a staggering 922, which is the highest in more than 30 years. An illustration can be found underneath, when on 3 and 4 January 2025, there were no less than 3 X-class flares, as well as an M5 and an M7 event. These strong flares were all produced by NOAA 13947, located in the northeast ("upper left") solar quadrant shown in the GOES/SUVI extreme ultraviolet imagery underneath. The associated coronal mass ejections (CMEs) were not too impressive, in contrast to the much more potent CMEs that had their source mostly from C-class flaring activity in NOAA 13939, located in the southwest ("lower right") solar quadrant. The CMEs can be seen in the SOHO/LASCO C2 overlay, with a clip in the online version at https://www.stce.be/news/752/welcome.html
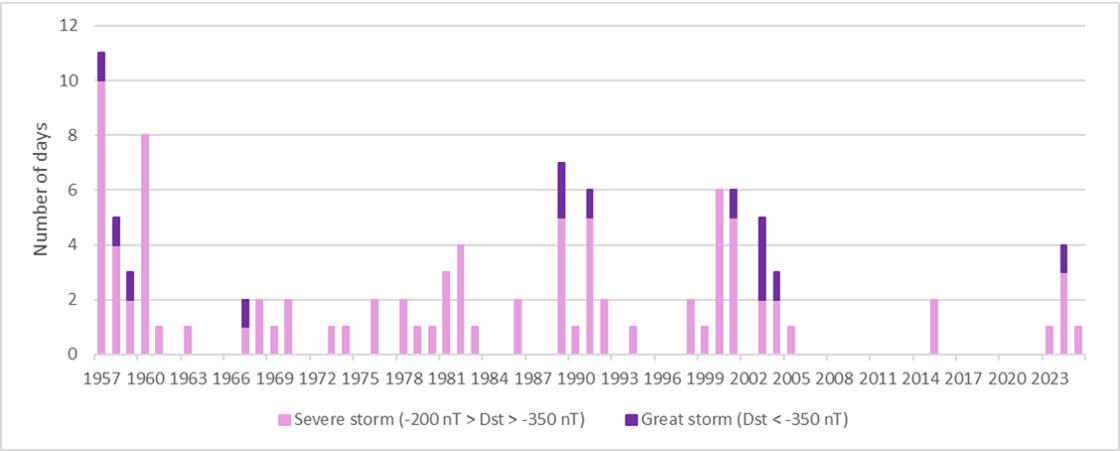
Most of these CMEs were not directed to Earth or only delivered a glancing blow, keeping the geomagnetic activity at bay. As such, the two strongest storms in SC25 so far remain the extremely severe storm of 10-11 May (Dst = -406 nT) and the severe storm of 10-11 October 2024 (Dst = -333 nT). They produced colourful polar light visible from relatively low latitudes, and impacted mainly radio communications (HF), GNSS applications and satellite atmospheric drag. The graph below shows days with strong/severe and great geomagnetic storms in terms of Dst since the start of the measurements in 1957, represented by respectively the pink and purple bars. (see also Dst terminology at https://www.stce.be/educational/classification#levelsmagn ) The drought in strong geomagnetic activity from 2005 till 2023 is eye-catching.
PROBA-3 gazes at stars
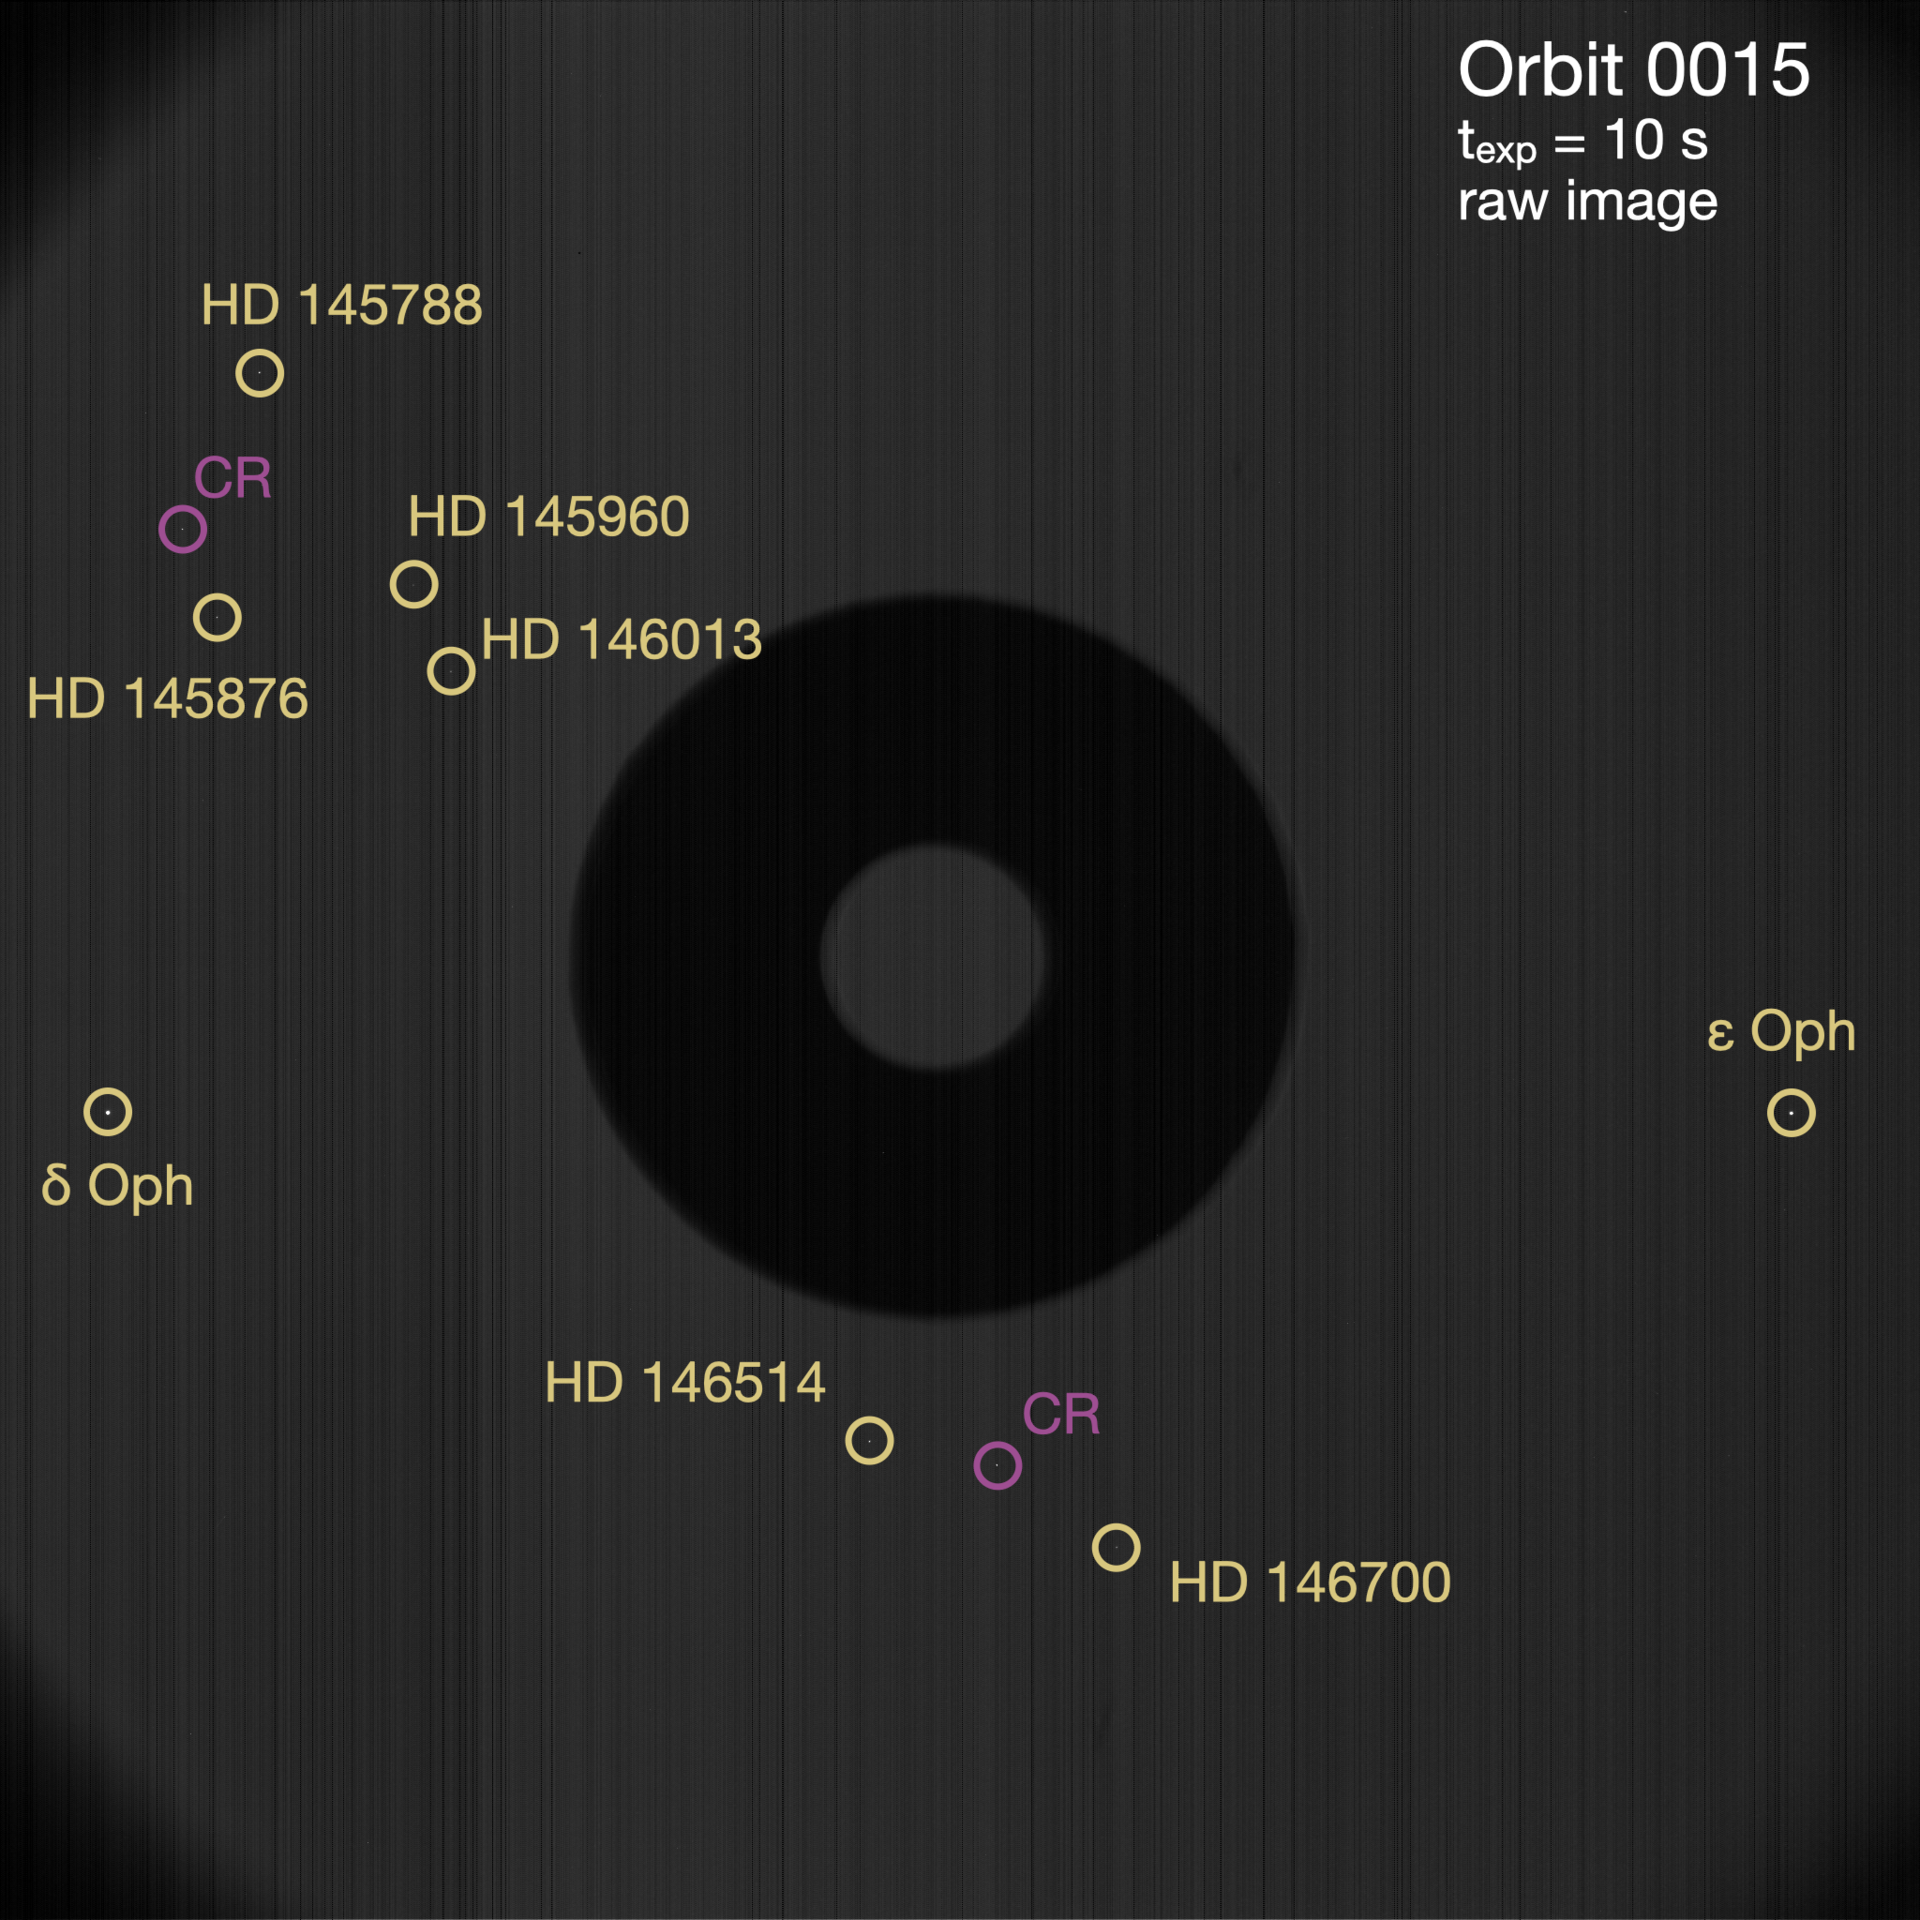
Since its launch on December 5, the PROBA-3 teams have worked tirelessly on the commissioning of the spacecraft, their subsystems and their instruments. While both spacecraft were still attached, the ASPIICS instrument was used to test their pointing.
The star field below, taken by the ASPIICS coronagraph, shows us very sharp observations of the expected constellations, which confirms not only the pointing, but also the stability of the spacecraft.
Andrei Zhukov, Principal Investigator for ASPIICS, looks ahead: "Overall, we were very pleased with the accuracy of the spacecraft pointing and the quality of the image. It made us even more excited to see the corona images, expected as early as March."
More info here: https://www.esa.int/Enabling_Support/Space_Engineering_Technology/Proba-3/Proba-3_stargazing_to_warm_up_for_corona_observations
Topical Issue on "Space Climate" for JSWSC
The Journal of Space Weather and Space Climate (JSWSC - https://www.swsc-journal.org/) opens a Topical Issue (TI) "Space Climate: Solar Extremes, Long-Term Variability, and Impacts on Earth's System", deadline 30 September 2025.
This Topical Issue was initiated at the Space Climate 9 / ISEE Joint Symposium and Sunspot Number Workshop 2024 held in Nagoya and Kyoto (Japan) in early October 2024. However, the TI is not restricted to papers presented during these conferences and is open to any relevant submissions addressing the questions listed below.
This TI invites contributions aiming at understanding long-term solar variability and solar extremes (in terms of particle events and solar grand minimum/maximum states) as well as their effects on the heliosphere, Earth's space environment, atmosphere, and climate. This, in particular, includes the following research topics:
- Understanding the causes and manifestations of long-term solar activity variations;
- Examining the short- and long-term influence of solar activity variations on the Earth's system;
- Recovering and deciphering historical archives of solar activity and solar storms;
- (Re-)calibration of solar activity indices, in particular of sunspot number.
We welcome manuscripts considering these aspects of Space Climate. The manuscripts must be submitted via the JSWSC online submission tool. Guidelines for the submission of papers and information about article processing charges can be found on the JSWSC website under the tab "Instruction for Authors".
Deadline: 30 September 2025
All manuscripts will be peer-reviewed according to the quality standards of international scientific journals. The type of contributions must fit the style of JSWSC. All manuscripts should contain enough new insights, present the results against a properly referenced background of existing work, and present adequate evidence that supports the conclusions.
Papers will be published immediately upon acceptance, without waiting for the TI closure, in electronic format only, and will be freely available to everyone via the JSWSC website. JSWSC offers the possibility to include electronic material, such as animations, movies, codes and data.
For questions regarding this Topical Issue, please contact the T-EiCs. For questions concerning the submission process, please contact the Editorial Office (jswsc(at)edpsciences.org).
Topical Editors-in-Chief (T-EiC):
- Hisashi Hayakawa (hisashi(at)nagoya-u.jp) Institute for Space-Earth Environmental Research, Nagoya University, Nagoya, Japan; Institute for Advanced Research, Nagoya University, Nagoya, Japan; Space Physics and Operations Division, RAL Space, Science and Technology Facilities Council, Rutherford Appleton Laboratory, Harwell Oxford, Didcot, Oxfordshire, UK; Riken, Nishina Centre, Wako, Japan
- Theodosios Chatzistergos (chatzistergos(at)mps.mpg.de) Max Planck Institute for Solar System Research, Göttingen, Germany
Topical Editors (TE):
- Sabrina Bechet, Royal Observatory of Belgium, Belgium
- Prantika Bhowmik, Indian Institute of Science, India
- Irina Mironova, St. Petersburg State University, Russia
- Eugene Rozanov, PMOD, Switzerland
Review of solar and geomagnetic activity
Solar Active Regions and flares
Seventeen (17) active regions (ARs) were observed on the side of the Sun facing the Earth, ranging from SIDC 342 (NOAA 3989) to SIDC 413 (NOAA 4005). We had 7 M-class flares and 1 X-class flare. The strongest flare of the week was an X2.0 from SIDC sunspot group 410/NOAA AR 4001, peaking at 19:27 UTC on 23 February.
Coronal mass ejections
Numerous CMEs were observed during the week. A wide CME was observed leaving the Sun on 00:24 UTC on 20 February with a possible Earth-directed component. A backsided partial halo CME was observed on 23 February, related to the X2.0 flare at 19:27 UTC.
Coronal Holes
Only high latitude coronal holes transited the central meridian during the week.
Proton flux levels
The greater than 10 MeV proton flux was below the threshold level over the week. It had a small increase on 21 February, but did not pass the threshold. Warning conditions were established after that, due to several significant ARs in the western hemisphere.
Electron fluxes at GEO
The greater than 2 MeV electron flux measured by GOES 16-18 was above the threshold every day until 19 February, and it remained below afterwards.
The 24-hour electron fluence was at normal levels.
Solar wind
The week started with the Earth inside a fast solar wind stream. Then on 19 February an increase in the magnetic field may mark a possible arrival of a CME from the previous week (16 February). Afterwards slow solar wind conditions prevailed until 21:00 UT on 23 February, when the ICME corresponding to the 20 February CME arrived to the Earth.
Geomagnetism
The week saw mostly quiet to unsettled levels both locally and globally (Kp and K_Bel up to 3), except for a few periods with active conditions (Kp and K_Bel up to 4) due to the HSS that influenced the Earth at the beginning of the week. The ICME arriving on 19 December created minor storm conditions globally (Kp up to 5, K_Bel up to 4).
International Sunspot Number by SILSO

The daily Estimated International Sunspot Number (EISN, red curve with shaded error) derived by a simplified method from real-time data from the worldwide SILSO network. It extends the official Sunspot Number from the full processing of the preceding month (green line), a few days more than one solar rotation. The horizontal blue line shows the current monthly average. The yellow dots give the number of stations that provided valid data. Valid data are used to calculate the EISN. The triangle gives the number of stations providing data. When a triangle and a yellow dot coincide, it means that all the data is used to calculate the EISN of that day.
PROBA2 Observations
Solar Activity
Solar flare activity fluctuated from low to high during the week.
In order to view the activity of this week in more detail, we suggest to go to the following website from which all the daily (normal and difference) movies can be accessed: https://proba2.oma.be/ssa
This page also lists the recorded flaring events.
A weekly overview movie can be found here (SWAP week 778). http://proba2.oma.be/swap/data/mpg/movies/weekly_movies/weekly_movie_2025_02_17.mp4
Details about some of this week's events can be found further below.
If any of the linked movies are unavailable they can be found in the P2SC movie repository here: https://proba2.sidc.be/swap/data/mpg/movies/
Friday Feb 21
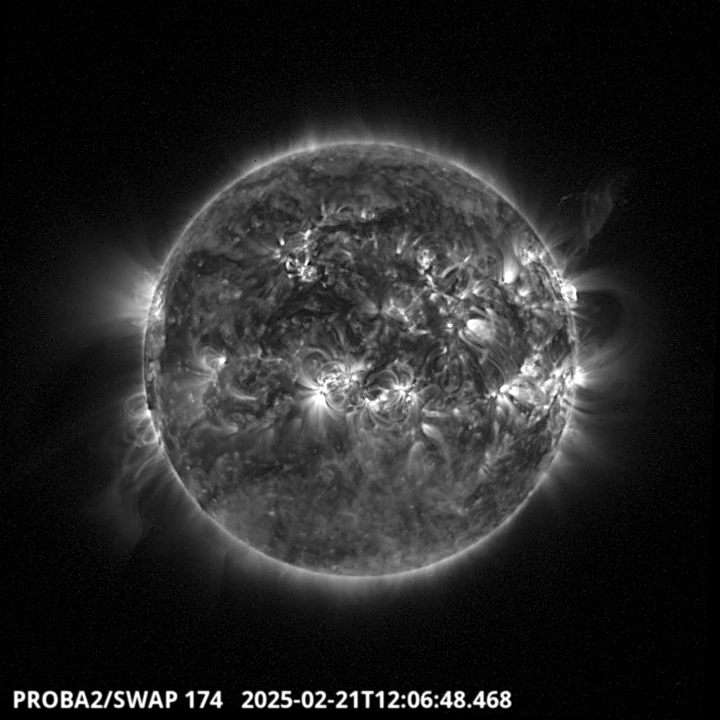
On the North-West limb of the solar disk, a filament erupted around 12:06 UT.
Find a SWAP movie of the event here: https://proba2.sidc.be/swap/movies/20250221_swap_movie.mp4
Sunday Feb 23
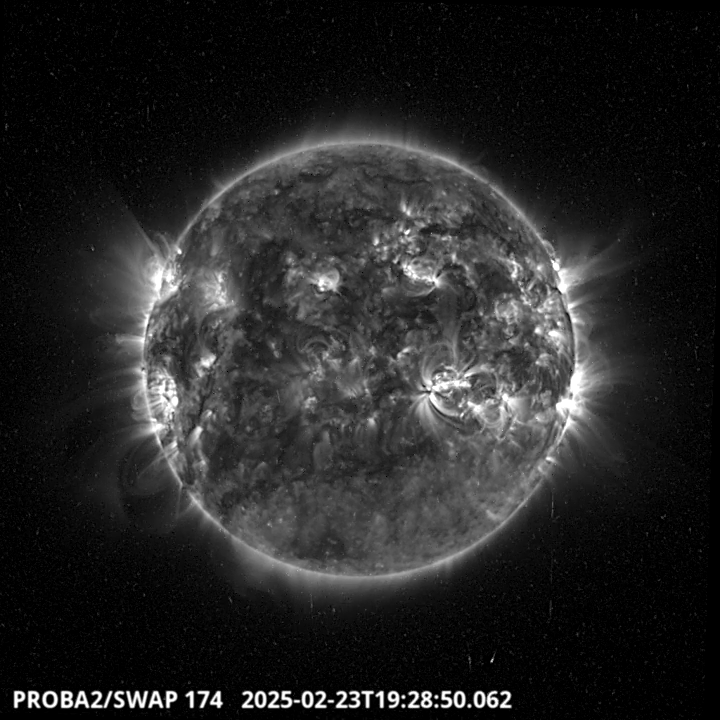
The largest flare of the week is a X2.0. It was produced by the NOAA active region 4001 around 19:29. The active region was located just behind the North-West part of the solar disc.
Find a SWAP movie of the event here: https://proba2.sidc.be/swap/movies/20250223_swap_movie.mp4
Noticeable Solar Events
| DAY | BEGIN | MAX | END | LOC | XRAY | OP | 10CM | TYPE | Cat | NOAA |
| 17 | 1507 | 1513 | 1523 | S5W76 | M1.0 | SF | 35 | 3992 | ||
| 21 | 1205 | 1215 | 1219 | N18E17 | M3.3 | 1B | III/1VI/1CTM/1 | 4000 | ||
| 21 | 1431 | 1435 | 1439 | N18E16 | M1.4 | SN | III/2 | 4000 | ||
| 23 | 0200 | 0213 | 0223 | M4.9 | III/2 | 4001 | ||||
| 23 | 0954 | 0956 | 1001 | M1.0 | 49 | 3998 | ||||
| 23 | 1147 | 1158 | 1207 | M1.6 | 4001 | |||||
| 23 | 1618 | 1635 | 1651 | S12W23 | M1.0 | SN | 49 | 3998 | ||
| 23 | 1922 | 1927 | 1934 | X2.0 | III/2CTM/1 | 4001 |
| LOC: approximate heliographic location | TYPE: radio burst type |
| XRAY: X-ray flare class | Cat: Catania sunspot group number |
| OP: optical flare class | NOAA: NOAA active region number |
| 10CM: peak 10 cm radio flux |
Geomagnetic Observations in Belgium

Local K-type magnetic activity index for Belgium based on data from Dourbes (DOU) and Manhay (MAB). Comparing the data from both measurement stations allows to reliably remove outliers from the magnetic data. At the same time the operational service availability is improved: whenever data from one observatory is not available, the single-station index obtained from the other can be used as a fallback system.
Both the two-station index and the single station indices are available here: http://ionosphere.meteo.be/geomagnetism/K_BEL/
Review of Ionospheric Activity

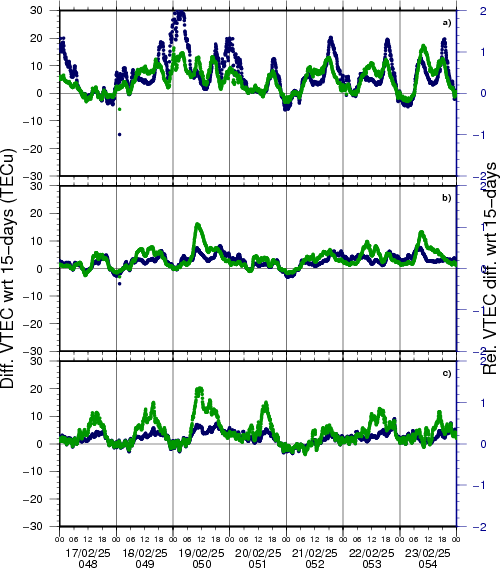
VTEC time series at 3 locations in Europe from 17 Feb 2025 till 23 Feb 2025
The top figure shows the time evolution of the Vertical Total Electron Content (VTEC) (in red) during the last week at three locations:
a) in the northern part of Europe(N 61deg E 5deg)
b) above Brussels(N 50.5deg, E 4.5 deg)
c) in the southern part of Europe(N 36 deg, E 5deg)
This top figure also shows (in grey) the normal ionospheric behaviour expected based on the median VTEC from the 15 previous days.
The time series below shows the VTEC difference (in green) and relative difference (in blue) with respect to the median of the last 15 days in the North, Mid (above Brussels) and South of Europe. It thus illustrates the VTEC deviation from normal quiet behaviour.
The VTEC is expressed in TECu (with TECu=10^16 electrons per square meter) and is directly related to the signal propagation delay due to the ionosphere (in figure: delay on GPS L1 frequency).
The Sun's radiation ionizes the Earth's upper atmosphere, the ionosphere, located from about 60km to 1000km above the Earth's surface.The ionization process in the ionosphere produces ions and free electrons. These electrons perturb the propagation of the GNSS (Global Navigation Satellite System) signals by inducing a so-called ionospheric delay.
See http://stce.be/newsletter/GNSS_final.pdf for some more explanations; for more information, see https://gnss.be/SpaceWeather
The SIDC Space Weather Briefing
The forecaster on duty presented the SIDC briefing that gives an overview of space weather from February 17 to 23.
The pdf of the presentation can be found here: https://www.stce.be/briefings/20250224_SWbriefing.pdf
Upcoming Activities
Courses, seminars and presentations with the Sun-Space-Earth system and Space Weather as the main theme. We provide occasions to get submerged in our world through educational, informative and instructive activities.
* Mar 17-18, 2025, Inleiding tot het ruimteweer, enkel voor leden van volkssterrenwachten, Brussels, Belgium - register: https://events.spacepole.be/event/213/ - 1 stoel vrij
* Mar 24, 2025, STCE Lecture From Physics to Forecasting, ESA Academy's Space Weather Training Course
* April 28-30, 2025, STCE Space Weather Introductory Course, Brussels, Belgium - register: https://events.spacepole.be/event/214/
* May 26-27, 2025, STCE Course Space Weather impacts on aviation, online - register: https://events.spacepole.be/event/215/
* Jun 23-25, 2025, STCE Space Weather Introductory Course, Brussels, Belgium - register: https://events.spacepole.be/event/216/
* Sep 15-16, 2025, STCE Course Space Weather impacts on aviation, online - register: https://events.spacepole.be/event/218/
* Nov 17-19, 2025, STCE Space Weather Introductory Course, Brussels, Belgium - register: https://events.spacepole.be/event/217/
To register for a course and check the seminar details, navigate to the STCE Space Weather Education Center: https://www.stce.be/SWEC
If you want your event in the STCE newsletter, contact us: stce_coordination at stce.be

Website: https://www.stce.be/SWEC