- Table of Content
- 1.Large coronal ...
- 2.Proba-3's firs...
- 3.The next gener...
- 4.The STCE in 20...
- 5.Review of sola...
- 6.International ...
- 7.PROBA2 Observa...
- 8.Noticeable Sol...
- 9.Geomagnetic Ob...
- 10.Review of Iono...
- 11.The SIDC Space...
- 12.Upcoming Activ...
2. Proba-3's first autonomous formation flight
3. The next generation of space weather experts visiting
4. The STCE in 2023
5. Review of solar and geomagnetic activity
6. International Sunspot Number by SILSO
7. PROBA2 Observations
8. Noticeable Solar Events
9. Geomagnetic Observations in Belgium
10. Review of Ionospheric Activity
11. The SIDC Space Weather Briefing
12. Upcoming Activities
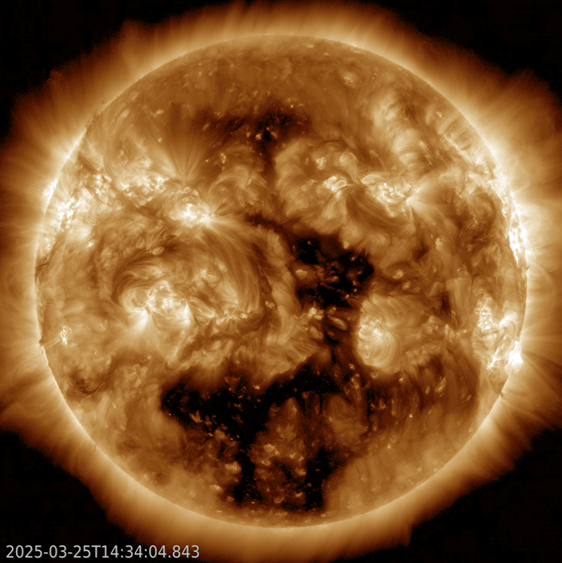
Large coronal hole
Coronal holes are regions in the hot solar atmosphere ("corona") where the plasma density at that temperature is very low compared to its surroundings, and thus they look like dark shapes in the corona. Linked to unipolar, open magnetic fields stretching into space, they are the source of the high-speed solar wind which can create geomagnetic disturbances. A large CH, emanating from the southern solar pole and reaching out all the way to the solar equator, started transiting the Sun's central meridian on 23 March. The CH had a positive magnetic polarity, i.e. the magnetic fields were pointing away from the Sun. The impressive size of the CH can be gauged from the SDO/AIA image underneath, showing the Sun in extreme ultraviolet (EUV) at temperatures of more than 1 million degrees. The coronal hole is the irregular, dark shape in the lower portion of the solar image.
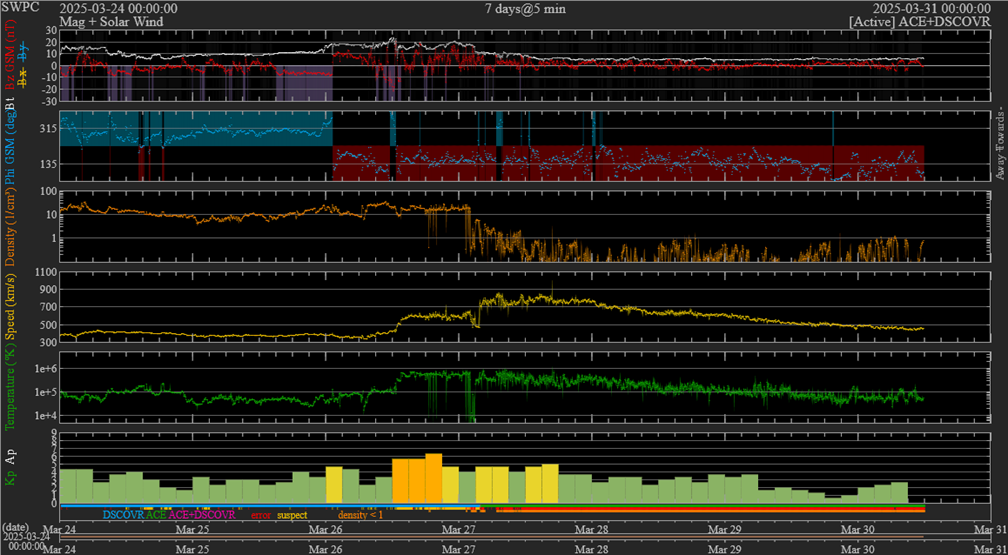
The associated high speed stream (HSS), preceded by a compression region (CIR - see the STCE newsitem at https://www.stce.be/news/269/welcome.html ), started to influence the earth environment from 26 March onwards. Moderate geomagnetic storming was observed during the second half of 26 March. The solar wind speed gradually increased from about 350 km/s to values around 830 km/s (yellow curve in the DSCOVR graph of solar wind data underneath). Such a high velocity -from a CH- has not been since the declining phase of the previous solar cycle.
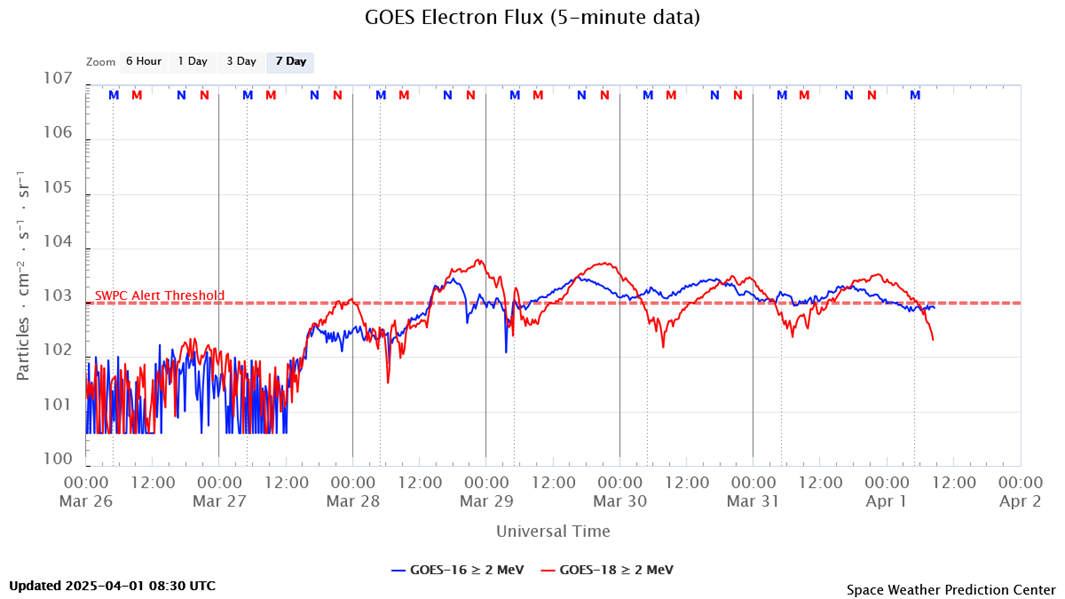
The wind speed stayed above the critical threshold of about 500 km/s from 26 March to late on 29 March. This drove the greater than 2 MeV electron flux over the 1000 pfu alert threshold from 28 March onwards (GOES graph underneath; "M" = local midnight, "N" = local noon). Satellite operators keep an eye on the number of these particles, because these energetic electrons can penetrate into spacecraft components and result in a build-up of charge within the material. When the accumulated charge becomes sufficiently high, an electrostatic discharge (ESD) or arching can occur. This discharge can cause anomalous behaviour in spacecraft systems and can result in temporary or permanent loss of functionality. A notable example of satellite damage due to ESD is the consecutive outage of Telesat Canada's Anik-E1 and Anik-E2 geostationary communication satellites on 20 January 1994 that interrupted telecommunication and data transmission services across Canada (Lam, 2017 - https://doi.org/10.1002/2016SW001492 ). A view on the evolution of these highly energetic electrons during this solar cycle is at the STCE's SC25 Tracking page at https://www.stce.be/content/sc25-tracking#electron
Proba-3's first autonomous formation flight
Two spacecraft flying as one: that is the goal of European Space Agency's Proba-3 mission. Earlier this week, the eclipse-maker moved a step closer to achieving that goal, as both spacecraft aligned with the Sun, maintaining their relative position for several hours without any control from the ground.

The next generation of space weather experts visiting
On March 26, 30 students that were selected for the 2025 edition of ESA's Space Weather Training Course visited the STCE. Together, we explored ground-based solar and radio observations, various solar space instruments and different space weather services. This is how we lay the foundations for the next generation of space weather researchers and operators.
.jpg)
The STCE in 2023
The STCE Annual Report 2023 is now available at https://www.stce.be/annualReport
It is a compilation of the activities done in 2023 within the frame of the Solar-Terrestrial Centre of Excellence (STCE). This report continues the style from the previous editions. Hence, as it is targeting a more general public, it presents only a selection of the 2023-activities in easy-to-digest summaries.
These bite-sized articles emphasize the intense collaboration between the institutes at the Space Pole, as well as with our external partners. Aside the usual topics such as the space weather highlights, public outreach, and listings with conference talks and science papers, it covers also contributions on e.g. the Open Doors at the Humain radioastronomy station, the effects of Solar Energetic Particle (SEP) events on the radiation belts, auroral research from Skibotn (Sweden), the Earth radiation balance dataset (2018 to 2023), deep dielectric spacecraft charging, the classification of sunspot groups,... and much more.
We wish you an enjoyable reading experience!
Review of solar and geomagnetic activity
WEEK 1265 from 2025 Mar 24
Solar Active Regions and flares
Over the past week, the solar flaring activity was low at the beginning and increased to moderate to high levels later. There were 14 numbered active regions (ARs) on the visible solar disk throughout the week which produced 13 M-class flares and 1 X-class flare. The largest flare was an X1.1 flare (SIDC Flare 3932) peaking at 15:21 UTC on March 28, which was produced by SIDC Sunspot Group 459 (NOAA Active Region 4046). SIDC Sunspot Groups 455, 459, and 461 (NOAA Active Regions 4043, 4046, and 4048) were the regions which produced several C-class and M-class flares at the end of week.
Coronal mass ejections
A partial halo coronal mass ejection (CME) was observed in the SOHO/LASCO-C2 images around 15:24 on Mar 28. This CME was associated with an X1.1 flare (peak: 15:21 UTC, N06 E83, SIDC Flare 3932) produced by SIDC Sunspot Group 459 (NOAA Active Region 4046) and a nearby possible filament eruption. It had a speed of about 1150 km/s. Associated type IV radio emission was detected starting from 15:14 UTC on Mar 28. A glancing blow was expected at Earth around 00:00 UTC on Mar 31 and it possibly arrived at 10:16 UTC on March 31.
Coronal Holes
During the last week, three positive polarity coronal holes (SIDC Coronal Holes 60, 82, and 96) crossed the central meridian. These coronal holes were the extension of southern polar coronal hole extending all across the solar equator. A CIR and following high speed streams related to these coronal holes enhanced the solar wind parameters near Earth during Mar 26-30.
Proton flux levels
The greater than 10 MeV GOES proton flux remained below the 10 pfu threshold level over the past week. It started to increase at 02:00 UTC on Mar 30 which was possibly associated with flaring activity from SIDC Sunspot Group 461 (NOAA Active Region 4048), but it still remained below the threshold level.
Electron fluxes at GEO
The greater than 2 MeV electron flux, as measured by the GOES-18 satellite, was above the threshold level for few hours on Mar 23 and during 27-30. The greater than 2 MeV electron flux measured by the GOES-16 satellite remained below the 1000 pfu threshold level until 14:00 UTC on Mar 28. Later it remained above the threshold level almost continuously until the end of the week.
The 24h electron fluence was at normal level till Mar 28 and it was at moderate level during Mar 28-30.
Solar wind
At the beginning of the past week, the solar wind parameters were disturbed under the influence of an interplanetary coronal mass ejection (ICME) associated to a CME that departed the Sun on Mar 21. The solar wind speed was as high as 450 km/s and the interplanetary magnetic field (IMF) reaching 17 nT and North-South component (Bz) down to -9 nT.
The solar wind parameters were slightly enhanced during the midnight of Mar 25-26 which was possibly associated to the arrival of a weak ICME.
A CIR and following high speed streams (HSSs), related to the three positive-polarity coronal holes (SIDC Coronal Holes 60, 82, and 96) that crossed the central meridian during Mar 22-28, enhanced the solar wind parameters near Earth during Mar 26-30. Following the arrival of HSSs, the solar wind speed was as high as 870 km/s with the IMF reaching 29 nT and Bz down to -28 nT.
At the end of the week, solar wind parameters transitioned from fast to slow solar wind regime.
Geomagnetism
At the start of the past week, geomagnetic conditions reached active conditions (NOAA Kp and K_BEL 1 to 4) both globally and locally, due to the impact of an interplanetary coronal mass ejection (ICME) associated to a CME that departed the Sun on Mar 21.
During the midnight of Mar 25-26, geomagnetic conditions reached minor storm levels (NOAA Kp=5) globally and active conditions (K_BEL=4) locally, possibly due to the arrival of a weak ICME.
The geomagnetic conditions were further disturbed during Mar 26-29 due to a CIR followed by high speed streams (HSSs), which were related to the three positive-polarity coronal holes (SIDC Coronal Holes 60, 82, and 96) that crossed the central meridian during Mar 22-28. With the arrival of HSSs, geomagnetic conditions reached moderate storm levels (NOAA Kp=6) globally and minor storm levels (K_BEL=5) locally on Mar 26, and it returned to quiet levels on Mar 29.
International Sunspot Number by SILSO

The daily Estimated International Sunspot Number (EISN, red curve with shaded error) derived by a simplified method from real-time data from the worldwide SILSO network. It extends the official Sunspot Number from the full processing of the preceding month (green line), a few days more than one solar rotation. The horizontal blue line shows the current monthly average. The yellow dots give the number of stations that provided valid data. Valid data are used to calculate the EISN. The triangle gives the number of stations providing data. When a triangle and a yellow dot coincide, it means that all the data is used to calculate the EISN of that day.
PROBA2 Observations
Solar Activity
Solar flare activity fluctuated from low to high during the week.
In order to view the activity of this week in more detail, we suggest to go to the following website from which all the daily (normal and difference) movies can be accessed: https://proba2.oma.be/ssa
This page also lists the recorded flaring events.
A weekly overview movie (SWAP week 783) can be found here: https://proba2.sidc.be/swap/data/mpg/movies/weekly_movies/weekly_movie_2025_03_24.mp4.
Details about some of this week's events can be found further below.
If any of the linked movies are unavailable they can be found in the P2SC movie repository here: https://proba2.oma.be/swap/data/mpg/movies/.
Friday March 28
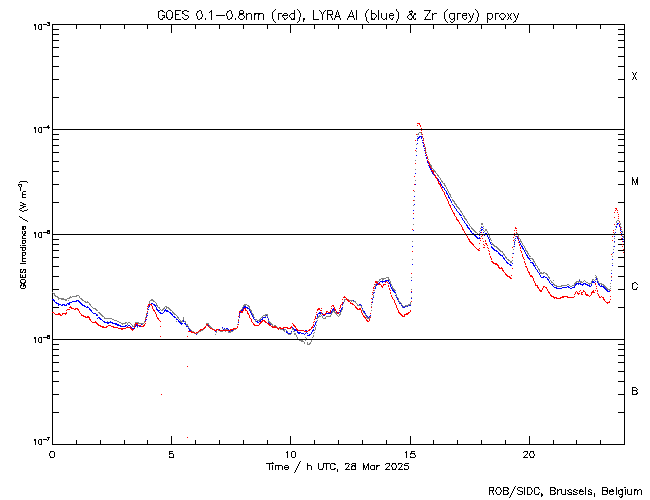
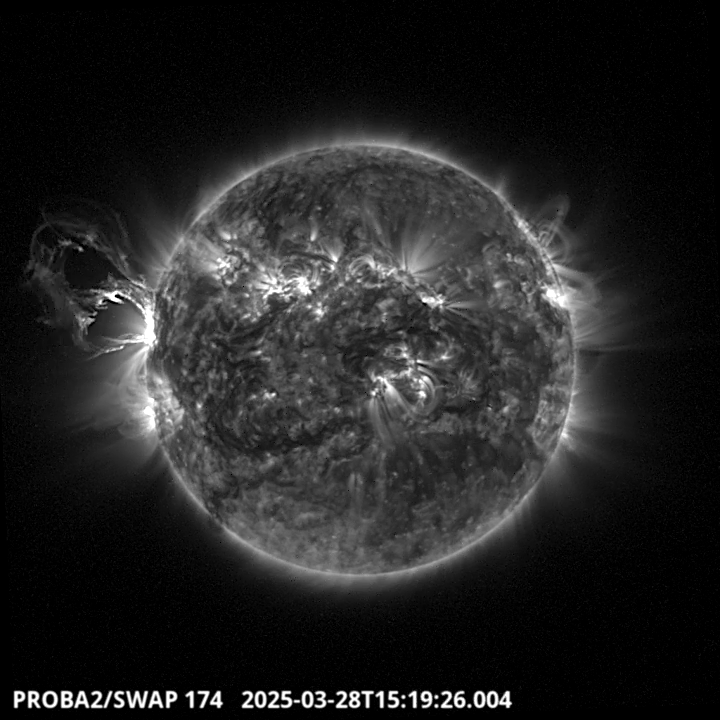
The largest flare of this week was an X1.1, and it was observed by LYRA (top panel) and SWAP (bottom panel). The flare peaked on 2025-Mar-28 at 15:21 UT and it was associated with a large prominence eruption. It occurred at the eastern limb of the Sun, originating from active region NOAA4046.
Find a SWAP movie of the event here: https://proba2.sidc.be/swap/movies/20250328_swap_movie.mp4.
Saturday March 29
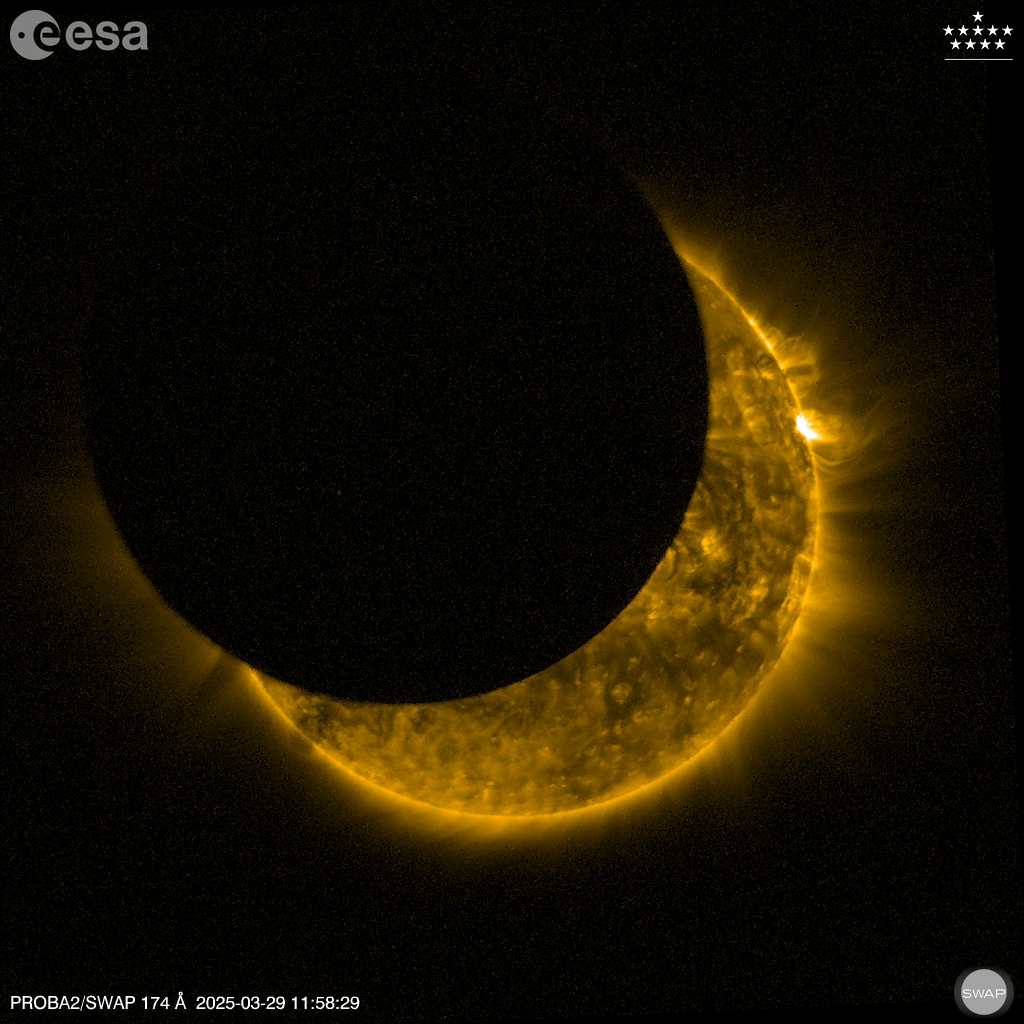
On March 29 a partial solar eclipse was primarily visible in North America, and parts of Asia, Africa and Europe. Given the satellite's orbit, PROBA2 passed twice through the shadow of the Moon, and the first pass had an almost 100% coverage. Sadly, due to a minor under-voltage issue, SWAP and LYRA turned off at the time of the greatest eclipse and the scientific data were lost. SWAP automatically turned back on following the commands issued for the second passage of the Moon, and observed a 70% eclipsed Sun. Here you can enjoy a movie of the SWAP observations taken during this pass: https://proba2.sidc.be/Events/2025-Mar-29-SolarEclipse/movies/swap_eclipse_2025_03_29_logos_lossless.mp4. Unfortunately, the LYRA instrument was unavailable for several hours, resulting in a lack of data for this event.
Noticeable Solar Events
| DAY | BEGIN | MAX | END | LOC | XRAY | OP | 10CM | TYPE | Cat | NOAA |
| 26 | 0744 | 0809 | 0821 | M1.0 | 4043 | |||||
| 27 | 0018 | 0037 | 0051 | M2.0 | 4043 | |||||
| 28 | 1503 | 1521 | 1542 | X1.1 | IV/2 | 4046 | ||||
| 28 | 1754 | 1801 | 1805 | N2E76 | M1.0 | S | 4046 | |||
| 28 | 1914 | 1926 | 1938 | M1.1 | ||||||
| 28 | 2320 | 2339 | 2353 | M1.7 | 4048 | |||||
| 29 | 2119 | 2138 | 2209 | M1.4 | 10 | 4043 | ||||
| 29 | 2238 | 2300 | 2321 | M1.9 | 4048 | |||||
| 30 | 0119 | 0148 | 0201 | M1.5 | 4048 | |||||
| 30 | 1627 | 1642 | 1700 | M1.6 | 4048 | |||||
| 30 | 1700 | 1707 | 1714 | M1.4 | 4048 | |||||
| 30 | 2243 | 2250 | 2256 | M1.4 | 4048 | |||||
| 30 | 2310 | 2319 | 2331 | M1.5 | III/2VI/2 | 4048 | ||||
| 30 | 2341 | 2348 | 2352 | M1.0 | 4048 |
| LOC: approximate heliographic location | TYPE: radio burst type |
| XRAY: X-ray flare class | Cat: Catania sunspot group number |
| OP: optical flare class | NOAA: NOAA active region number |
| 10CM: peak 10 cm radio flux |
Geomagnetic Observations in Belgium
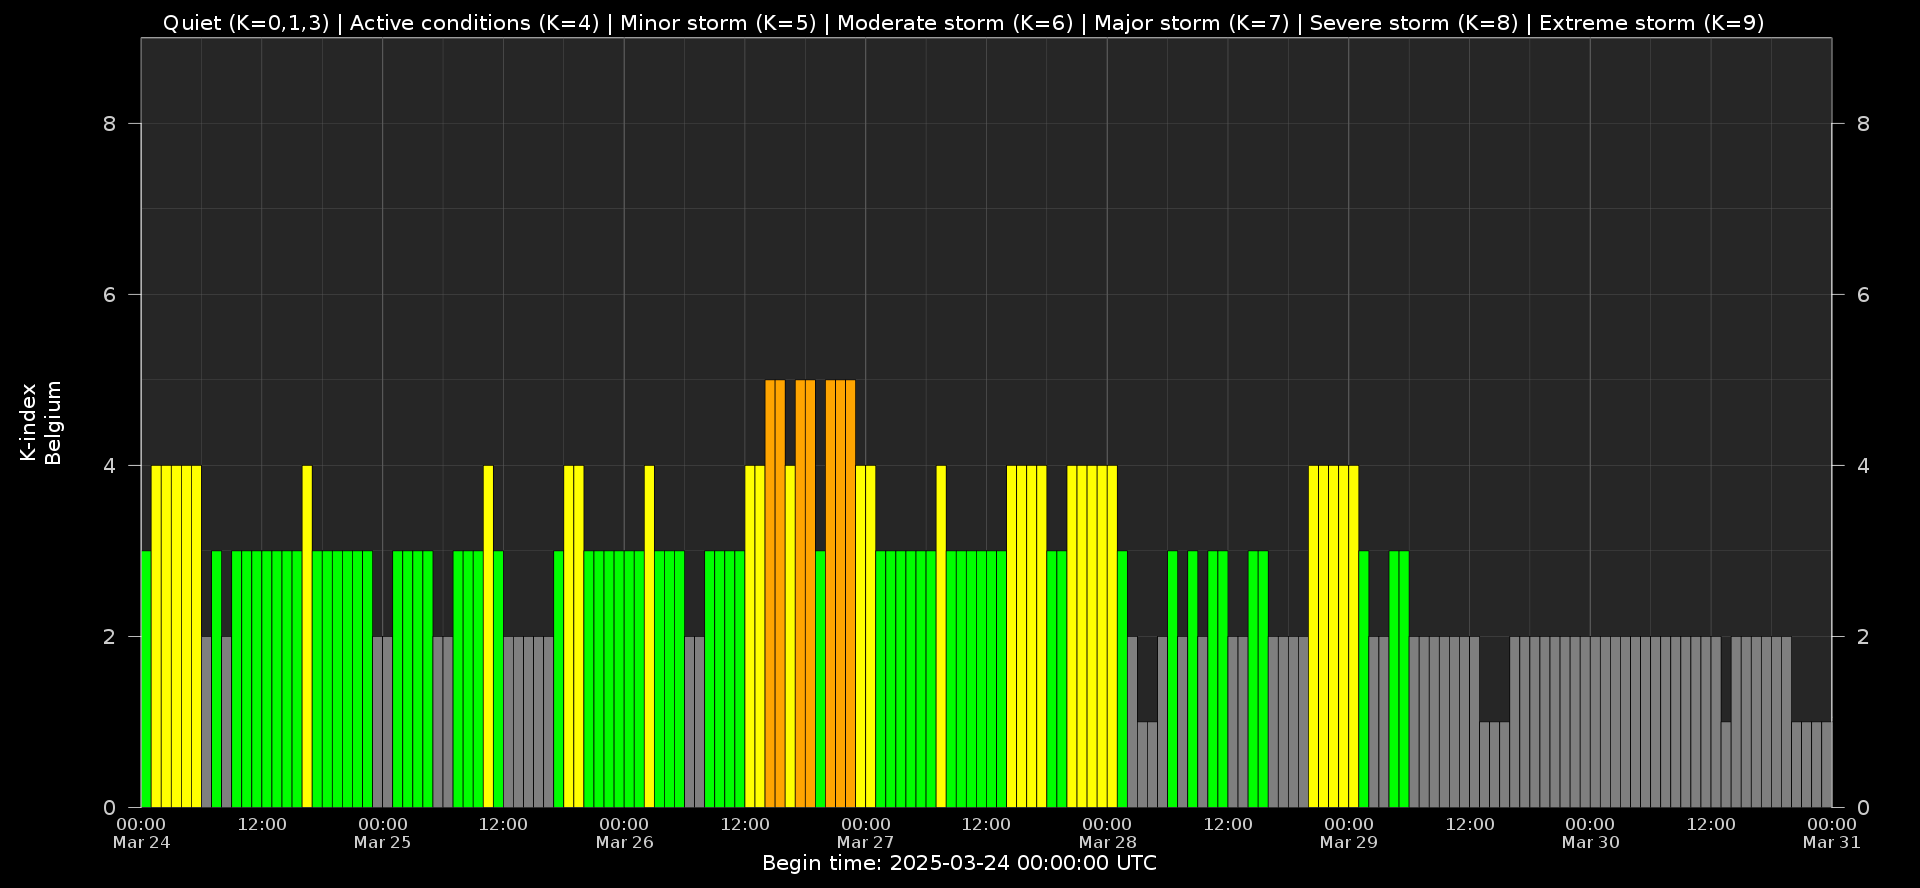
Local K-type magnetic activity index for Belgium based on data from Dourbes (DOU) and Manhay (MAB). Comparing the data from both measurement stations allows to reliably remove outliers from the magnetic data. At the same time the operational service availability is improved: whenever data from one observatory is not available, the single-station index obtained from the other can be used as a fallback system.
Both the two-station index and the single station indices are available here: http://ionosphere.meteo.be/geomagnetism/K_BEL/
Review of Ionospheric Activity


VTEC time series at 3 locations in Europe from 24 Mar 2025 till 30 Mar 2025
The top figure shows the time evolution of the Vertical Total Electron Content (VTEC) (in red) during the last week at three locations:
a) in the northern part of Europe(N 61deg E 5deg)
b) above Brussels(N 50.5deg, E 4.5 deg)
c) in the southern part of Europe(N 36 deg, E 5deg)
This top figure also shows (in grey) the normal ionospheric behaviour expected based on the median VTEC from the 15 previous days.
The time series below shows the VTEC difference (in green) and relative difference (in blue) with respect to the median of the last 15 days in the North, Mid (above Brussels) and South of Europe. It thus illustrates the VTEC deviation from normal quiet behaviour.
The VTEC is expressed in TECu (with TECu=10^16 electrons per square meter) and is directly related to the signal propagation delay due to the ionosphere (in figure: delay on GPS L1 frequency).
The Sun's radiation ionizes the Earth's upper atmosphere, the ionosphere, located from about 60km to 1000km above the Earth's surface.The ionization process in the ionosphere produces ions and free electrons. These electrons perturb the propagation of the GNSS (Global Navigation Satellite System) signals by inducing a so-called ionospheric delay.
See http://stce.be/newsletter/GNSS_final.pdf for some more explanations; for more information, see https://gnss.be/SpaceWeather
The SIDC Space Weather Briefing
The forecaster on duty presented the SIDC briefing that gives an overview of space weather from March 23 to 30.
The pdf of the presentation can be found here: https://www.stce.be/briefings/20250331_SWbriefing.pdf
Upcoming Activities
Courses, seminars, presentations and events with the Sun-Space-Earth system and Space Weather as the main theme. We provide occasions to get submerged in our world through educational, informative and instructive activities.
* April 28-30, 2025, STCE Space Weather Introductory Course, Brussels, Belgium - register: https://events.spacepole.be/event/214/
* May 26-27, 2025, STCE Course Space Weather impacts on aviation, online - register: https://events.spacepole.be/event/215/
* Jun 23-25, 2025, STCE Space Weather Introductory Course, Brussels, Belgium - register: https://events.spacepole.be/event/216/
* Sep 15-16, 2025, STCE Course Space Weather impacts on aviation, online - register: https://events.spacepole.be/event/218/
* Nov 17-19, 2025, STCE Space Weather Introductory Course, Brussels, Belgium - register: https://events.spacepole.be/event/217/
To register for a course and check the seminar details, navigate to the STCE Space Weather Education Center: https://www.stce.be/SWEC
If you want your event in the STCE newsletter, contact us: stce_coordination at stce.be
Website: https://www.stce.be/SWEC