- Table of Content
- 1.Filament erupt...
- 2.Solar Orbiter ...
- 3.Review of Sola...
- 4.International ...
- 5.PROBA2 Observa...
- 6.Noticeable Sol...
- 7.Geomagnetic Ob...
- 8.Review of Iono...
- 9.The SIDC Space...
- 10.STCE Activitie...
2. Solar Orbiter Workshop at the STCE
3. Review of Solar and Geomagnetic Activity
4. International Sunspot Number by SILSO
5. PROBA2 Observations
6. Noticeable Solar Events
7. Geomagnetic Observations in Belgium
8. Review of Ionospheric Activity
9. The SIDC Space Weather Briefing
10. STCE Activities
Filament eruptions
Solar prominences are clouds of charged particles ("plasma") above the solar surface squeezed between regions of opposite magnetic polarity. Being cooler and denser than the plasma underneath and their surroundings, they appear as bright blobs when seen near the solar limb and as dark lines when seen on the solar disk (then they are called "filaments"). Special filters are required to observe these features, such as in the Hydrogen-alpha (H-alpha) line in the red part of the solar spectrum (656.28 nm), or in some extreme ultraviolet (EUV) passbands such as GOES/SUVI 195. Filaments are structures that only survive by the stability of the surrounding magnetic fields. Hence, longer filaments (from about 20 degrees in length onwards) are prone to erupt. Indeed, as the magnetic regions suspending the filament may become unstable, the filament can erupt and throw a cloud of ionized particles towards the Earth where it can cause geomagnetic disturbances. These eruptions are more likely to occur as the filament grows longer, typically around 200,000 km. Such long filaments usually develop outside sunspot groups.
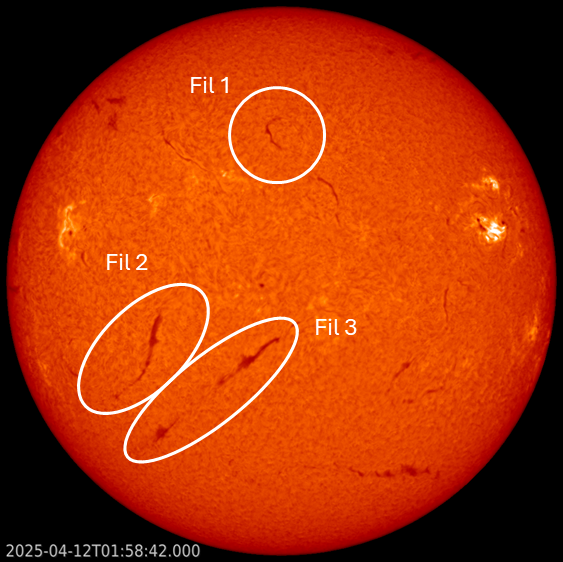
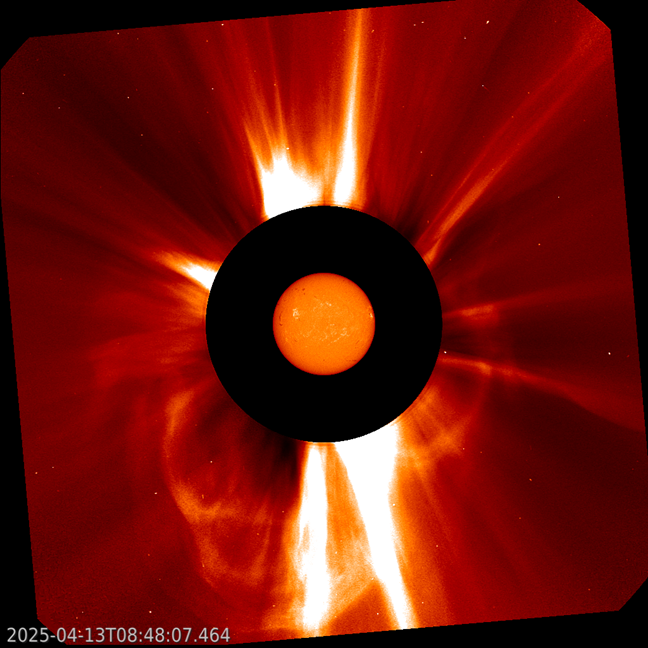
Last week, several filaments were visible in H-alpha (GONG). On 12 and 13 April, three of these filaments erupted. The smallest filament ("Fil 1" in the annotated H-alpha image above) was about 10 degrees in length and located in the northern hemisphere near the central meridian. It was the first to erupt around 11:00UTC on 12 April. The associated coronal mass ejection (CME) was narrow and directed to the north. It was quickly followed by the quiet dissipation of the southern half of a 50-degree (= more than half a million km!) long filament ("Fil 3") in the southern solar hemisphere. No obvious CME seems to have been associated with this event. Between 21:00 and 23:30UTC, another filament ("Fil 2") erupted, as shown in the H-alpha imagery underneath. It was 20 degrees in length and located to the east ("left") of the very long filament. This eruption was associated with a slow partial halo CME that was thought to have an earth-directed component. The best was saved for last, with the violent eruption of the remainder of "Fil 3" early on 13 April, between about 04:30 and 07:00UTC. It was associated with a fast partial halo CME, as shown in the combined GONG/H-alpha and SOHO/LASCO C2 coronagraphic imagery. The SIDC (http://www.sidc.be/index.php ) space weather forecaster expects the combined arrival of these CMEs for 15 or 16 April. The online clip is available at https://www.stce.be/news/761/welcome.html and also shows a comet disintegrating as it approached the Sun from the southeast between 14:00 and 19:00UTC on 12 April.
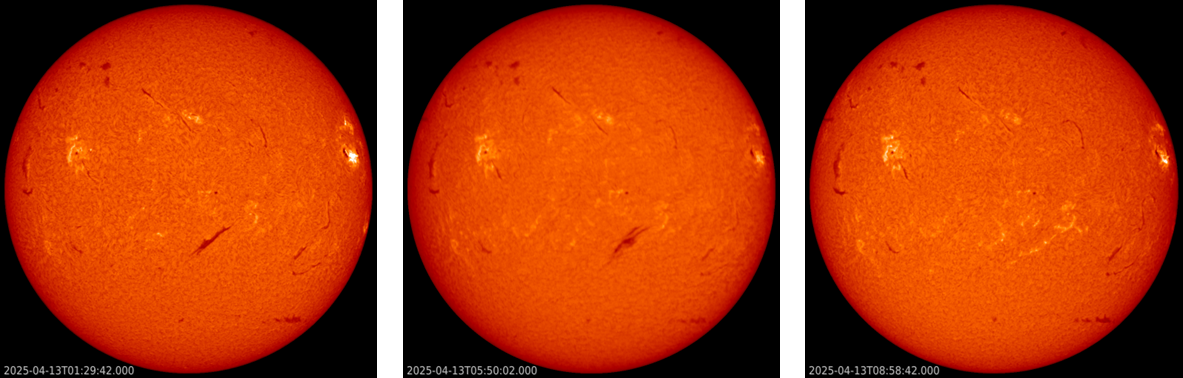
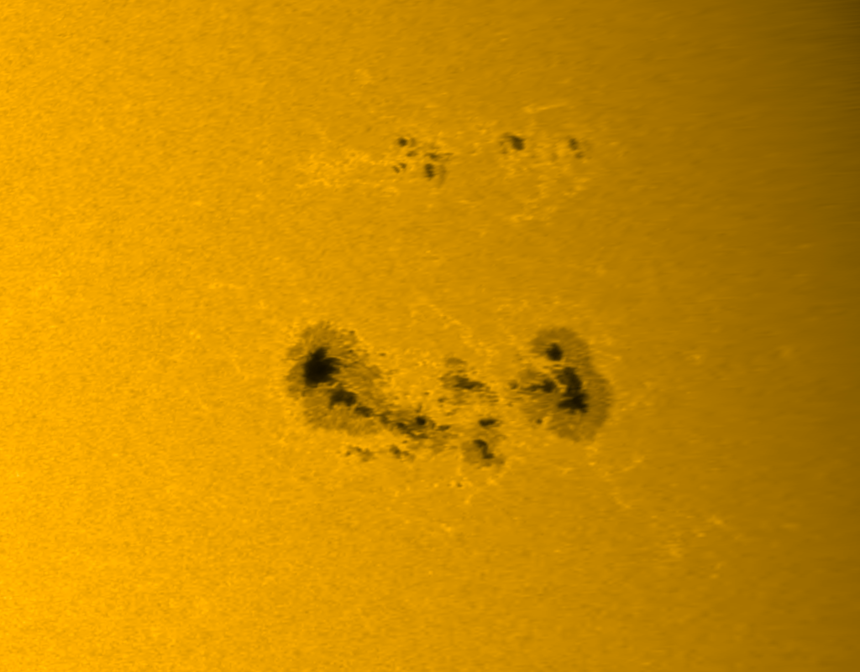
As a bonus, the imagery also shows an active region close to the west limb. This is active region NOAA 4055 which started its development on 9 April, and started to produce M-class flares from late 11 April onwards. By noon on 14 April, NOAA 4055 had already been the source of 21 M-class flares, the strongest being an M4.2 flare peaking at 06:50UTC on 14 April. NOAA 4055 is also, together with NOAA 3961, the largest sunspot group to have appeared so far this year, about 5 times the total surface area of the Earth. The SDO/HMI still underneath shows this active region in white light on 13 April.
Solar Orbiter Workshop at the STCE
On 8, 9 and 10 April 2025, the EUI team welcomed 85 leading solar physicists, in person and online, to participate in an international workshop on the future of the ESA/NASA Solar Orbiter mission.
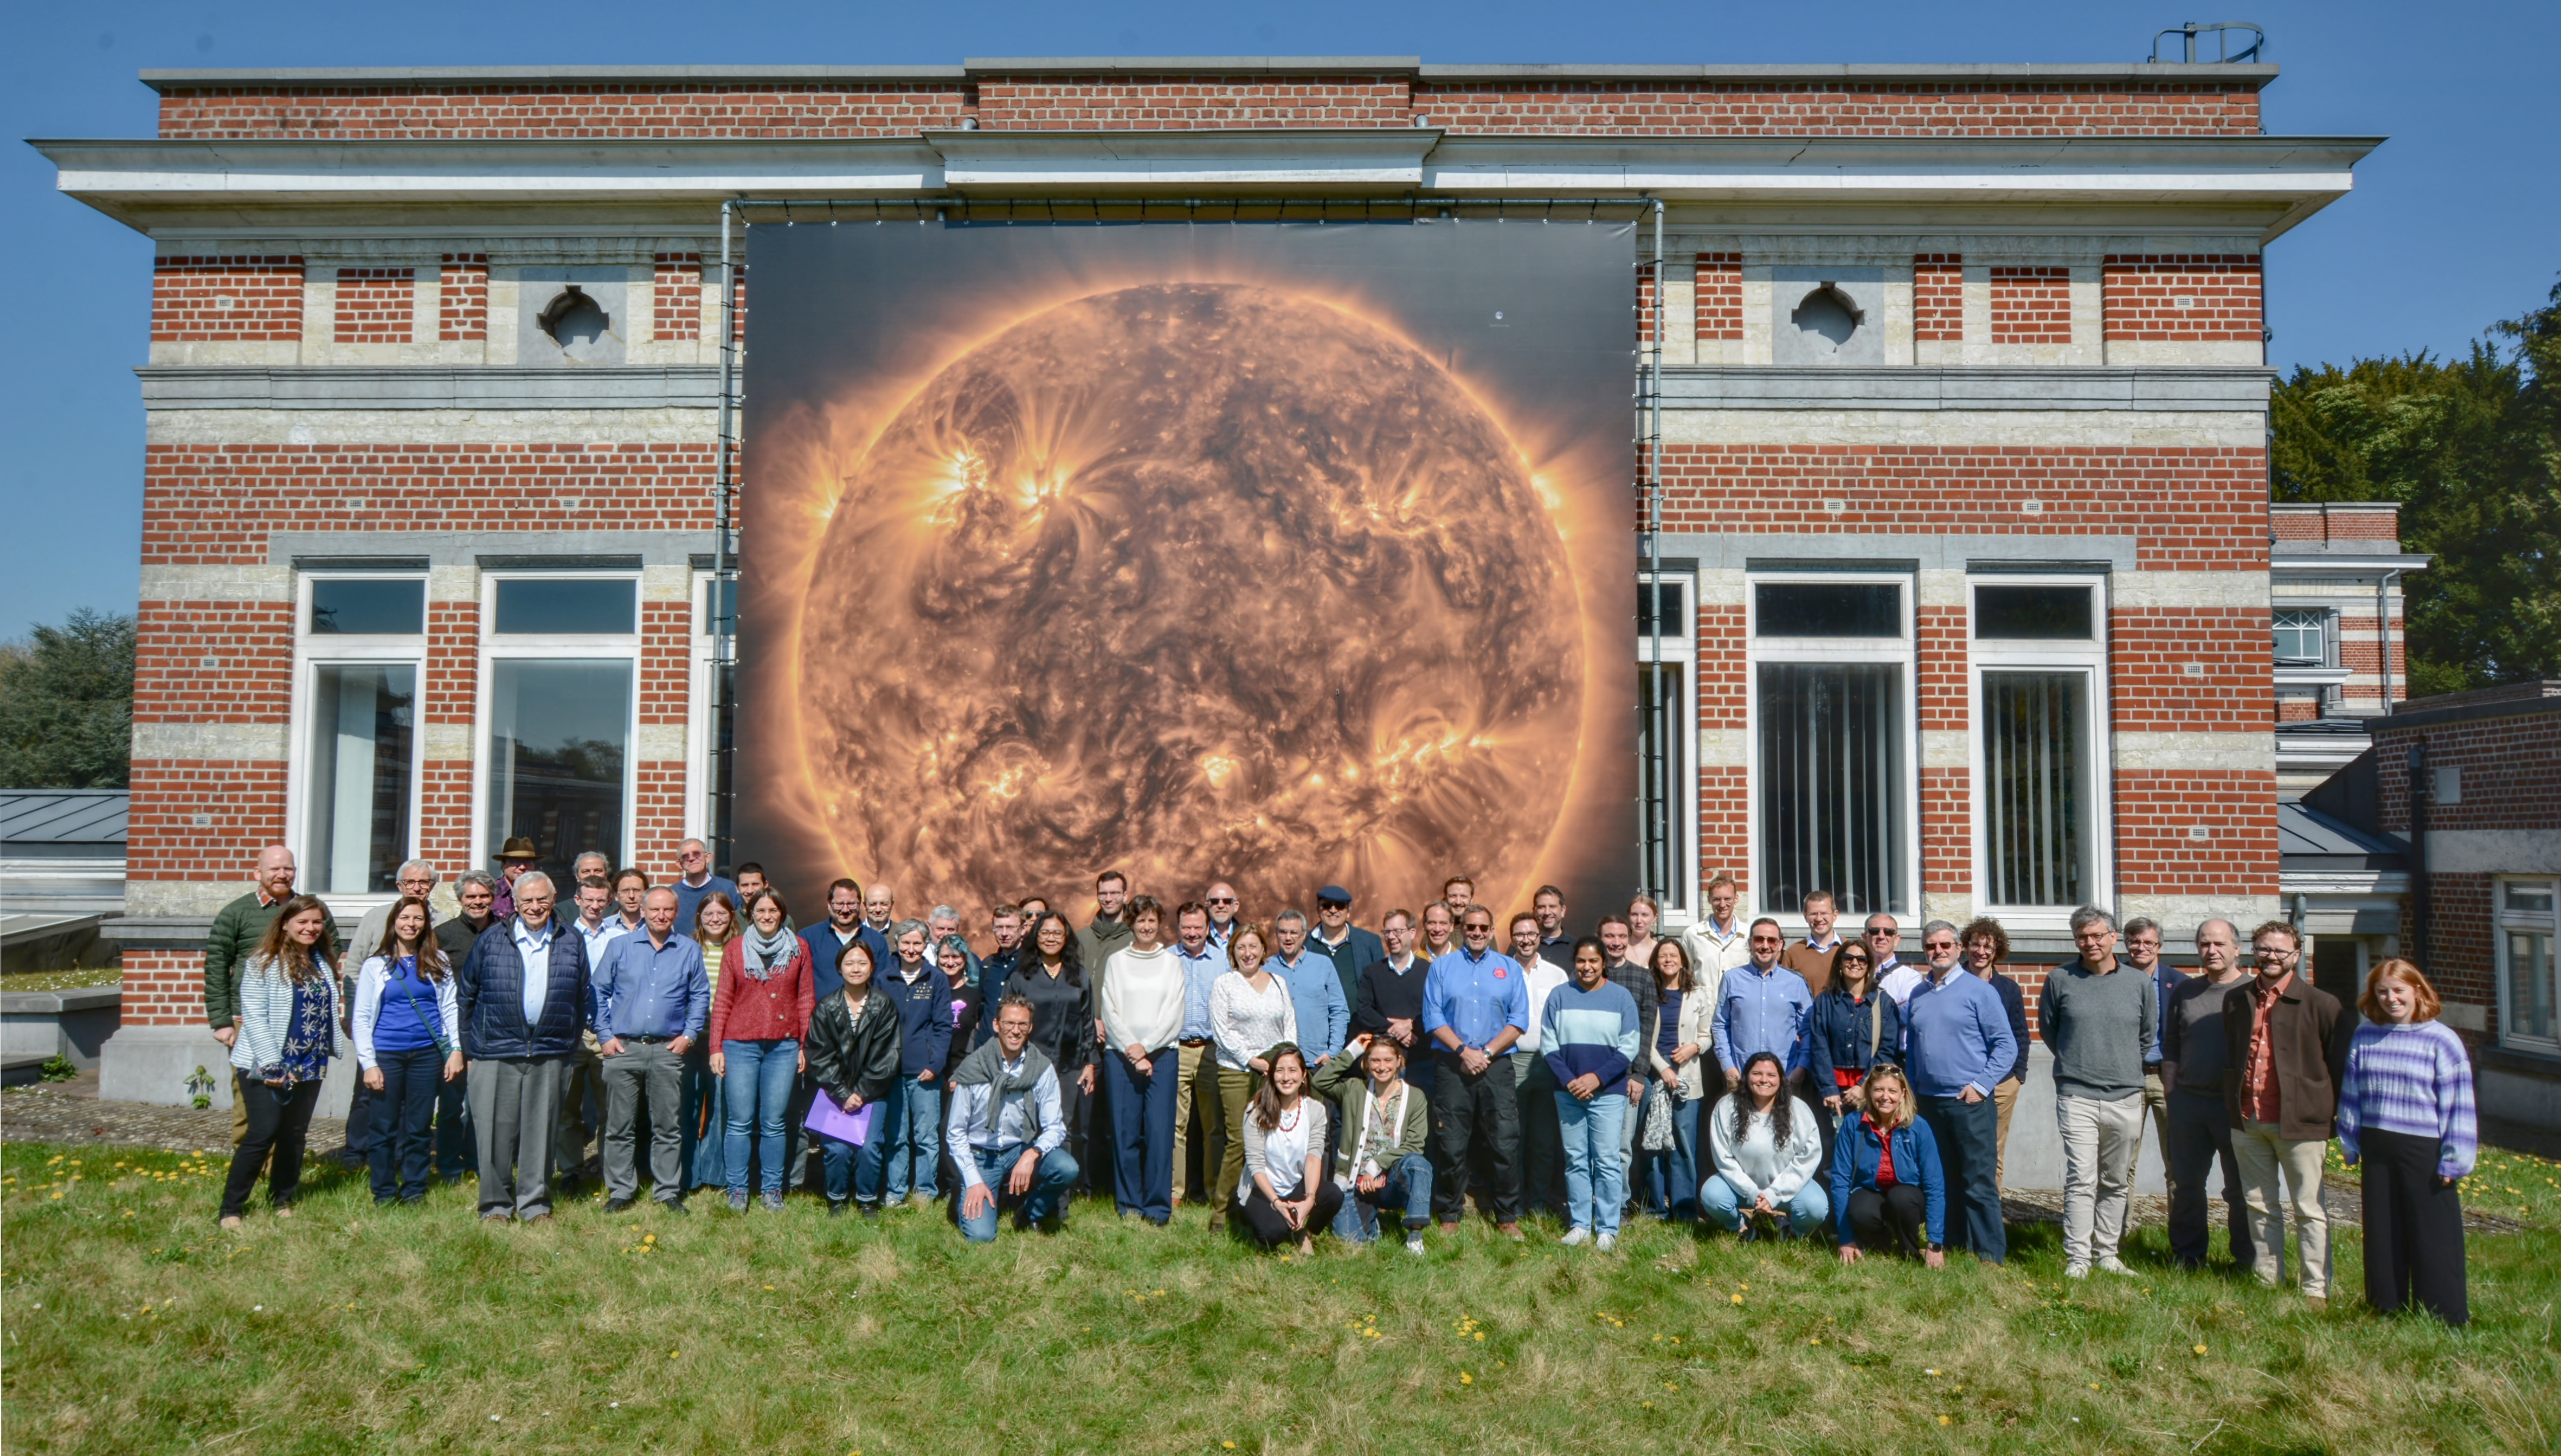
Through presentations and group discussions, the science of three instruments (EUI, Metis and SPICE) was reviewed in detail. A special session was held on the future science operations of the whole mission as its orbit is shifting out of the ecliptic and, for the first time ever, images of the solar poles will be taken.
Since 2020, Solar Orbiter observes the Sun at a distance that, at some moments, is within the orbit of Mercury. The Observatory manages EUI, the Extreme Ultraviolet Imager, which is one of the cornerstone instruments onboard Solar orbiter. EUI’s solar images of unprecedented resolution revolutionise the understanding of our star.
More information on the Solar Orbiter Workshop: https://sites.google.com/view/swt40/home
More information on EUI: https://www.sidc.be/EUI/intro
Review of Solar and Geomagnetic Activity
WEEK 1267 from 2025 Apr 07
Solar Active Regions and flares
The solar flaring activity started at low levels and increased to high levels by the end of the week. A total of 20 active regions (ARs) were numbered on the visible solar disk with SIDC Sunspot Group 461 (NOAA Active Region 4048) and SIDC Sunspot Group 469 (NOAA Active Region 4055) being the most notable. These regions were the largest and most complex ones (classified as magnetic type beta-gamma-delta) contributing to most of the flaring activity throughout the week. The strongest activity registered was an M2.7 flare, SIDC flare 4099, with peak time 11:45 UTC on April 12, produced by SIDC Sunspot Group 469.
Coronal mass ejections
Multiple filaments were observed throughout the week with two major eruptions, resulting in coronal dimmings and Earth-directed coronal mass ejections (CMEs). A wide, slow, south-eastward CME was observed in the LASCO/C2 imagery around 23:36 UTC on April 12. The CME had a projected velocity around 300 km/s and is associated with a long filament crossing the central meridian to the east of the disk center, which erupted around 23:00 UTC on April 12. A faster partial halo CME with estimated projected velocity around 550 km/s was observed in the LASCO/C2 data starting at 07:12 UTC on April 13. The CME is related to a neighbouring filament eruption to the south of SIDC Sunspot Group 398 (NOAA Active Region 4056). Both CMEs are expected to arrive at Earth in a combined shock arrival in the upcoming week.
Coronal Holes
Three negative polarity and two small and compact positive-polarity coronal holes crossed the central meridian throughout the week. High speed streams related to the negative polarity coronal holes were detected at Earth throughout the week.
Proton flux levels
The greater than 10 MeV GOES proton flux was at nominal levels throughout the entire week.
Electron fluxes at GEO
The greater than 2 MeV electron flux as measured by GOES 18 was above the 1000 pfu threshold for prolonged periods throughout the entire week. The corresponding electron fluence started at high levels and reduced to moderate levels for the rest of the week.
Solar wind
The solar wind conditions throughout the week reflected several high speed stream (HSS) arrivals. The magnitude of the interplanetary magnetic field (B) reached a maximum value of 11.5 nT with a minimum Bz of -11.3 nT. The B field phi angle was predominantly in the negative sector (directed towards the Sun) throughout the entire week reflecting the polarity of the geo-effective coronal holes. The solar wind speed varied in the range of 358 km/s to 724 km/s.
Geomagnetism
The geomagnetic conditions throughout the week varied between quiet and minor storm levels. Locally over Belgium, mostly quiet to active conditions were observed with a short isolated minor storm level registered late on April 08.
International Sunspot Number by SILSO

The daily Estimated International Sunspot Number (EISN, red curve with shaded error) derived by a simplified method from real-time data from the worldwide SILSO network. It extends the official Sunspot Number from the full processing of the preceding month (green line), a few days more than one solar rotation. The horizontal blue line shows the current monthly average. The yellow dots give the number of stations that provided valid data. Valid data are used to calculate the EISN. The triangle gives the number of stations providing data. When a triangle and a yellow dot coincide, it means that all the data is used to calculate the EISN of that day.
PROBA2 Observations
Solar Activity
Solar flare activity fluctuated from low to moderate during the week.
In order to view the activity of this week in more detail, we suggest to go to the following website from which all the daily (normal and difference) movies can be accessed: https://proba2.oma.be/ssa
This page also lists the recorded flaring events.
A weekly overview movie (SWAP week 785) can be found here: https://proba2.sidc.be/swap/data/mpg/movies/weekly_movies/weekly_movie_2025_04_07.mp4.
Details about some of this week's events can be found further below.
If any of the linked movies are unavailable they can be found in the P2SC movie repository here: https://proba2.oma.be/swap/data/mpg/movies/.
Sunday April 13
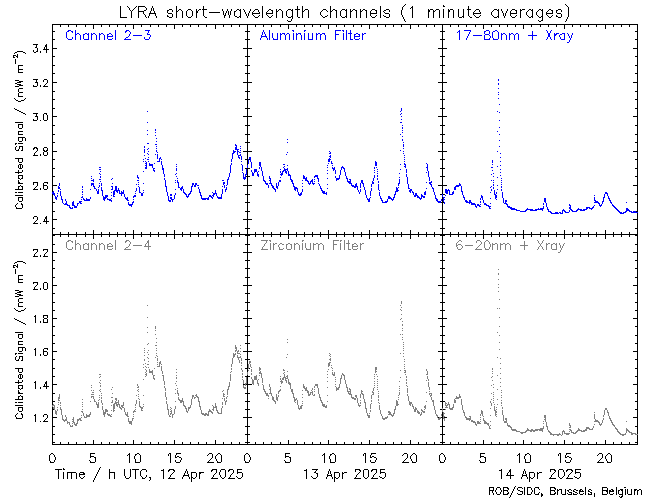
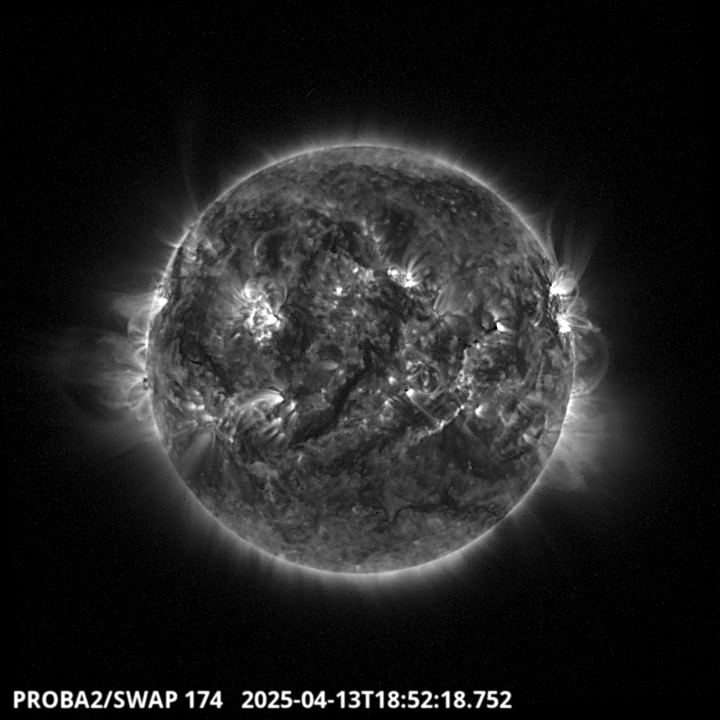
The largest flare of this week was an M3.2, and it was observed by LYRA (top panel) and SWAP (bottom panel). The flare peaked on 2025-Apr-13 at 18:51 UT and occurred at the western limb of the Sun, originating from active region NOAA4055.
Find a SWAP movie of the event here: https://proba2.sidc.be/swap/movies/20250413_swap_movie.mp4.
Noticeable Solar Events
| DAY | BEGIN | MAX | END | LOC | XRAY | OP | 10CM | TYPE | Cat | NOAA |
| 08 | 2208 | 2222 | 2236 | S15W52 | M1.5 | 1B | 19 | 4048 | ||
| 11 | 1640 | 1650 | 1701 | M1.0 | 26 | 4055 | ||||
| 11 | 2208 | 2220 | 2233 | N7W50 | M1.0 | SF | 26 | 4055 | ||
| 12 | 0441 | 0445 | 0455 | M1.1 | 26 | 4055 | ||||
| 12 | 0536 | 0549 | 0555 | N5W57 | M1.2 | SF | 26 | 4055 | ||
| 12 | 0711 | 0719 | 0722 | N6W56 | M1.0 | SF | 26 | 4055 | ||
| 12 | 1105 | 1117 | 1125 | M2.0 | 26 | 4055 | ||||
| 12 | 1135 | 1143 | 1145 | M2.7 | 26 | 4055 | ||||
| 12 | 1233 | 1240 | 1252 | M2.3 | 26 | 4055 | ||||
| 12 | 1500 | 1512 | 1519 | N7W61 | M1.3 | SF | 26 | 4055 | ||
| 13 | 0121 | 0129 | 0137 | M1.0 | 26 | 4055 | ||||
| 13 | 0401 | 0405 | 0425 | M1.1 | 26 | 4055 | ||||
| 13 | 0425 | 0428 | 0431 | M1.1 | 26 | 4055 | ||||
| 13 | 0448 | 0452 | 0454 | N7W69 | M2.3 | SF | 26 | 4055 | ||
| 13 | 0638 | 0652 | 0721 | N7W67 | M1.0 | S | III/1 | 26 | 4055 | |
| 13 | 0943 | 0955 | 1003 | N6W73 | M1.4 | 1 | 26 | 4055 | ||
| 13 | 1003 | 1007 | 1010 | M1.2 | 26 | 4055 | ||||
| 13 | 1528 | 1542 | 1556 | M1.2 | 26 | 4055 | ||||
| 13 | 1838 | 1851 | 1900 | M3.2 | 26 | 4055 | ||||
| 13 | 2155 | 2202 | 2211 | N9W77 | M1.6 | 1F | 26 | 4055 |
| LOC: approximate heliographic location | TYPE: radio burst type |
| XRAY: X-ray flare class | Cat: Catania sunspot group number |
| OP: optical flare class | NOAA: NOAA active region number |
| 10CM: peak 10 cm radio flux |
Geomagnetic Observations in Belgium

Local K-type magnetic activity index for Belgium based on data from Dourbes (DOU) and Manhay (MAB). Comparing the data from both measurement stations allows to reliably remove outliers from the magnetic data. At the same time the operational service availability is improved: whenever data from one observatory is not available, the single-station index obtained from the other can be used as a fallback system.
Both the two-station index and the single station indices are available here: http://ionosphere.meteo.be/geomagnetism/K_BEL/
Review of Ionospheric Activity
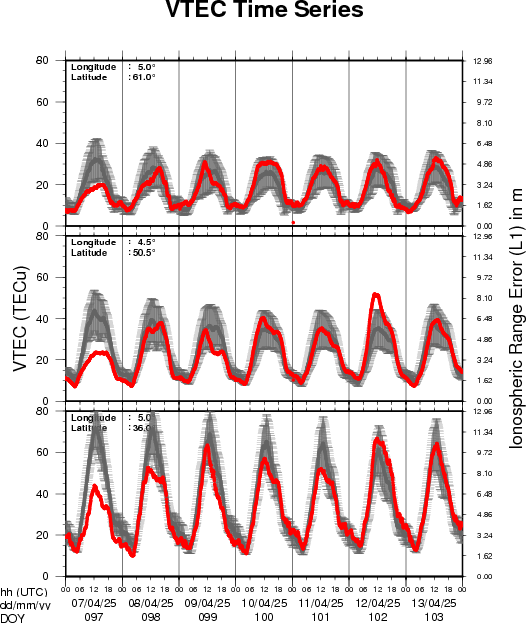
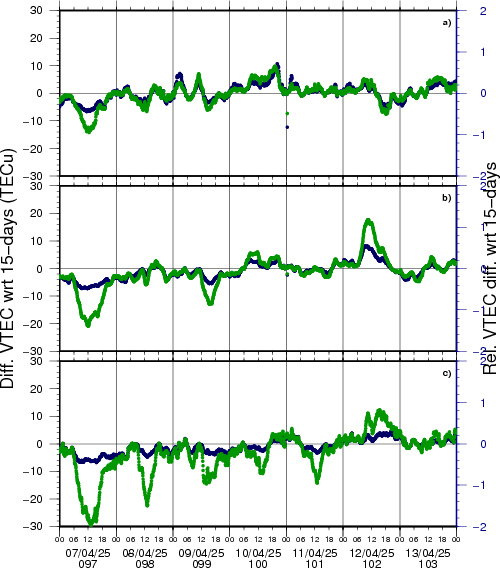
VTEC time series at 3 locations in Europe from 7 Apr 2025 till 13 Apr 2025
The top figure shows the time evolution of the Vertical Total Electron Content (VTEC) (in red) during the last week at three locations:
a) in the northern part of Europe(N 61deg E 5deg)
b) above Brussels(N 50.5deg, E 4.5 deg)
c) in the southern part of Europe(N 36 deg, E 5deg)
This top figure also shows (in grey) the normal ionospheric behaviour expected based on the median VTEC from the 15 previous days.
The time series below shows the VTEC difference (in green) and relative difference (in blue) with respect to the median of the last 15 days in the North, Mid (above Brussels) and South of Europe. It thus illustrates the VTEC deviation from normal quiet behaviour.
The VTEC is expressed in TECu (with TECu=10^16 electrons per square meter) and is directly related to the signal propagation delay due to the ionosphere (in figure: delay on GPS L1 frequency).
The Sun's radiation ionizes the Earth's upper atmosphere, the ionosphere, located from about 60km to 1000km above the Earth's surface.The ionization process in the ionosphere produces ions and free electrons. These electrons perturb the propagation of the GNSS (Global Navigation Satellite System) signals by inducing a so-called ionospheric delay.
See http://stce.be/newsletter/GNSS_final.pdf for some more explanations; for more information, see https://gnss.be/SpaceWeather
The SIDC Space Weather Briefing
The forecaster on duty presented the SIDC briefing that gives an overview of space weather from April 6 to 13.
The pdf of the presentation can be found here: https://www.stce.be/briefings/20250414_SWbriefing.pdf
STCE Activities
Courses, seminars, presentations and events with the Sun-Space-Earth system and Space Weather as the main theme. We provide occasions to get submerged in our world through educational, informative and instructive activities.
* April 25, STCE Seminar: Space weather research in Defense and possible collaborations, https://www.stce.be/content/stce-seminar-space-weather-research-defense-and-possible-collaborations
* April 28-30, 2025, STCE Space Weather Introductory Course, Brussels, Belgium - register: https://events.spacepole.be/event/214/
* May 26-27, 2025, STCE Course Space Weather impacts on aviation, online - register: https://events.spacepole.be/event/215/
* Jun 7-9, STCE stand: Dichtbij de Zon, Nerdland Festival, Wachtebeke, Belgium, https://www.nerdlandfestival.be/nl/
* Jun 20, 2025, STCE seminar: The Vigil mission to L5
* Jun 23-25, 2025, STCE Space Weather Introductory Course, Brussels, Belgium - register: https://events.spacepole.be/event/216/
* Sep 15-16, 2025, STCE Course Space Weather impacts on aviation, online - register: https://events.spacepole.be/event/218/
* Nov 17-19, 2025, STCE Space Weather Introductory Course, Brussels, Belgium - register: https://events.spacepole.be/event/217/
To register for a course and check the seminar details, navigate to the STCE Space Weather Education Center: https://www.stce.be/SWEC
If you want your event in the STCE newsletter, contact us: stce_coordination at stce.be
Website: https://www.stce.be/SWEC