- Table of Content
- 1.SC25 maximum i...
- 2.Tiny Solar Bur...
- 3.ESWW2025 space...
- 4.Review of Sola...
- 5.International ...
- 6.Noticeable Sol...
- 7.Geomagnetic Ob...
- 8.Review of Iono...
- 9.The SIDC Space...
- 10.STCE courses a...
2. Tiny Solar Bursts Show Pulses Like Big Flares
3. ESWW2025 space weather training
4. Review of Solar and Geomagnetic Activity
5. International Sunspot Number by SILSO
6. Noticeable Solar Events
7. Geomagnetic Observations in Belgium
8. Review of Ionospheric Activity
9. The SIDC Space Weather Briefing
10. STCE courses and lectures
SC25 maximum in October 2024
The STCE's SC25 Tracking page (https://www.stce.be/content/sc25-tracking ) has been updated to reflect the latest evolution of some critical space weather parameters for the ongoing solar cycle 25 (SC25). It covers various aspects of space weather, from sunspot numbers over geomagnetic indices all the way to cosmic rays. The multiple graphs allow for a comparison with previous solar cycles at similar stages in their evolution.
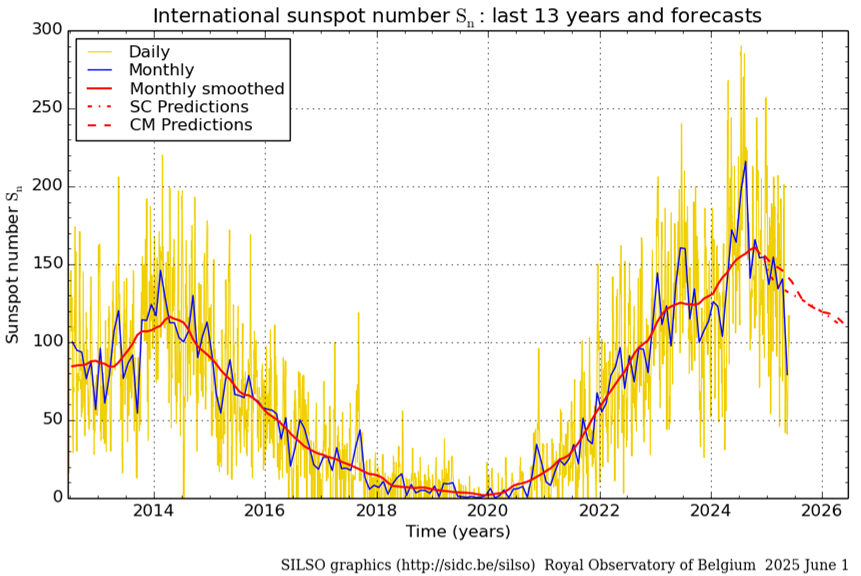
The graph below shows the daily sunspot number (yellow), monthly mean sunspot number (blue), smoothed monthly sunspot number (red) for the last 13 years as well as the 12-month ahead predictions of the monthly smoothed sunspot number (red dashed lines) provided by the SIDC/SILSO (https://www.sidc.be/SILSO/dayssnplot ). Following high solar activity during the first half of 2023, and even higher solar activity from April 2024 onwards, the smoothed monthly sunspot number reached a maximum of 160.8 in October 2024. These are still provisional data, but will differ only slightly from the final ones. As a result, SC25 maximum is well above the initial prediction by the SC25 Panel (115), but also well below the moderately strong SC23 (180.3). For the coming years, another maximum remains a possibility, but it is unlikely it will be higher than the one in October last year because the Sun has completed its polar field reversal in 2023, and because the ongoing solar cycle is already 5.5 years in progress. However, despite the expected declining trend, it is virtually certain that over the next 2-3 years there will still be some episodes with very enhanced solar and geomagnetic activity. For example, the Halloween storms took place 2 years after SC23 maximum, and the famous September 2017 storms occurred 3.5 years after SC24 maximum.
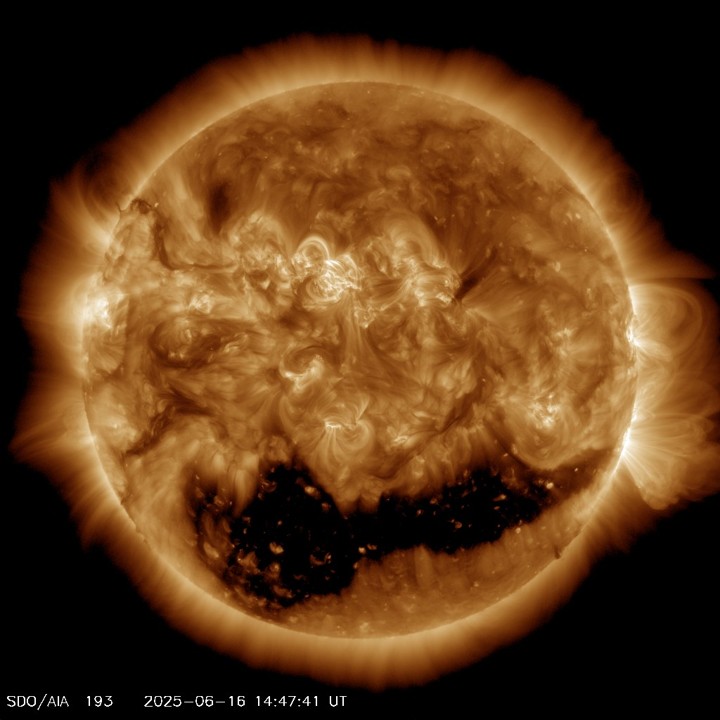
Many other parameters such as the 10.7cm radio flux, the number of solar flares, and cosmic rays have reached values similar to SC23 or SC22, i.e. values not seen in 20 or more years. The greater than 2 MeV electron fluence (365-days smoothed) reached a minimum in June 2024. The recent increasing trend is a result from the high-speed, low-density solar wind streams associated with (the return of) large coronal holes affecting the Earth's magnetosphere. These coronal holes are more numerous during the declining trend and minimum of the solar cycle, see e.g. the STCE newsitem (https://www.stce.be/news/762/welcome.html ). The generated "killer-electrons" constitute a risk to all satellites due to deep-dielectric charging (https://www.stce.be/news/463/welcome.html ). In the extreme ultraviolet (EUV) image underneath, the dark elongated structure in the Sun's southern hemisphere is a large recurrent coronal hole.
Tiny Solar Bursts Show Pulses Like Big Flares
New findings from the European Space Agency's Solar Orbiter spacecraft reveal that even the tiniest bursts of activity from the Sun may behave like their larger counterparts.
The Sun constantly produces tiny flashes of extreme ultraviolet (EUV) emission in its outer atmosphere, known as the corona. These flashes, called EUV brightenings, are small, short-lived bursts of energy that appear all over the Sun. Scientists are particularly interested in these events because the corona is mysteriously much hotter than the Sun's surface, and these tiny brightenings might be key contributors to that heating. They may in fact be miniature versions of solar flares which are sudden, powerful releases of energy from the Sun's atmosphere. Understanding whether EUV brightenings are truly small-scale flares, sharing the same physical mechanisms as larger flares, is therefore essential to solving the long-standing puzzle of coronal heating.
Now, researchers from KU Leuven and the Royal Observatory of Belgium (ROB), using high-resolution data from Extreme Ultraviolet Imager (EUI) operated from the ROB onboard the satellite Solar Orbiter, have found that these small brightenings can exhibit quasi-periodic pulsations (QPPs) - rhythmic fluctuations in brightness. This behavior has previously been observed in large solar and stellar flares, but it was unclear whether such patterns could occur in events as small as EUV brightenings.
Dr. Daye Lim, the lead author, explains: 'We found that these small-scale events, likely 10 billion times smaller than typical solar flares, still exhibit the same kind of QPPs. This strongly suggests that similar physical mechanisms may drive both large and small-scale solar activity.'
This discovery supports the idea that EUV brightenings are miniature versions of flares, offering scientists a new, abundant way to study how energy is released and transported in the Sun's atmosphere. Since these events occur far more frequently than larger flares, they open new opportunities for probing solar dynamics with greater statistical power. The results are published in the Astronomy and Astrophysics journal: https://www.aanda.org/articles/aa/full_html/2025/06/aa54587-25/aa54587-25.html
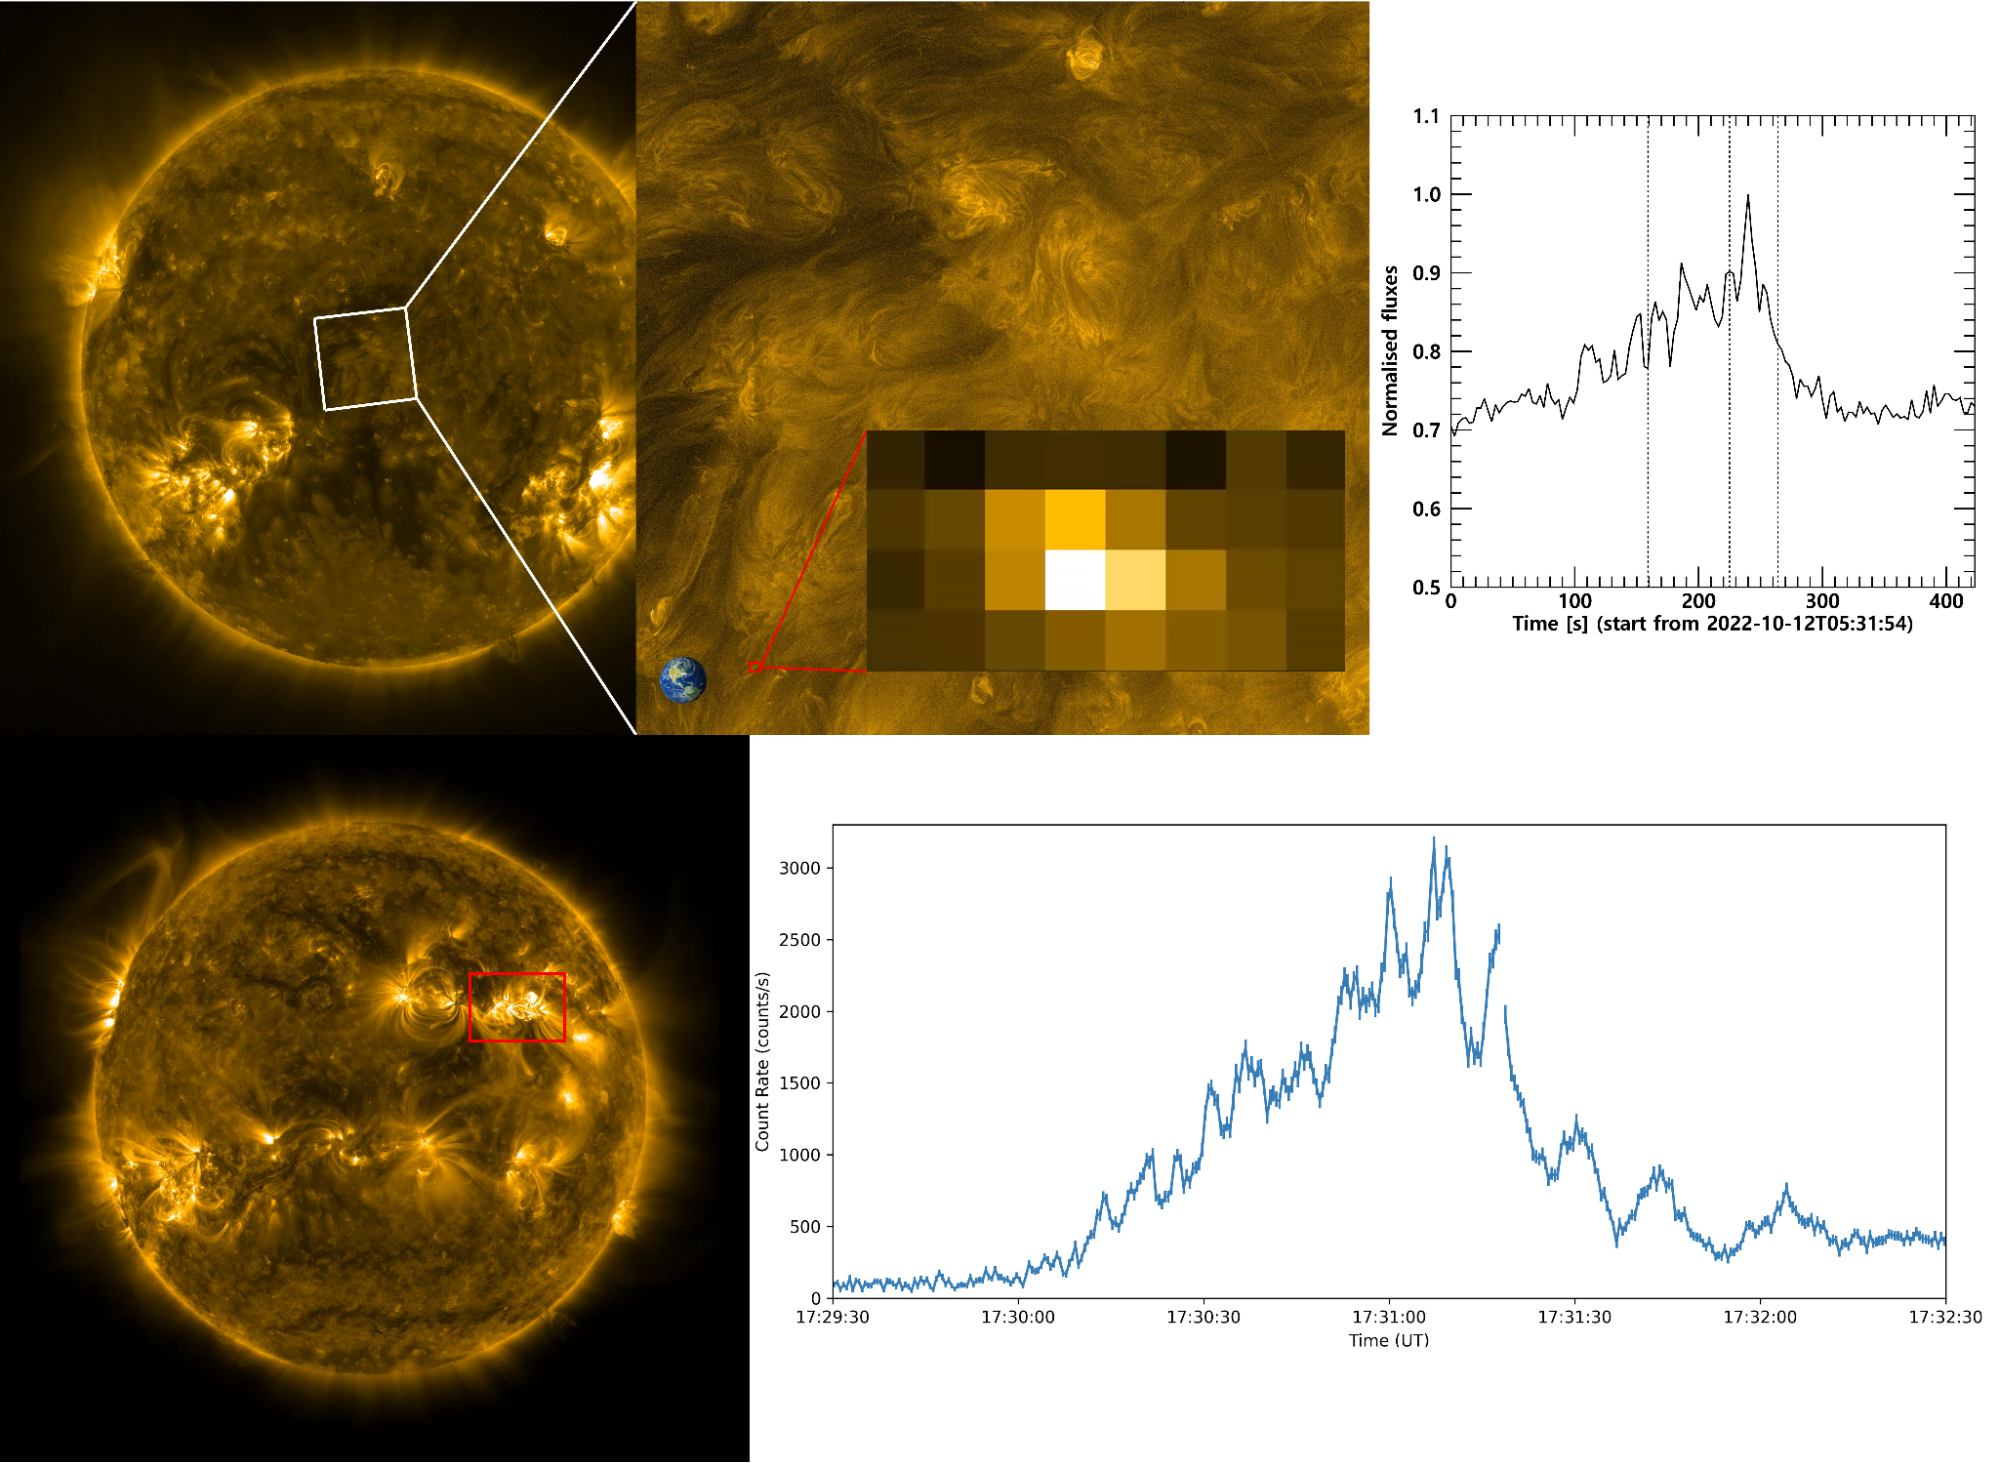
Top: Full-Sun image taken on 12 October 2022 by the EUI's Full Sun Imager telescope, with a zoom-in on the solar disk center captured by the High Resolution Imager. The Earth is shown for scale. A small-scale EUV brightening is highlighted by the red box, with an overlapping zoomed-in view shown above. The rightmost panel shows the light curve corresponding to this event (Courtesy: Lim et al. 2025 and Collier et al. 2024). A video of this small-scale event is also available: https://cloud-as.oma.be/index.php/s/2s2NYF3Qbqy9SxG
Bottom: Full-Sun image taken on 30 March 2022 by the Solar Dynamics Observatory's Atmospheric Imaging Assembly. The region of a very bright X1.3-class flare is marked by a red box. The right panel displays the light curve from this flare event. A video of this flare is also available: https://cloud-as.oma.be/index.php/s/S35nMnKGr5aRfyN
The pulsations are evident in both light curves.
ESWW2025 space weather training
You can apply for the space weather training in Kiruna, prior to the European Space Weather Week in Umea, Sweden.
Deadline is July 7.
Don't miss it: https://esww.eu/training/school-programme
Review of Solar and Geomagnetic Activity
Solar Active Regions and flares
The solar flaring activity over started at high levels and reduced to low levels towards the end of the week. A total of 14 active regions (ARs)were numbered on the visible solar disk with SIDC Sunspot Group 523 (NOAA Active Region 4114) being the largest and most complex region throughout the week. It was classified as magnetic type beta-gamma-delta for the most of the week and was responsible for the majority of the flaring activity, including multiple M-class flaring and two X-class flares: an X1.2 flare (SIDC 4675) with peak time 21:49 UTC on June 17, and an X1.9 flare (SIDC 4707) with peak time 23:50 UTC on June 19. In the second half of the week two new regions, SIDC SSG 526 (NOAA AR 4117) and SIDC SSG 527 (NOAA AR 4118), rotated over the east limb onto the solar disc and started to produce low to moderate levels of flaring activity.
Coronal Mass Ejections
Multiple filament and prominence eruptions were observed throughout the week, none of which resulting in an Earth-directed coronal mass ejection (CME). A fast narrow coronal mass ejection (SIDC CME 519) propagating northward was observed in SOHO/LASCO C2 coronagraph data around 18:24 UTC on June 15. The CME had a projected speed of above 1000 km/s and was associated with an M8.4 flare (SIDC Flare 4651) originating from SIDC Sunspot Group 523 (NOAA Active Region 4114). The event was accompanied by a strong coronal dimming, a large coronal wave, a white-light shock and several solar radio bursts. The bulk of the CME was estimated to be off the Sun-Earth line with small chances for a possible shock impact at Earth on June 18. A wide westward CME (SIDC CME 520) was observed around 02:12 UTC on June 16. The CME was associated with a C6.5-flare from near the west limb peaking at 01:48 UTC and was modelled to miss Earth. A slow partial halo coronal mass ejection (SIDC CME 522) was observed in the SOHO/LASCO C2 coronagraph imagery around 03:36 UTC on June 18. The CME was related to activity behind the west limb with no expected impact on Earth.
Coronal Holes
A very large positive polarity-coronal (SIDC Coronal Hole 104) was residing over the central median for most of the week. A mild high speed stream related to this coronal hole was impacting the Earth throughout the full week. Another prominent negative-polarity coronal hole (SIDC Coronal Hole 116) started to cross the central meridian on June 22. The associated high speed stream could be expected at Earth starting from June 25.
Proton Flux levels
The greater than 10 MeV GOES proton flux was at nominal levels throughout the entire week.
Electron fluxes at GEO
The greater than 2 MeV electron flux as measured by GOES 18 and GOES 19 was briefly exceeding the 1000 pfu threshold in the second half of the week as a result of the ongoing mild high speed stream influence. The corresponding electron fluence was at nominal levels throughout the week.
Solar Wind
The solar wind conditions throughout the week reflected the continuous mild high speed stream (HSS) influence with no ICME signatures detected in the in situ data (ACE and DSCOVR). The magnitude of the interplanetary magnetic field (B) reached a maximum value of 10.7 nT with a minimum Bz of -8.6 nT. The B field phi angle was predominantly in the positive sector (directed away from the Sun) reflecting the polarity of the geo-effective coronal hole (SIDC Coronal Hole 104). The solar wind speed varied in the range of 270 km/s to 630 km/s.
Geomagnetism
The geomagnetic conditions throughout the week were at quiet to active levels as a result of the mild influence of the high speed stream.
International Sunspot Number by SILSO

The daily Estimated International Sunspot Number (EISN, red curve with shaded error) derived by a simplified method from real-time data from the worldwide SILSO network. It extends the official Sunspot Number from the full processing of the preceding month (green line), a few days more than one solar rotation. The horizontal blue line shows the current monthly average. The yellow dots give the number of stations that provided valid data. Valid data are used to calculate the EISN. The triangle gives the number of stations providing data. When a triangle and a yellow dot coincide, it means that all the data is used to calculate the EISN of that day.
Noticeable Solar Events
| DAY | BEGIN | MAX | END | LOC | XRAY | OP | 10CM | TYPE | Cat | NOAA |
| 16 | 0408 | 0423 | 0443 | N19E10 | M1.8 | 1F | 2 | 4114 | ||
| 16 | 0917 | 0938 | 0948 | N19E8 | M6.3 | 1B | 2 | 4114 | ||
| 16 | 1127 | 1139 | 1143 | M1.4 | ||||||
| 16 | 1443 | 1455 | 1503 | M1.1 | ||||||
| 17 | 2138 | 2149 | 2154 | N18W12 | X1.2 | 2B | 2 | 4114 | ||
| 17 | 2344 | 0015 | M1.5 | 4117 | ||||||
| 19 | 2337 | 2350 | 2354 | X1.9 | 2 | 4114 | ||||
| 20 | 0002 | 0004 | 0006 | N19W39 | M4.6 | 1N | III/1 | 2 | 4114 | |
| 20 | 1721 | 1740 | 1759 | S12E46 | M1.0 | 1F | III/1 | 6 | 4117 |
| LOC: approximate heliographic location | TYPE: radio burst type |
| XRAY: X-ray flare class | Cat: Catania sunspot group number |
| OP: optical flare class | NOAA: NOAA active region number |
| 10CM: peak 10 cm radio flux |
Geomagnetic Observations in Belgium

Local K-type magnetic activity index for Belgium based on data from Dourbes (DOU) and Manhay (MAB). Comparing the data from both measurement stations allows to reliably remove outliers from the magnetic data. At the same time the operational service availability is improved: whenever data from one observatory is not available, the single-station index obtained from the other can be used as a fallback system.
Both the two-station index and the single station indices are available here: http://ionosphere.meteo.be/geomagnetism/K_BEL/
Review of Ionospheric Activity


VTEC time series at 3 locations in Europe from 16 Jun 2025 till 22 Jun 2025
The top figure shows the time evolution of the Vertical Total Electron Content (VTEC) (in red) during the last week at three locations:
a) in the northern part of Europe(N 61deg E 5deg)
b) above Brussels(N 50.5deg, E 4.5 deg)
c) in the southern part of Europe(N 36 deg, E 5deg)
This top figure also shows (in grey) the normal ionospheric behaviour expected based on the median VTEC from the 15 previous days.
The time series below shows the VTEC difference (in green) and relative difference (in blue) with respect to the median of the last 15 days in the North, Mid (above Brussels) and South of Europe. It thus illustrates the VTEC deviation from normal quiet behaviour.
The VTEC is expressed in TECu (with TECu=10^16 electrons per square meter) and is directly related to the signal propagation delay due to the ionosphere (in figure: delay on GPS L1 frequency).
The Sun's radiation ionizes the Earth's upper atmosphere, the ionosphere, located from about 60km to 1000km above the Earth's surface.The ionization process in the ionosphere produces ions and free electrons. These electrons perturb the propagation of the GNSS (Global Navigation Satellite System) signals by inducing a so-called ionospheric delay.
See http://stce.be/newsletter/GNSS_final.pdf for some more explanations; for more information, see https://gnss.be/SpaceWeather
The SIDC Space Weather Briefing
The forecaster on duty presented the SIDC briefing that gives an overview of space weather from June 16 to 22.
The pdf of the presentation can be found here: https://www.stce.be/briefings/20250623_SWbriefing.pdf
STCE courses and lectures
Courses, seminars, presentations and events with the Sun-Space-Earth system and Space Weather as the main theme. We provide occasions to get submerged in our world through educational, informative and instructive activities.
* Oct 23-25, ESWW Space Weather Training by Umea University and STCE, Kiruna, Sweden, https://esww.eu/training/application
* Oct 27-31, European Space Weather Week, Umea, Sweden - https://esww.eu/
* Nov 17-19, 2025, STCE Space Weather Introductory Course, Brussels, Belgium - register: https://events.spacepole.be/event/217/
To register for a course and check the seminar details, navigate to the STCE Space Weather Education Center: https://www.stce.be/SWEC
If you want your event in the STCE newsletter, contact us: stce_coordination at stce.be
Website: https://www.stce.be/SWEC