- Table of Content
- 1.SWx acronyms
- 2.Review of Sola...
- 3.Noticeable Sol...
- 4.International ...
- 5.PROBA2 Observa...
- 6.Geomagnetic Ob...
- 7.The SIDC Space...
- 8.Review of Iono...
- 9.STCE courses a...
2. Review of Solar and Geomagnetic Activity
3. Noticeable Solar Events
4. International Sunspot Number by SILSO
5. PROBA2 Observations (4 Aug 2025 - 10 Aug 2025)
6. Geomagnetic Observations in Belgium
7. The SIDC Space Weather Briefing
8. Review of Ionospheric Activity
9. STCE courses and presentations
SWx acronyms
In papers and documents on solar-terrestrial research, it is not always straightforward to immediately grasp the meaning of sentences such as "HF-INT is a technique for identifying LSTIDs in NRT based on data from EIS." Quite a few would need a second reading of statements such as "VEX and MAVEN provide data on IP shocks to the SHARP database." and "PECASUS, SWPC, ACFJ and CRC issue SWx advisories on e.g. PSD and PCA to ICAO."
In order to help understand what researchers and space weather authors are writing, back in 2021 the STCE compiled a non-exhaustive list of acronyms that are routinely used in the solar-terrestrial domain. This list has now been updated and expanded, and currently contains nearly 1900 entries, up from the original 1500 acronyms. It is primarily based on existing listings from the Space Weather Introductory Course (SWIC ; https://www.stce.be/SWEC) and the STCE Annual Reports (2011-present ; https://www.stce.be/annualReport), and further expanded with a few listings from publications and reviews. This acronym list is considered to be dynamical, i.e. there are still many space weather (SWx) acronyms out there, and new projects, satellites and research papers with their own specific acronyms are created every day. These will obviously drive further updates of this webpage. Also, feel free to send us (swec(at)stce.be) any acronym you find relevant for SWx, and you may retrieve it in any of the future updates of the STCE's SWx acronym list (https://www.stce.be/educational/acronym ). Enjoy!

Review of Solar and Geomagnetic Activity
WEEK 1284 from 2025 Aug 04
Solar active regions and flares
Solar flaring activity was moderate during last week, with fourteen M-class flares recorded. The strongest flare was an M4.4 flare (SIDC Flare 5041) peaking at 15:53 UTC on August 05, associated with SIDC Sunspot Group 588 (NOAA Active Region 4168). A type II radio emission associated with this flare was recorded at 15:58 UTC on August 05. There was a total of twenty-two active regions on the visible disk during the week. The most complex one, SIDC Sunspot Group 588 (NOAA Active Region 4168) had a beta-gamma-delta magnetic configuration for most of the week and was mainly responsible for the flaring activity. Other important regions were SIDC Sunspot Group 581 (NOAA Active Region 4167, magnetic type beta-gamma-delta), SIDC Sunspot Group 590 (NOAA Active Region 4172, magnetic type beta-gamma) and SIDC Sunspot Group 596 (NOAA Active Region 4178, magnetic type beta-gamma).
Coronal mass ejections
Numerous coronal mass ejections (CMEs) were detected during the week but were either events near the west or east limb or backsided and had no impact on Earth. A wide CME (SIDC CME 537) was observed in LASCO/C2 coronagraph imagery, starting from around 17:15 UTC on August 05, lifting off the west limb. It was most likely associated with the M4.4 flare (SIDC Flare 5041) that peaked at 15:53 UTC on August 05. An associated type IV radio emission was detected starting from 15:58 UTC on August 05. A wide CME (SIDC CME 540) was observed in LASCO/C2 coronagraph imagery, starting from around 23:50 UTC on August 06, lifting off the northeast limb. It was likely associated with eruptive activity near the east limb. SIDC CME 541 was observed in LASCO/C2 and LASCO/C3 coronagraph imagery, starting from around 12:00 UTC on August 07, lifting off the west limb. An associated type IV radio emission was detected from 11:36 UTC on August 07. It is most likely associated with the M3.9 flare (SIDC Flare 5069) that peaked at 11:31 UTC on August 07.
Coronal holes
Three coronal holes have crossed the central meridian during the last week. The first (SIDC Coronal Hole 123) was an elongated, southern, positive polarity coronal hole that crossed the central meridian on August 05. The other two (SIDC Coronal Holes 124, 125) were equatorial, positive polarity coronal holes that crossed the central meridian on August 05 and 06 respectively.
Proton flux levels
The greater than 10 MeV proton flux was below the 10 pfu threshold throughout the week.
Electron fluxes at GEO
The greater than 2 MeV electron flux as measured by GOES 18 was above the threshold at the beginning of the week, following a diurnal variation. It then remained below the threshold between August 08 and August 09 and exceeded it again on the UTC morning of August 10. The greater than 2 MeV electron flux as measured by GOES 19 was below the 10 pfu threshold for most of the week. The 24-hour electron fluence was at nominal levels throughout the week.
Solar wind
The solar wind conditions (ACE) were enhanced at the beginning of the week, under the waning influence of a high-speed stream from the elongated, negative polarity coronal hole (SIDC Coronal Hole 122) that first crossed the central meridian on August 01. The interplanetary magnetic field angle during this period was in the negative sector. A period of slow solar wind conditions followed until the UTC afternoon on August 07, when a high-speed stream from SIDC Coronal Hole 123 was recorded. The solar wind speed reached a maximum of 600 km/s and the interplanetary magnetic field a maximum of around 17 nT. The Bz component reached -15 nT. The interplanetary magnetic field angle phi during this period was in the positive sector. A signature of the interplanetary CME arrival, associated with the CME that lifted off at around 17:15 UTC on August 05 (SIDC CME 537) was probably recorded around 21:00 UTC on August 08, with low confidence as it was embedded in the high-speed stream.
Geomagnetism
Geomagnetic conditions globally and locally at the beginning of the week were at quiet to unsettled levels, with a brief active period (NOAA Kp 2 to 4, K Bel 2 to 4). These conditions were the result of the waning influence of a high-speed stream from the negative polarity coronal hole (SIDC Coronal Hole 122). Mostly quiet conditions were observed until the arrival of the high-speed stream from the southern, positive polarity coronal hole (SIDC Coronal Hole 123). Mostly minor storm conditions (NOAA Kp 5) were observed since 12:00 UTC on August 08, with an interval of moderate storm conditions (NOAA Kp 6) between 15:00 UTC and 18:00 UTC on August 09. During the same period, geomagnetic conditions locally escalated from active (K Bel 4) to minor storm levels (K Bel 5).
Noticeable Solar Events
| DAY | BEGIN | MAX | END | LOC | XRAY | OP | 10CM | TYPE | Cat | NOAA |
| 04 | 0452 | 0457 | 0505 | M2.0 | 75 | 4168 | ||||
| 04 | 0505 | 0515 | 0521 | M1.4 | 75 | 4168 | ||||
| 05 | 0200 | 0212 | 0226 | M1.1 | 75 | 4168 | ||||
| 05 | 1546 | 1553 | 1558 | N4W7 | M4.4 | 1B | II/3III/2 | 75 | 4168 | |
| 06 | 1656 | 1702 | 1706 | M1.0 | 75 | 4168 | ||||
| 07 | 0225 | 0232 | 0244 | M2.2 | III/2 | 75 | 4168 | |||
| 07 | 1040 | 1131 | 1153 | M3.9 | 75 | 4168 | ||||
| 08 | 0329 | 0353 | 0401 | N3W43 | M2.8 | SF | III/1 | 75 | 4168 | |
| 08 | 1856 | 1910 | 1917 | N6W53 | M1.0 | SF | VI/2 | 75 | 4168 | |
| 09 | 1610 | 1621 | 1628 | N4W64 | M1.6 | 1F | 75 | 4168 | ||
| 09 | 1633 | 1640 | 1644 | N3W63 | M1.7 | SF | 75 | 4168 | ||
| 10 | 0246 | 0312 | 0342 | N4W67 | M1.7 | SF | III/2 | 75 | 4168 | |
| 10 | 1457 | 1507 | 1510 | N2W80 | M2.2 | SF | III/3 | 75 | 4168 | |
| 10 | 2251 | 2304 | 2315 | M1.7 | 75 | 4168 |
| LOC: approximate heliographic location | TYPE: radio burst type |
| XRAY: X-ray flare class | Cat: Catania sunspot group number |
| OP: optical flare class | NOAA: NOAA active region number |
| 10CM: peak 10 cm radio flux |
International Sunspot Number by SILSO
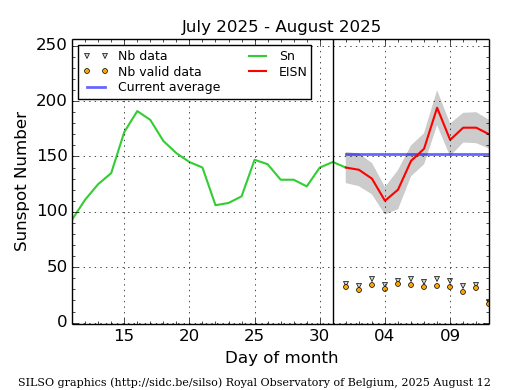
The daily Estimated International Sunspot Number (EISN, red curve with shaded error) derived by a simplified method from real-time data from the worldwide SILSO network. It extends the official Sunspot Number from the full processing of the preceding month (green line), a few days more than one solar rotation. The horizontal blue line shows the current monthly average. The yellow dots give the number of stations that provided valid data. Valid data are used to calculate the EISN. The triangle gives the number of stations providing data. When a triangle and a yellow dot coincide, it means that all the data is used to calculate the EISN of that day.
PROBA2 Observations (4 Aug 2025 - 10 Aug 2025)
Solar Activity
Solar flare activity was at a moderate level during the week.
In order to view the activity of this week in more detail, we suggest to go to the following website from which all the daily (normal and difference) movies can be accessed: https://proba2.oma.be/ssa
This page also lists the recorded flaring events.
A weekly overview movie (SWAP week 802) can be found here: https://proba2.sidc.be/swap/data/mpg/movies/weekly_movies/weekly_movie_2025_08_04.mp4.
Details about some of this week's events can be found further below.
If any of the linked movies are unavailable they can be found in the P2SC movie repository here: https://proba2.oma.be/swap/data/mpg/movies/.
Tuesday August 05
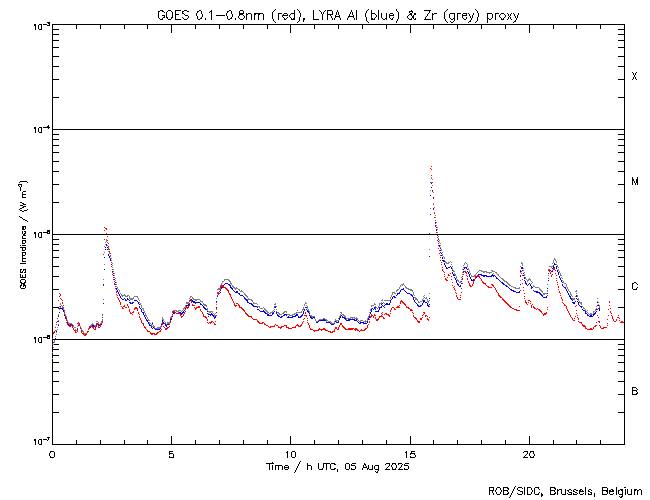
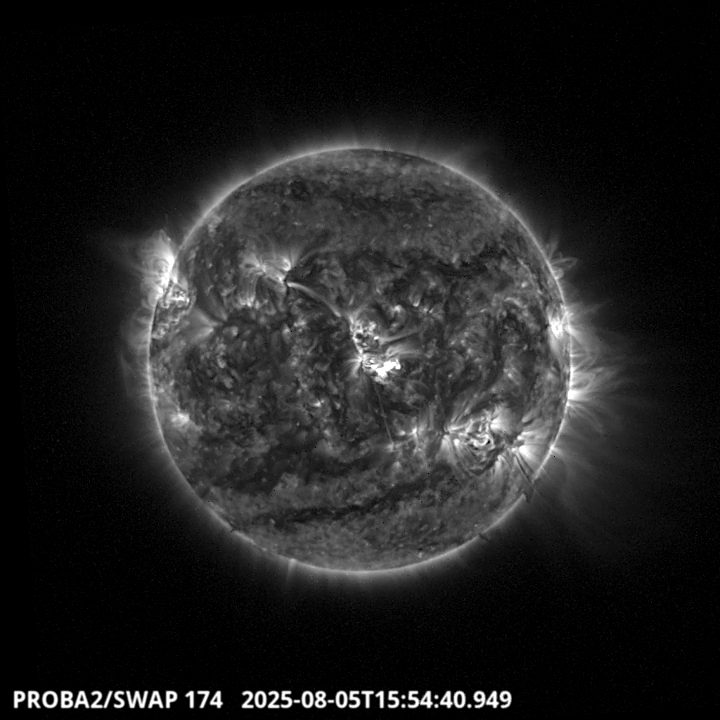
The largest flare of this week was an M4.4, and it was observed by LYRA (top panel) and SWAP (bottom panel). The flare peaked on 2025-Aug-05 at 15:53 UT and occurred close to the center of the Sun, originating from active region NOAA4168 (SIDC 588).
Find a SWAP movie of the event here: https://proba2.sidc.be/swap/movies/20250805_swap_movie.mp4.
Geomagnetic Observations in Belgium
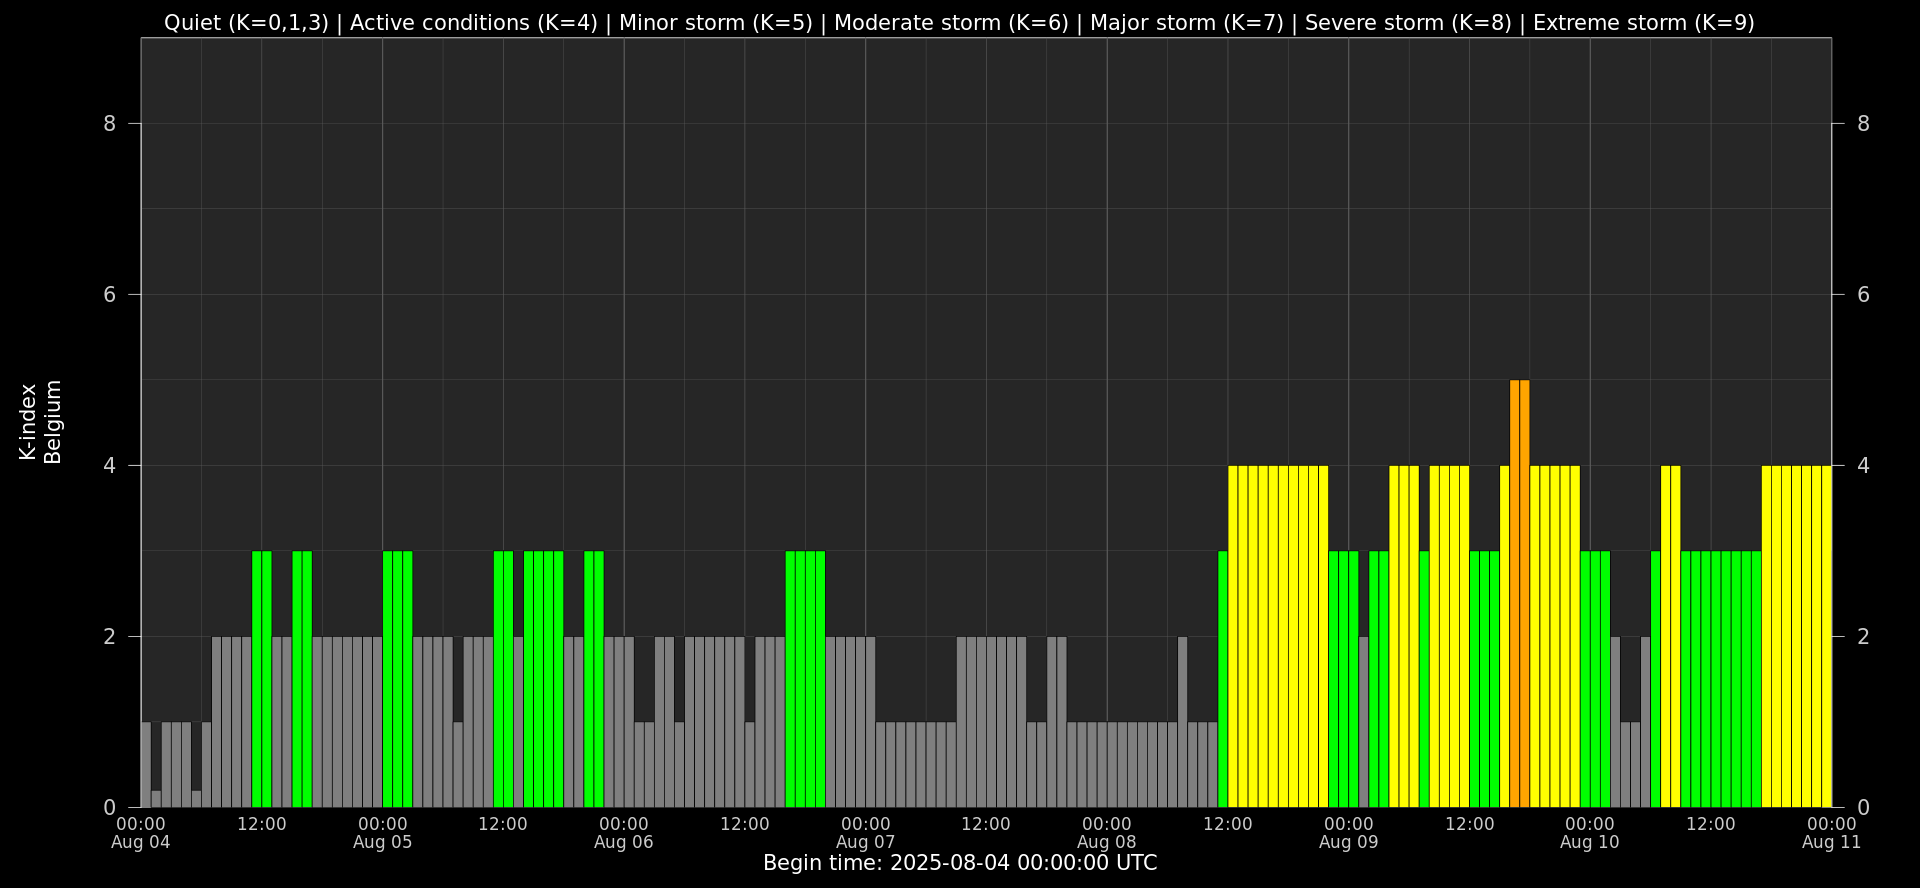
Local K-type magnetic activity index for Belgium based on data from Dourbes (DOU) and Manhay (MAB). Comparing the data from both measurement stations allows to reliably remove outliers from the magnetic data. At the same time the operational service availability is improved: whenever data from one observatory is not available, the single-station index obtained from the other can be used as a fallback system.
Both the two-station index and the single station indices are available here: http://ionosphere.meteo.be/geomagnetism/K_BEL/
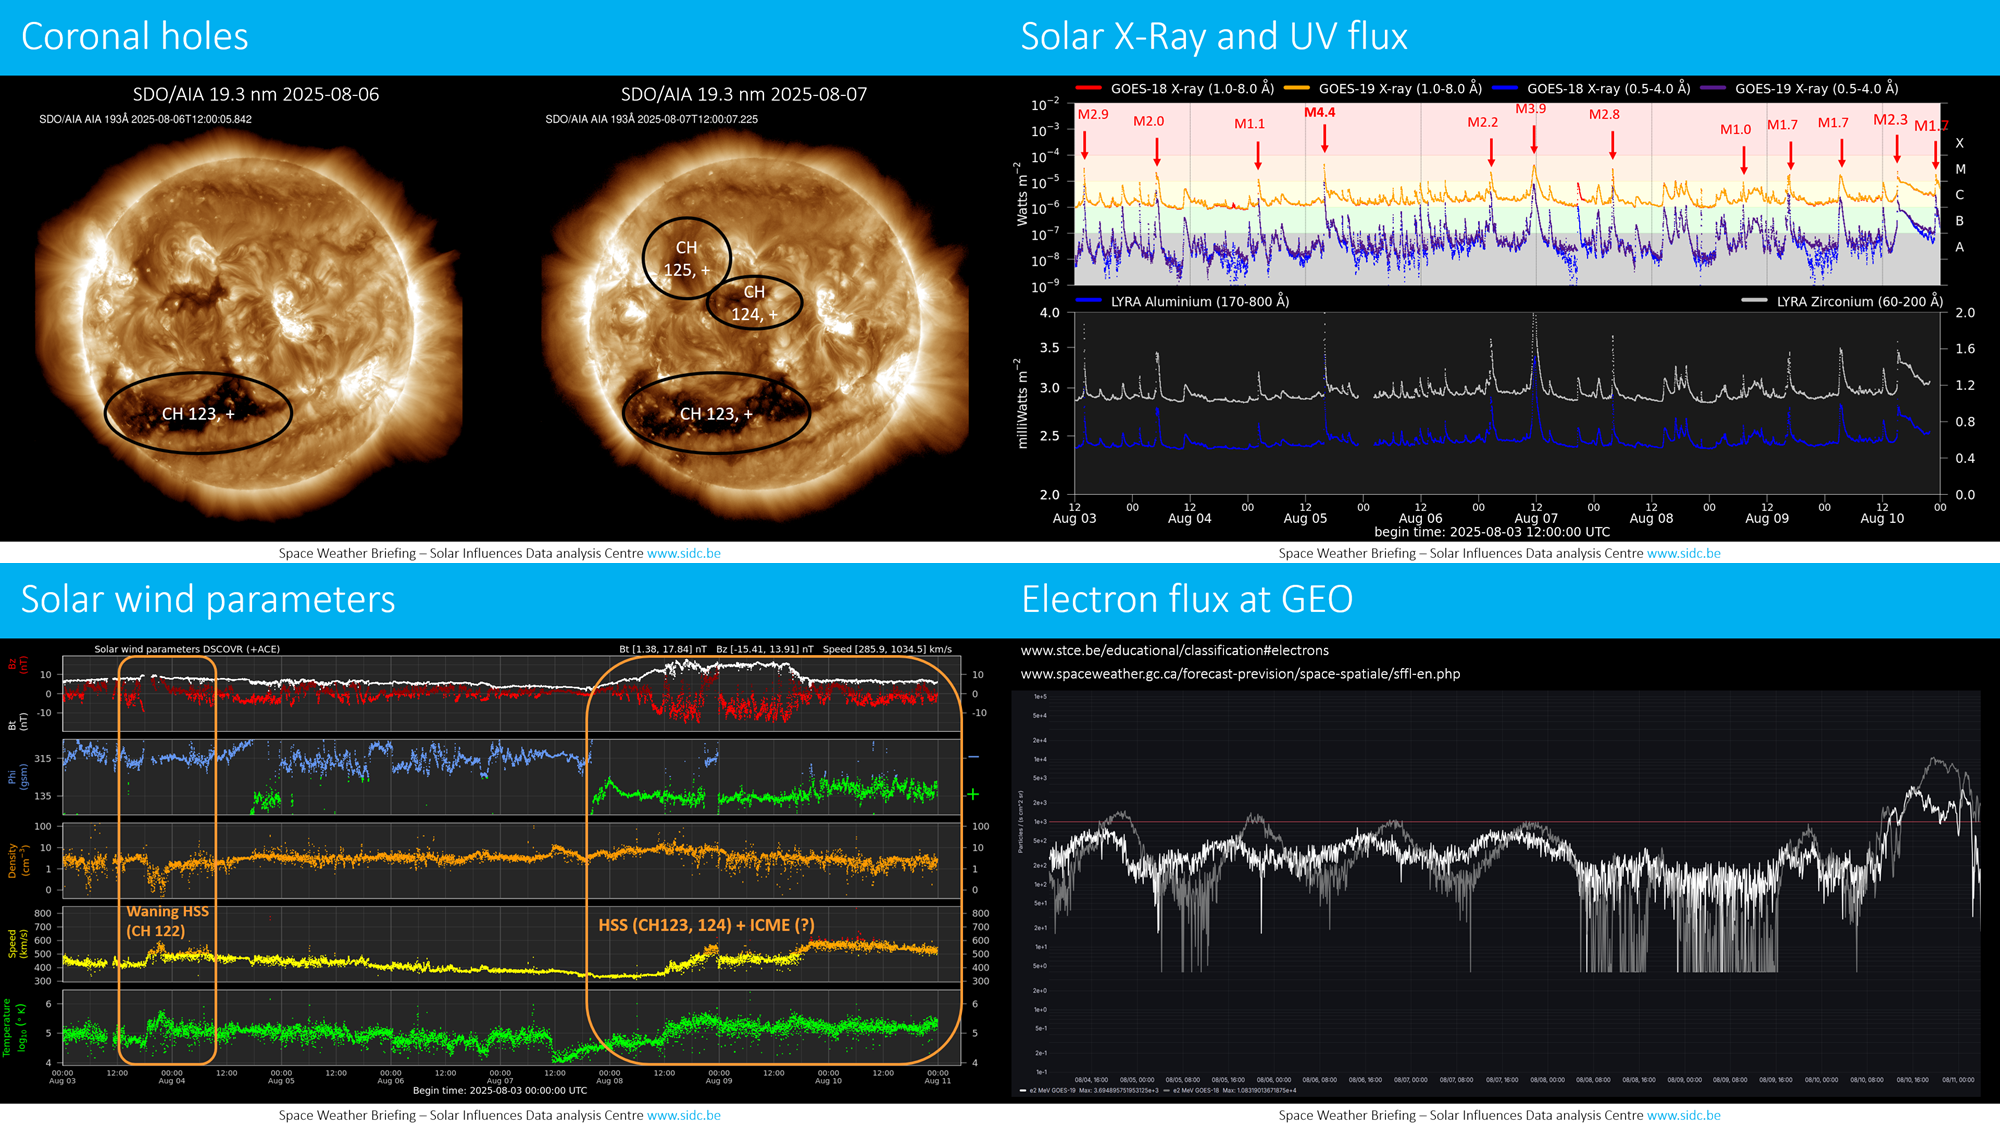
The SIDC Space Weather Briefing
The forecaster on duty presented the SIDC SWx briefing that gives an overview of space weather activity from August 4 to August 10.
The pdf of the presentation can be found here: https://www.stce.be/briefings/20250811_SWbriefing.pdf
Review of Ionospheric Activity
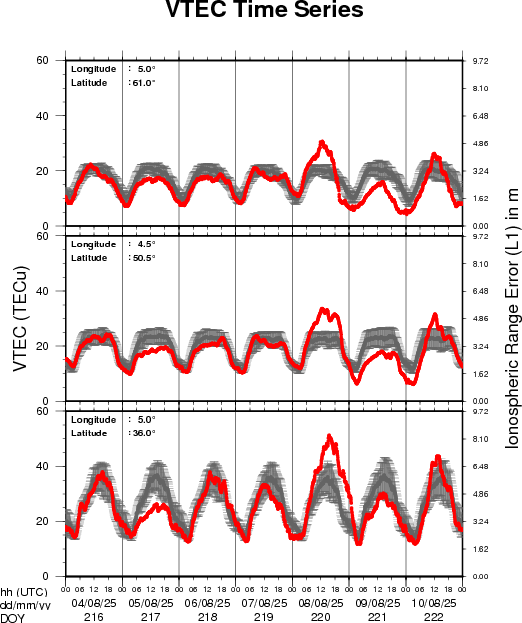

VTEC time series at 3 locations in Europe from 4 Aug 2025 till 10 Aug 2025
The top figure shows the time evolution of the Vertical Total Electron Content (VTEC) (in red) during the last week at three locations:
a) in the northern part of Europe(N 61deg E 5deg)
b) above Brussels(N 50.5deg, E 4.5 deg)
c) in the southern part of Europe(N 36 deg, E 5deg)
This top figure also shows (in grey) the normal ionospheric behaviour expected based on the median VTEC from the 15 previous days.
The time series below shows the VTEC difference (in green) and relative difference (in blue) with respect to the median of the last 15 days in the North, Mid (above Brussels) and South of Europe. It thus illustrates the VTEC deviation from normal quiet behaviour.
The VTEC is expressed in TECu (with TECu=10^16 electrons per square meter) and is directly related to the signal propagation delay due to the ionosphere (in figure: delay on GPS L1 frequency).
The Sun's radiation ionizes the Earth's upper atmosphere, the ionosphere, located from about 60km to 1000km above the Earth's surface.The ionization process in the ionosphere produces ions and free electrons. These electrons perturb the propagation of the GNSS (Global Navigation Satellite System) signals by inducing a so-called ionospheric delay.
See http://stce.be/newsletter/GNSS_final.pdf for some more explanations; for more information, see https://gnss.be/SpaceWeather
STCE courses and presentations
Courses, seminars, presentations and events with the Sun-Space-Earth system and Space Weather as the main theme. We provide occasions to get submerged in our world through educational, informative and instructive activities.
* Aug 25, Guest lecture: De Zon, Zomerschool Sterrenkunde, Vereniging voor Sterrenkunde, Leuven, Belgium
* Sep 1, STCE seminar: High resolution solar telescopes: the Dutch Open Telescope and beyond, Space Pole Uccle
* Sep 8-10, STCE course: Role of the ionosphere and space weather in military communications, Brussels, Belgium - register: https://events.spacepole.be/event/226/
* Sep 20, Public Lecture: België op weg naar de zon met Proba-3, UGhent Volkssterrenwacht Armand Pien, Gent, Belgium
* Oct 23-25, ESWW Space Weather Training by Umea University and STCE, Kiruna, Sweden - Full
* Oct 27-31, European Space Weather Week, Umea, Sweden - https://esww.eu/
* Nov 17-19, STCE Space Weather Introductory Course, Brussels, Belgium - register: https://events.spacepole.be/event/217/
To register for a course and check the seminar details, navigate to the STCE Space Weather Education Center: https://www.stce.be/SWEC
If you want your event in the STCE newsletter, contact us: stce_coordination at stce.be

Website: https://www.stce.be/SWEC