- Table of Content
- 1.Northern Light...
- 2.Give your scie...
- 3.Review of Sola...
- 4.International ...
- 5.PROBA2 Observa...
- 6.Noticeable Sol...
- 7.Geomagnetic Ob...
- 8.Review of Iono...
- 9.The SIDC Space...
- 10.Upcoming STCE ...
2. Give your scientific poster a second life!
3. Review of Solar and Geomagnetic Activity
4. International Sunspot Number by SILSO
5. PROBA2 Observations
6. Noticeable Solar Events
7. Geomagnetic Observations in Belgium
8. Review of Ionospheric Activity
9. The SIDC Space Weather Briefing
10. Upcoming STCE Activities
Northern Lights over Belgium
November 12, 2025, very early in the morning. Colleagues from the STCE, the Belgian Space Weather Centre, admire the northern lights from their terrace in Brussels and are amazed by the spectacle of colors. After all, it is quite exceptional to be able to observe this phenomenon in Belgium (let alone in the middle of a city with a lot of light pollution), even if our sun is now in the most active phase of its cycle.
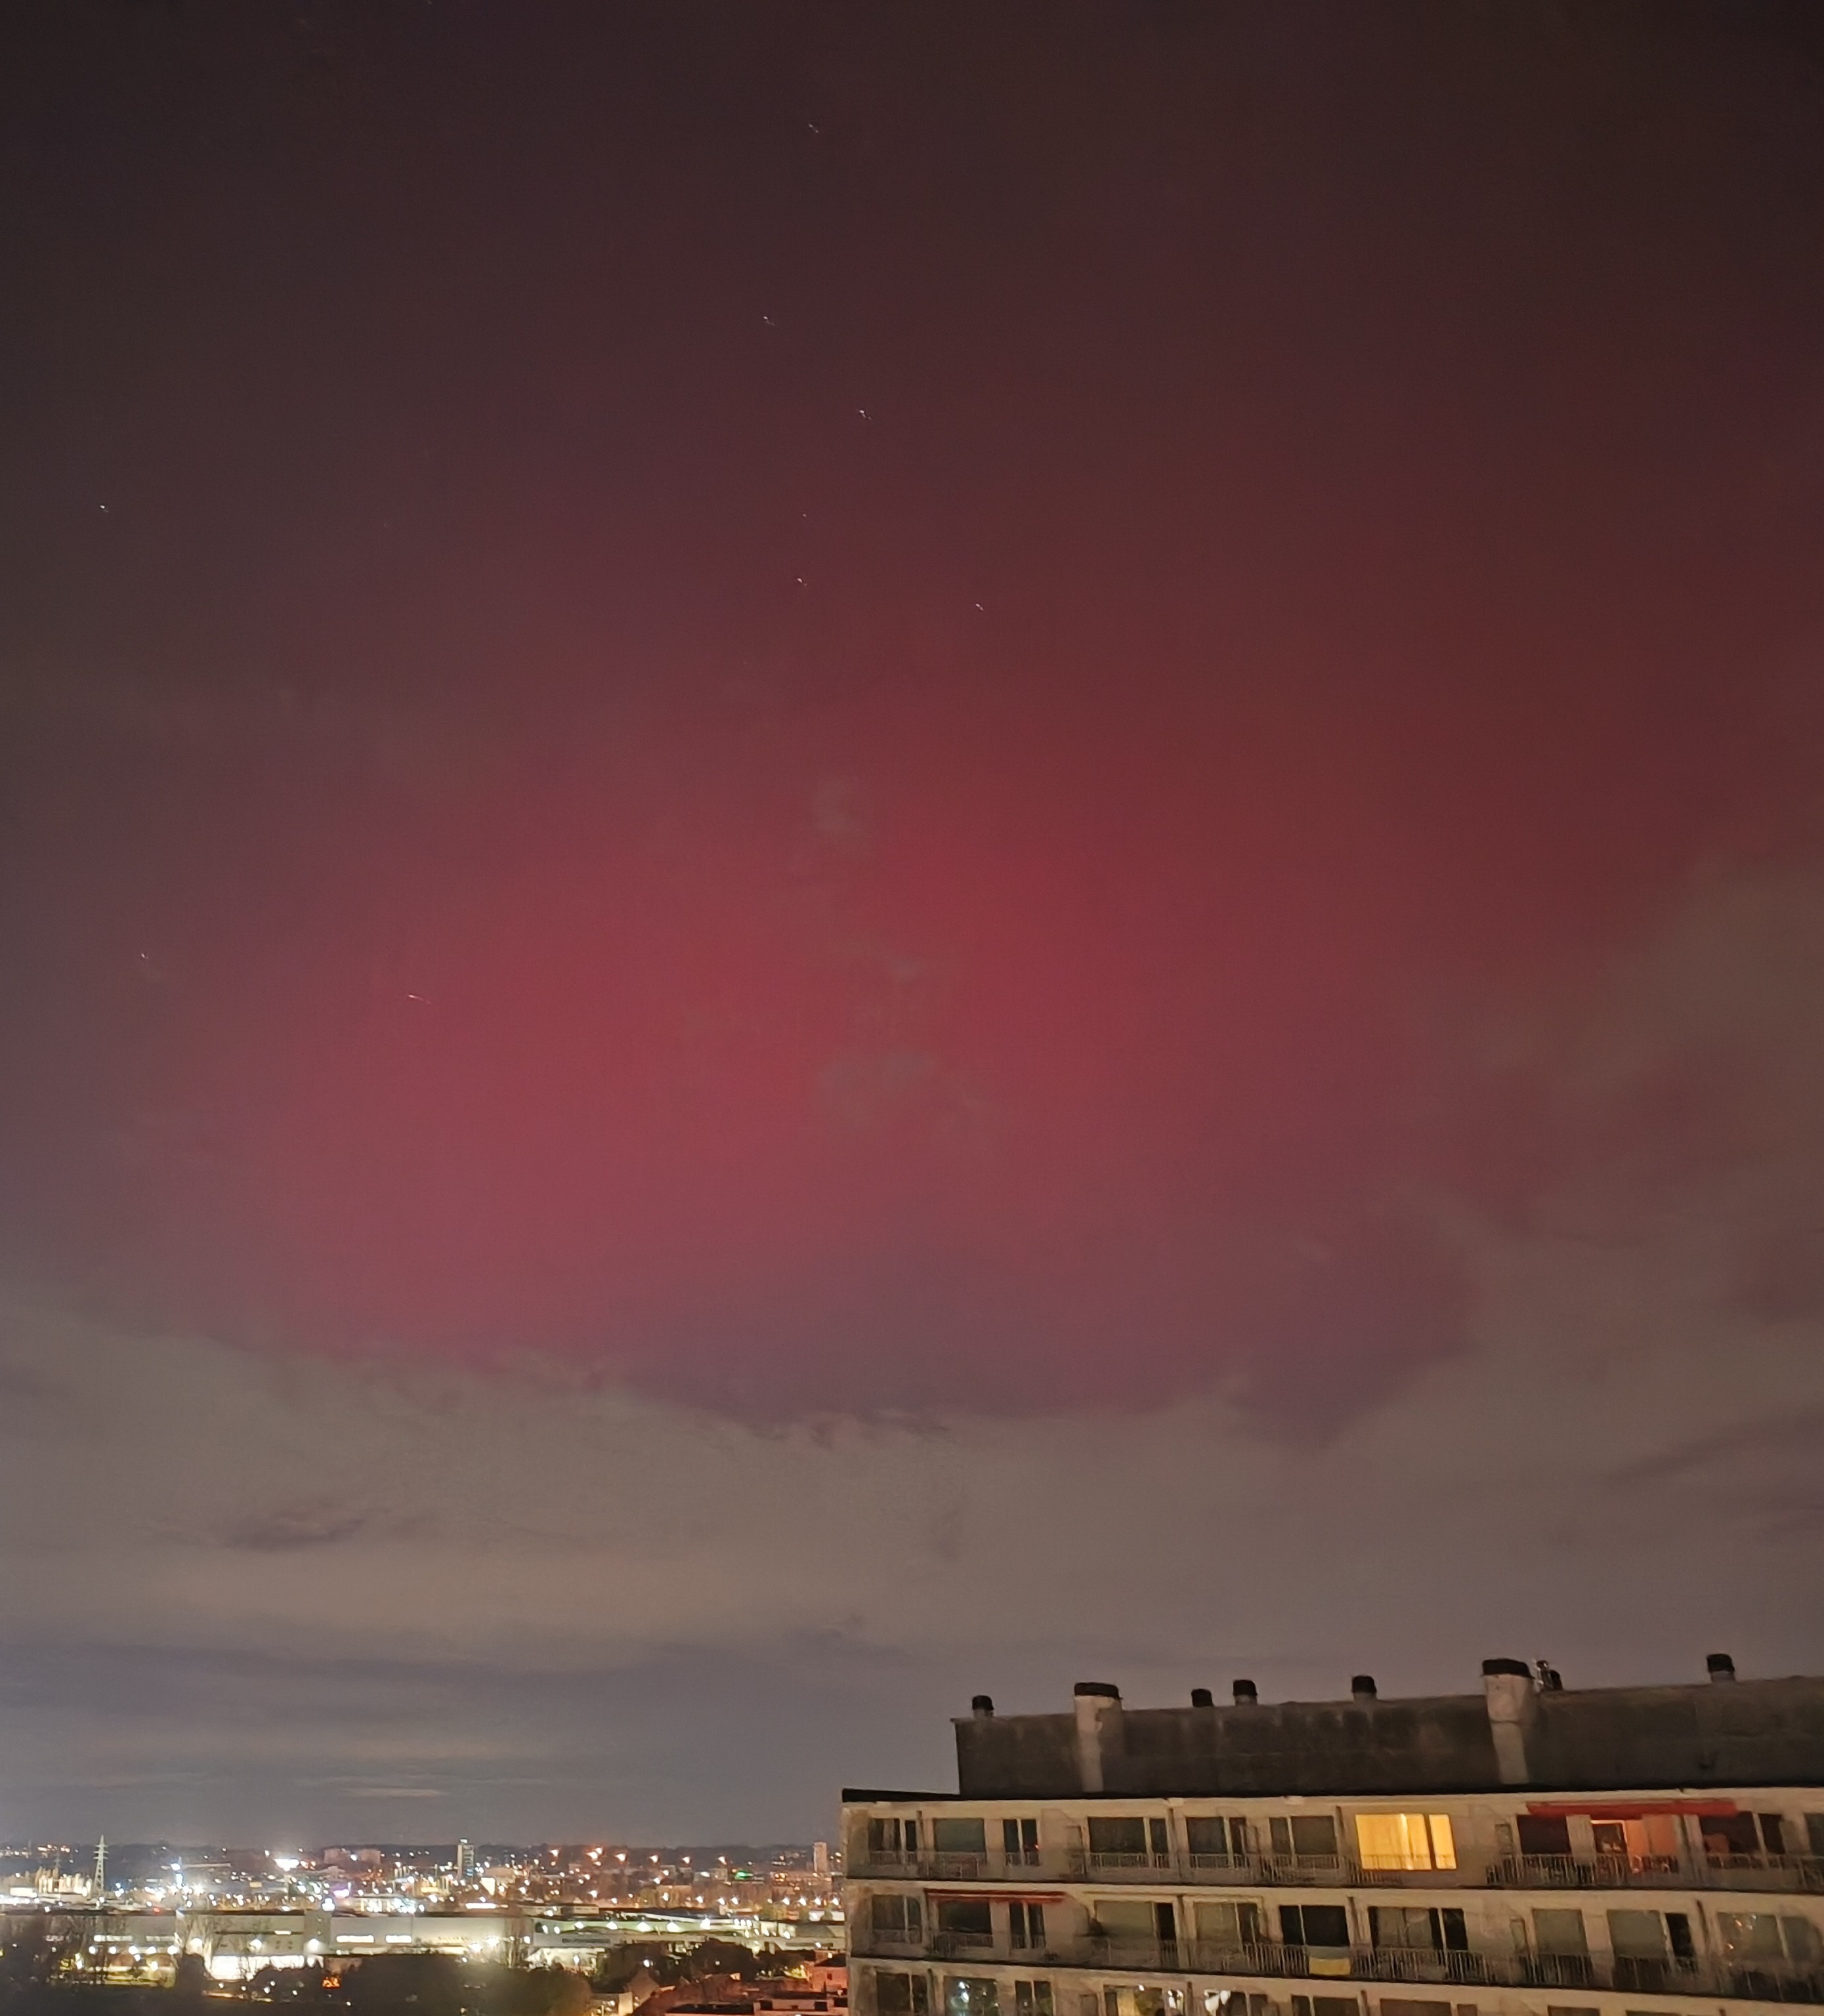
Image credits: Nancy Narang (ROB)
Indeed, the sun is the cause of these northern lights. In recent days, our Earth has been in the sights of a very active solar region. This region produced several solar flares of the highest category (X). These were accompanied by eruptions of solar plasma and protons, which are very fast particles. The successive plasma clouds were directed towards Earth and were launched with increasingly higher speeds.
Stormy nights
During the night from November 11 to 12, the first of these solar clouds arrived at Earth. They caused very strong disturbances in our magnetic field. This is measured using ground-based instruments called magnetometers, which, for Belgium, we have installed in Dourbes and Manhay. Based on these measurements, a local K-index is compiled that reflects the disturbance of the magnetic field in our region. A local K > 8 indicates the possibility of visible northern lights in Belgium. The graph below clearly shows that this condition was met last night.
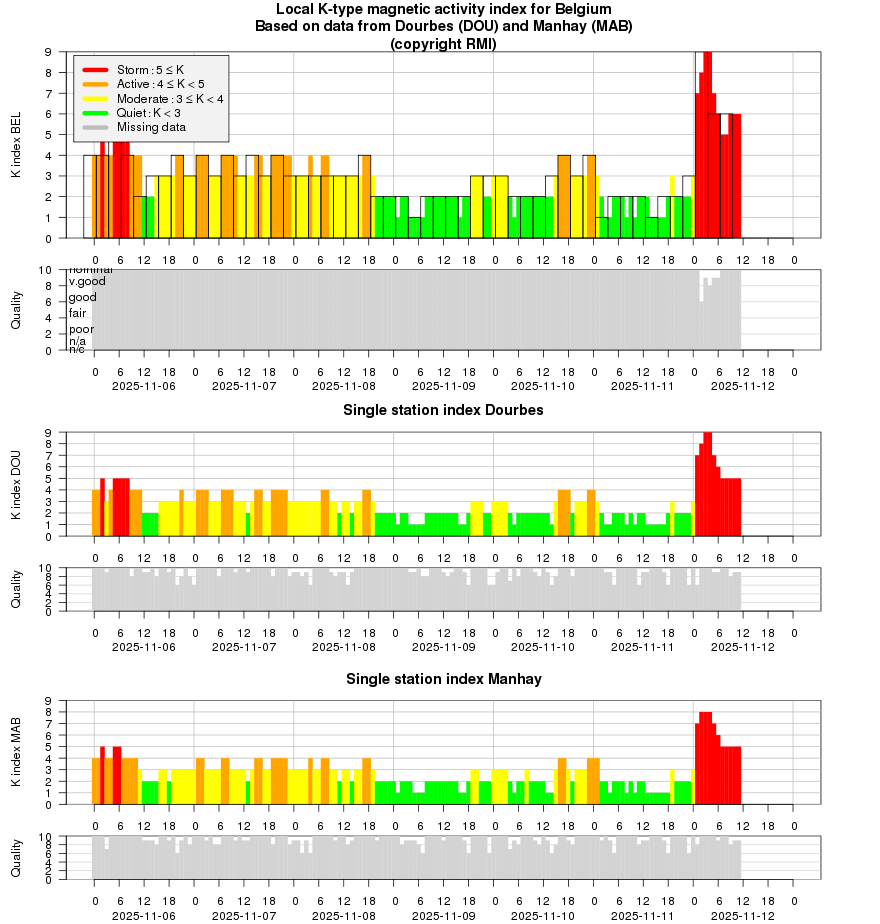
Magnetic Activity Indices for Belgium (http://ionosphere.meteo.be/geomagnetism/K_BEL/)
Should we be concerned?
The northern lights are primarily a beautiful spectacle to be enjoyed to the fullest, but a geomagnetic storm can affect our technology. In addition to the geomagnetic field, they also disrupt the ionosphere, a layer in our atmosphere that is crucial for communication. Last night, warnings were sent to the aviation industry to alert them to disruptions in their radio communications. GPS positioning may also be slightly less accurate during a storm. In countries closer to the poles, disruptions can occur in the electricity grid. Network operators and the Belgian Defense were therefore also notified. The STCE was monitoring the situation closely.
What could we expect next?
On November 11, this active region launched another strong solar flare and plasma cloud. This cloud left the sun at a speed of more than 1500 km per second and raced through space toward Earth. The STCE forecasters estimated it would reach us during the night of November 12 andtherefore expected additional disruption to our magnetic field. This cloud di arrive but turned out to have a predominantly northward component in its magnetic field, resulting in only minor disturbances.
Space weather will still remain stormy for a few more days, as the effects from the combined storms wane.
In addition, the sun is still very active, especially in the area causing all these disturbances. Proof of that is the X4 flare that it launched just this morning. Stay tuned for a complete overview of this region's activity in next week's newsletter!
Give your scientific poster a second life!
Have you ever created a scientific poster for a conference or symposium? Then submit it to The Floor is Yours (https://thefloorisyours.be/en/) *Poster Showcase*!
From all entries, ten posters will be selected for the Poster Hall of Fame, a growing collection of the best and most inspiring examples. No more posters disappearing into a digital drawer after the conference!
The selected posters will receive feedback, and your research, and the hard work you did on your poster, will once again be put in the spotlight.
Send your poster in now. Deadline 20th of November via this link: https://thefloorisyours.be/en/posters-en/join-our-poster-showcase-and-expand-the-reach-of-your-poster/
Who will make it into the Poster Hall of Fame?

Review of Solar and Geomagnetic Activity
WEEK 1297 from 2025 Nov 03
Solar Active Regions (ARs) and flares
The Solar flaring activity was at moderate to high levels throughout the week, with 62 C-class flares, 9 M-class flares and 3 X-class observed. There were 10 sunspot groups observed on the visible solar disk. SIDC SG 687 (NOAA AR 4274), SIDC SG 690 (NOAA AR 4277) and SIDC SG 689 (NOAA AR 4276) produced most of the flaring activity.
The largest flare was a X1.8 flare, peaking on November 04 at 17:34 UTC. The second largest flare was a X1.7 flare peaking on November 09 at 07:35 UTC Both of these flares were produced by SIDC Sunspot Group 687. The third largest was a X1.1 flare peaking on November 04 at 22:01 UTC, which was probably produced by SIDC SG 689 while it was still over the east limb.
Coronal mass ejections
Seven Coronal mass ejections (CMEs) with an Earth directed component were observed throughout the week. All these CMEs were associated with SIDC SG 687. The first CME was seen in LASCO-C2 data at 09:24 UTC on November 03, with an estimated speed of 1118 km/s. A second halo CME was seen in LASCO-C2 data at 17:24 UTC on November 04 associated with a X1.8 flare, with an estimated speed of 1297 km/s. A third halo CME was seen in LASCO-C2 data at 11:00 UTC on November 05 associated with a M7.4 flare, with an estimated speed of 844 km/s. A fourth halo CME was seen in LASCO-C2 data at 22:12 UTC on November 05 associated with a M8.6 flare, with an estimated speed of 800 km/s. A fifth halo CME was seen in LASCO-C2 data at 07:36 UTC on November 07 associated with a M1.76 flare, with an estimated speed of 528 km/s. A sixth CME was seen in LASCO-C2 data at 12:12 UTC on November 07 associated with a C3.1 flare, with an estimated speed of 350 km/s. A seventh halo CME was seen in LASCO-C2 data at 07:12 UTC on November 09 associated with a X1.79 flare, with an estimated speed of 720 km/s.
Coronal Holes
One positive polarity (SIDC CH 123) and two negative polarity (SIDC CH 116 and 126) coronal holes were present on the solar disk in the past week. Returning, equatorial SIDC Coronal Hole 116 first reached the central meridian on November 03 (Other crossing times: October 08, September 10, August 15, July 20, June 22, May 26) and completed its crossing on November 06. The high-speed stream (HSS) associated with SIDC Coronal Hole 116 reached the Earth on November 05.
Proton flux levels
The greater than 10 MeV GOES proton flux became elevated on November 05 until November 06 due to a CME that left the Sun on November 04 but remained below the 10 pfu threshold. The 10 MeV GOES proton flux remained at nominal levels for the rest of the week.
Electron fluxes at GEO
The greater than 2 MeV electron flux, as measured by GOES-18 and GOES-19 was above the 1000 pfu threshold at the start of the week until November 05. The 24-hour electron fluence was at moderate levels at the start of the week until November 05 and then stayed at normal level until the end of the week.
Solar wind
At the beginning of the week, solar wind conditions at Earth were mildly disturbed under the waning influence of high-speed streams (HSSs) associated with SIDC Coronal Hole 123 and 129. They became disturbed again by the arrival of a high-speed stream on November 05 at 17:15 UT associated with SIDC Coronal Hole 116, a ICME arrival at 18:40 UT on November 06 associated with a CME that left the Sun on November 03, an ICME arrival at 05:00 UT on November 07 associated with a CME that left the Sun on November 04 and a ICME arrival at 22:00 on November 07 associated with a CME that left the Sun on November 05.
The solar wind speed ranged between 336 km/s and 859 km/s. The total interplanetary magnetic field ranged between 1 nT and 24 nT, with the Bz reaching a minimum of – 17 nT. The phi-angle was in the positive sector at the start of the week until November 06 when it switched to the positive sector for the rest of the week.
Geomagnetism
The geomagnetic conditions were at active levels at the start of the week. They became quiet to unsettle on November 04. On November 05 they reached major storm conditions globally (Kp 7-) and moderate storm conditions locally (K BEL 6), under the influence of a high-speed stream and 3 ICMEs by November 08 they had returned to quiet to unsettled conditions. The period ended with quiet geomagnetic conditions.
International Sunspot Number by SILSO
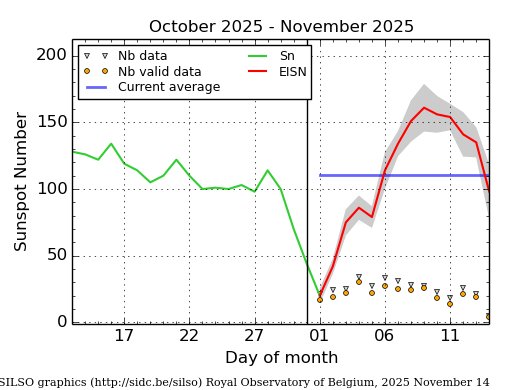
The daily Estimated International Sunspot Number (EISN, red curve with shaded error) derived by a simplified method from real-time data from the worldwide SILSO network. It extends the official Sunspot Number from the full processing of the preceding month (green line), a few days more than one solar rotation. The horizontal blue line shows the current monthly average. The yellow dots give the number of stations that provided valid data. Valid data are used to calculate the EISN. The triangle gives the number of stations providing data. When a triangle and a yellow dot coincide, it means that all the data is used to calculate the EISN of that day.
PROBA2 Observations
Solar Activity
Solar flare activity fluctuated from low to very high during the week.
In order to view the activity of this week in more detail, we suggest to go to the following website from which all the daily (normal and difference) movies can be accessed here: https://proba2.oma.be/ssa
This page also lists the recorded flaring events.
A weekly overview movie can be found here (SWAP week 815): http://proba2.oma.be/swap/data/mpg/movies/weekly_movies/weekly_movie_2025_11_03.mp4
Details about some of this week's events can be found further below.
If any of the linked movies are unavailable they can be found in the P2SC movie repository here: https://proba2.oma.be/swap/data/mpg/movies/
Tuesday Nov 04
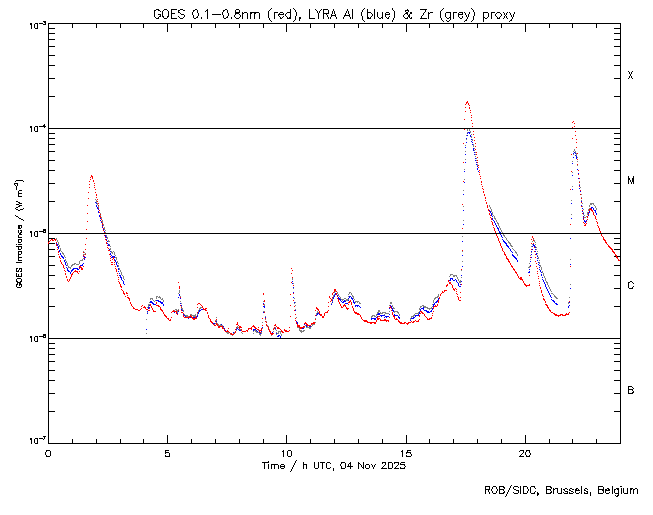
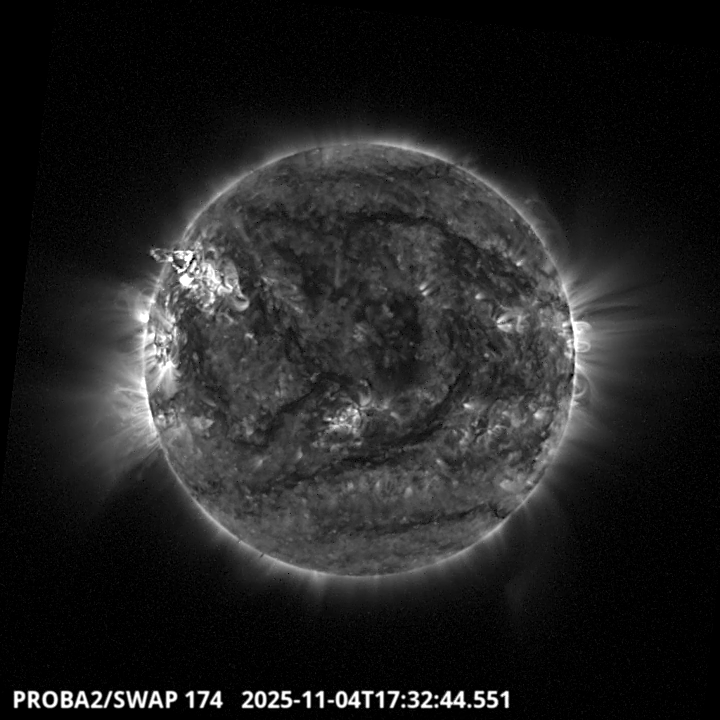
The largest flare of this week was a X1.8, and it was observed by LYRA (top panel) and SWAP (bottom panel). The flare peaked on 2025-Nov-04 at 17:34 UT and occurred on the North East side of the Solar disk, originating from active region NOAA 4274. A halo CME was detected by Lasco-C2 at 17:36 UT. Find a SWAP movie of the event here: https://proba2.sidc.be/swap/movies/20251104_swap_movie.mp4
Noticeable Solar Events
| DAY | BEGIN | MAX | END | LOC | XRAY | OP | 10CM | TYPE | Cat | NOAA |
| 03 | 0841 | 0925 | 0938 | M1.6 | VI/3 | 4274 | ||||
| 03 | 0938 | 1011 | 1037 | M5.0 | 4274 | |||||
| 03 | 1219 | 1235 | 1237 | M2.9 | VI/2IV/1 | 4274 | ||||
| 03 | 1704 | 1708 | 1710 | N26E69 | M1.5 | SF | 4274 | |||
| 04 | 0131 | 0148 | 0204 | M3.5 | III/2CTM/2 | 89 | 4274 | |||
| 03 | 1237 | 1247 | 1251 | M3.3 | 4274 | |||||
| 04 | 1715 | 1734 | 1751 | N26E63 | X1.8 | 1B | VI/2III/2IV/1 | 89 | 4274 | |
| 04 | 2145 | 2201 | 2211 | X1.1 | IV/1 | 4276 | ||||
| 04 | 2233 | 2244 | 2256 | N22E36 | M1.7 | 1 | III/2 | 88 | 4272 | |
| 05 | 1036 | 1119 | 1143 | N22E51 | M7.4 | 2N | 89 | 4274 | ||
| 05 | 2152 | 2207 | 2216 | N28E40 | M8.6 | 2B | II/3 | 89 | 4274 | |
| 06 | 0417 | 0431 | 0439 | M1.1 | 4276 | |||||
| 07 | 0631 | 0716 | 0753 | N23E28 | M1.7 | 1N | VI/2IV/3 | 89 | 4274 | |
| 09 | 0701 | 0735 | 0755 | N23W3 | X1.7 | 2 | II/2IV/2IV/2 | 89 | 4274 |
| LOC: approximate heliographic location | TYPE: radio burst type |
| XRAY: X-ray flare class | Cat: Catania sunspot group number |
| OP: optical flare class | NOAA: NOAA active region number |
| 10CM: peak 10 cm radio flux |
Geomagnetic Observations in Belgium

Local K-type magnetic activity index for Belgium based on data from Dourbes (DOU) and Manhay (MAB). Comparing the data from both measurement stations allows to reliably remove outliers from the magnetic data. At the same time the operational service availability is improved: whenever data from one observatory is not available, the single-station index obtained from the other can be used as a fallback system.
Both the two-station index and the single station indices are available here: http://ionosphere.meteo.be/geomagnetism/K_BEL/
Review of Ionospheric Activity


VTEC time series at 3 locations in Europe from 3 Nov 2025 till 9 Nov 2025
The top figure shows the time evolution of the Vertical Total Electron Content (VTEC) (in red) during the last week at three locations:
a) in the northern part of Europe(N 61deg E 5deg)
b) above Brussels(N 50.5deg, E 4.5 deg)
c) in the southern part of Europe(N 36 deg, E 5deg)
This top figure also shows (in grey) the normal ionospheric behaviour expected based on the median VTEC from the 15 previous days.
The time series below shows the VTEC difference (in green) and relative difference (in blue) with respect to the median of the last 15 days in the North, Mid (above Brussels) and South of Europe. It thus illustrates the VTEC deviation from normal quiet behaviour.
The VTEC is expressed in TECu (with TECu=10^16 electrons per square meter) and is directly related to the signal propagation delay due to the ionosphere (in figure: delay on GPS L1 frequency).
The Sun's radiation ionizes the Earth's upper atmosphere, the ionosphere, located from about 60km to 1000km above the Earth's surface.The ionization process in the ionosphere produces ions and free electrons. These electrons perturb the propagation of the GNSS (Global Navigation Satellite System) signals by inducing a so-called ionospheric delay.
See http://stce.be/newsletter/GNSS_final.pdf for some more explanations; for more information, see https://gnss.be/SpaceWeather
The SIDC Space Weather Briefing
The forecaster on duty presented the SIDC briefing that gives an overview of space weather from November 3 to 9.
The pdf of the presentation can be found here: https://www.stce.be/briefings/20251110_SWbriefing.pdf
Upcoming STCE Activities
Courses, seminars, presentations and events with the Sun-Space-Earth system and Space Weather as the main theme. We provide occasions to get submerged in our world through educational, informative and instructive activities.
* Nov 17-19, STCE Space Weather Introductory Course, Brussels, Belgium - register: https://events.spacepole.be/event/217/ - Full
* Nov 18, STCE seminar Real time detection and characterisation of solar flares from ground-based VLF data, Space Pole, Brussels, Belgium
* Feb 9-11, 2026, STCE Space Weather Introductory Course, Brussels, Belgium - register: https://events.spacepole.be/event/255/
* Mar 16-18, 2026, STCE course: Role of the ionosphere and space weather in military communications, Brussels, Belgium - register: https://events.spacepole.be/event/258/
* Apr 20-21, 2026, STCE cursus: inleiding tot het ruimteweer, Brussels, Belgium - register: https://events.spacepole.be/event/260/
* Mar 23, 2026, STCE lecture: From physics to forecasting, Space Weather course, ESA Academy, Redu, Belgium
* Jun 15-17, 2026, STCE Space Weather Introductory Course, Brussels, Belgium - register: https://events.spacepole.be/event/256/
* Oct 12-14, 2026, STCE Space Weather Introductory Course, Brussels, Belgium - register: https://events.spacepole.be/event/257/
* Nov 23-25, 2026, STCE course: Role of the ionosphere and space weather in military communications, Brussels, Belgium - register: https://events.spacepole.be/event/259/
* Dec 7-9, 2026, STCE Space Weather Introductory Course for Aviation, Brussels, Belgium - register: https://events.spacepole.be/event/262/
To register for a course and check the seminar details, navigate to the STCE Space Weather Education Center: https://www.stce.be/SWEC
If you want your event in the STCE newsletter, contact us: stce_coordination at stce.be
Website: https://www.stce.be/SWEC