- Table of Content
- 1.Season's greet...
- 2.Review of Sola...
- 3.International ...
- 4.PROBA2 Observa...
- 5.Noticeable Sol...
- 6.Geomagnetic Ob...
- 7.Review of Iono...
- 8.The SIDC Space...
- 9.Upcoming Activ...
2. Review of Solar and Geomagnetic Activity
3. International Sunspot Number by SILSO
4. PROBA2 Observations
5. Noticeable Solar Events
6. Geomagnetic Observations in Belgium
7. Review of Ionospheric Activity
8. The SIDC Space Weather Briefing
9. Upcoming Activities
Season's greetings
The STCE wishes you a joyous holiday season and a new year filled with curiosity, science, and new discoveries.
With special wishes from the Proba-3/ASPIICS and Solar Orbiter/EUI teams.


Review of Solar and Geomagnetic Activity
WEEK 1303 from 2025 Dec 15
Solar Active Regions (ARs) and flares
Solar flaring activity has been mostly low throughout the week, with moderate activity towards the end of the week (on December 19-21, with three M-class flares in total). The first was an M1.0 flare (SIDC Flare 6450) from beyond the west limb, peaking at 15:58 UTC on December 19.
The second was an M1.0 flare (SIDC Flare 6457), associated with SIDC Sunspot Group 703 (NOAA Active Region 4312, magnetic type alpha), peaking at 07:53 UTC on December 20. The third was an M1.3 (SIDC Flare 6467), associated with SIDC Sunspot Group 731 (NOAA Active Region 4316, magnetic type beta), peaking at 18:27 UTC on December 21.
There was a total of 20 numbered active regions on the visible disk, with magnetic types alpha and beta.
Coronal mass ejections
A few Coronal Mass Ejections (CMEs) were detected during the week, but none was Earth-directed. A wide CME (SIDC CME 610) was observed in LASCO/C2 and STEREO/COR2 coronagraph imagery, lifting off the southwest quadrant, starting from around 00:25 UTC on December 15. It was most likely associated with a prominence eruption near the southwest limb.
SIDC CME 611 was observed in STEREO-A/COR2 coronagraph imagery, lifting off the north limb around 03:00 UTC on December 17. It was a backsided event.
A slow CME (SIDC CME 612) was observed in LASCO/C2 and STEREO-A/COR2 coronagraph imagery, lifting off around 04:00 UTC on December 18. It was likely associated with a prominence eruption in the southwest limb.
Coronal Holes
A northern, negative polarity coronal hole with complex, elongated structure (split in SIDC Coronal Holes 142, 138 and 137) crossed the central meridian during the last week. A southern, positive polarity coronal hole (SIDC Coronal Hole 128) still resides on the central meridian (first crossing on December 20).
Proton flux levels
The greater than 10 MeV proton flux was below the 10 pfu threshold throughout the week.
Electron fluxes at GEO
The greater than 2 MeV electron flux as measured by GOES 18 and GOES 19 was below the 1000 pfu threshold at the beginning of the week. Since the UTC noon on December 18, it has been mostly above the threshold. The 24-hour electron fluence was at moderate levels between December 18-20.
Solar wind
The solar wind conditions were enhanced at the beginning of the week, following the arrival of a high-speed stream from SIDC Coronal Hole 142 and later from SIDC Coronal Holes 136 and 137 (all with negative polarity). Solar wind speed values reached a maximum of around 680 km/s. The interplanetary magnetic field reached a maximum of 14 nT. The Bz component was mostly positive, reaching a maximum of 10 nT.
A gradual return to the slow wind regime followed, with speed values decreasing to around 380 km/s. A second high-speed stream arrival (from SIDC Coronal Hole 128, positive polarity) was observed starting from 00:30 UTC on December 21. The solar wind speed values increased from 400 km/s to around 650 km/s. The interplanetary magnetic field values increased to a maximum of 15 nT. The Bz component reached a minimum of -12 nT. The interplanetary magnetic field angle phi switched to positive.
Geomagnetism
Geomagnetic conditions globally first reached minor storm levels (NOAA Kp 5- ) between 21:00 UTC on December 17 and 00:00 UTC on December 18. Two intervals of minor storm conditions occurred on December 21 (15:00 UTC to 18:00 UTC and 21:00 to 00:00 UTC).
Geomagnetic conditions locally were mostly quiet to unsettled (K Bel 2 to 3) during the week, with minor storm levels (K Bel 5) between 14:00 UTC and 16:00 UTC on December 21 and later between 23:00 UTC on December 21 and 00:00 UTC on December 22. The minor storm conditions were the consequence of the high-speed stream arrivals from SIDC Coronal Holes 142, 136 and 137 (negative polarity) and SIDC Coronal Hole 128 (positive polarity) respectively.
International Sunspot Number by SILSO

The daily Estimated International Sunspot Number (EISN, red curve with shaded error) derived by a simplified method from real-time data from the worldwide SILSO network. It extends the official Sunspot Number from the full processing of the preceding month (green line), a few days more than one solar rotation. The horizontal blue line shows the current monthly average. The yellow dots give the number of stations that provided valid data. Valid data are used to calculate the EISN. The triangle gives the number of stations providing data. When a triangle and a yellow dot coincide, it means that all the data is used to calculate the EISN of that day.
PROBA2 Observations
Solar Activity
Solar flare activity fluctuated from low to moderate during the week.
In order to view the activity of this week in more detail, we suggest to go to the following website from which all the daily (normal and difference) movies can be accessed: https://proba2.oma.be/ssa
This page also lists the recorded flaring events.
A weekly overview movie can be found here (SWAP week 821): https://proba2.sidc.be/swap/data/mpg/movies/weekly_movies/weekly_movie_2025_12_15.mp4
Details about some of this week's events can be found further below.
If any of the linked movies are unavailable they can be found in the P2SC movie repository here: https://proba2.sidc.be/swap/data/mpg/movies/
Sunday Dec 21
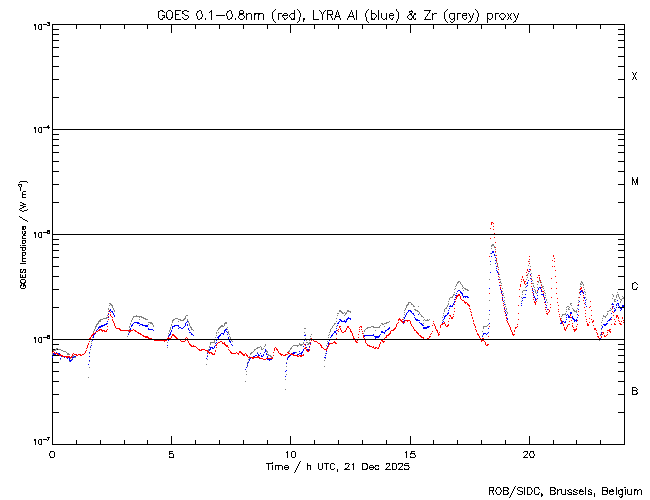
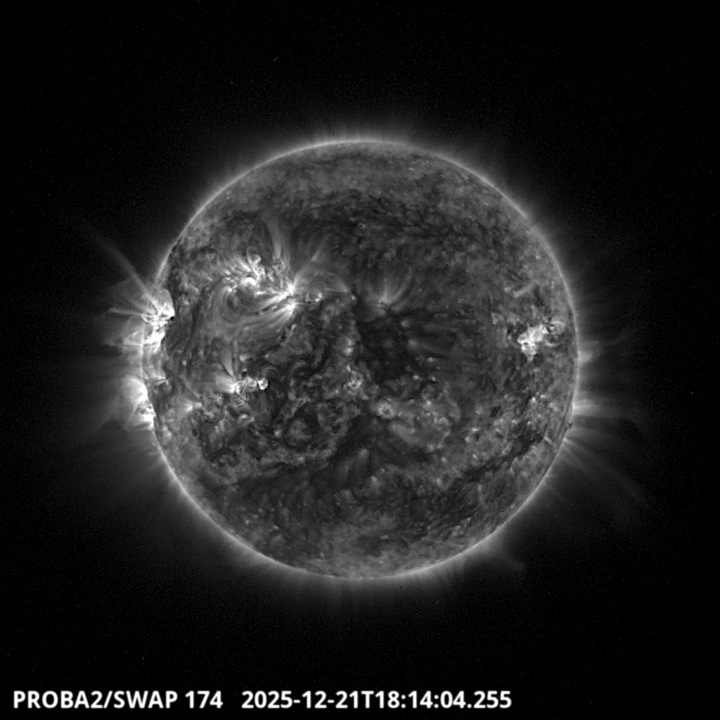
The largest flare of this week was an M1.3, and it was observed by LYRA (top panel) and SWAP
(bottom panel). The flare peaked on 2025-Dec-21 at 18:27 UT and occurred in the South-East
part of the solar disk, originating from active region NOAA4316 (SIDC 731). Find a SWAP movie of the event here: https://proba2.sidc.be/swap/movies/20251221_swap_movie.mp4
Noticeable Solar Events
| DAY | BEGIN | MAX | END | LOC | XRAY | OP | 10CM | TYPE | Cat | NOAA |
| 19 | 1535 | 1558 | 1608 | M1.0 | ||||||
| 20 | 0736 | 0753 | 0806 | N19E58 | M1.0 | SF | III/2II/3 | 4315 | ||
| 21 | 1812 | 1827 | 1836 | S7E28 | M1.3 | SF | 4316 |
| LOC: approximate heliographic location | TYPE: radio burst type |
| XRAY: X-ray flare class | Cat: Catania sunspot group number |
| OP: optical flare class | NOAA: NOAA active region number |
| 10CM: peak 10 cm radio flux |
Geomagnetic Observations in Belgium

Local K-type magnetic activity index for Belgium based on data from Dourbes (DOU) and Manhay (MAB). Comparing the data from both measurement stations allows to reliably remove outliers from the magnetic data. At the same time the operational service availability is improved: whenever data from one observatory is not available, the single-station index obtained from the other can be used as a fallback system.
Both the two-station index and the single station indices are available here: http://ionosphere.meteo.be/geomagnetism/K_BEL/
Review of Ionospheric Activity


VTEC time series at 3 locations in Europe from 15 Dec 2025 till 21 Dec 2025
The top figure shows the time evolution of the Vertical Total Electron Content (VTEC) (in red) during the last week at three locations:
a) in the northern part of Europe(N 61deg E 5deg)
b) above Brussels(N 50.5deg, E 4.5 deg)
c) in the southern part of Europe(N 36 deg, E 5deg)
This top figure also shows (in grey) the normal ionospheric behaviour expected based on the median VTEC from the 15 previous days.
The time series below shows the VTEC difference (in green) and relative difference (in blue) with respect to the median of the last 15 days in the North, Mid (above Brussels) and South of Europe. It thus illustrates the VTEC deviation from normal quiet behaviour.
The VTEC is expressed in TECu (with TECu=10^16 electrons per square meter) and is directly related to the signal propagation delay due to the ionosphere (in figure: delay on GPS L1 frequency).
The Sun's radiation ionizes the Earth's upper atmosphere, the ionosphere, located from about 60km to 1000km above the Earth's surface.The ionization process in the ionosphere produces ions and free electrons. These electrons perturb the propagation of the GNSS (Global Navigation Satellite System) signals by inducing a so-called ionospheric delay.
See http://stce.be/newsletter/GNSS_final.pdf for some more explanations; for more information, see https://gnss.be/SpaceWeather
The SIDC Space Weather Briefing
The forecaster on duty presented the SIDC briefing that gives an overview of space weather from December 15 to 21.
The pdf of the presentation can be found here: https://www.stce.be/briefings/20251222_SWbriefing.pdf
Upcoming Activities
Courses, seminars, presentations and events with the Sun-Space-Earth system and Space Weather as the main theme. We provide occasions to get submerged in our world through educational, informative and instructive activities.
* Feb 9-11, 2026, STCE Space Weather Introductory Course, Brussels, Belgium - register: https://events.spacepole.be/event/255/
* Mar 16-18, 2026, STCE course: Role of the ionosphere and space weather in military communications, Brussels, Belgium - register: https://events.spacepole.be/event/258/
* Apr 20-21, 2026, STCE cursus: inleiding tot het ruimteweer, Brussels, Belgium - register: https://events.spacepole.be/event/260/
* Mar 23, 2026, STCE lecture: From physics to forecasting, Space Weather course, ESA Academy, Redu, Belgium
* Jun 15-17, 2026, STCE Space Weather Introductory Course, Brussels, Belgium - register: https://events.spacepole.be/event/256/
* Oct 12-14, 2026, STCE Space Weather Introductory Course, Brussels, Belgium - register: https://events.spacepole.be/event/257/
* Nov 23-25, 2026, STCE course: Role of the ionosphere and space weather in military communications, Brussels, Belgium - register: https://events.spacepole.be/event/259/
* Dec 7-9, 2026, STCE Space Weather Introductory Course for Aviation, Brussels, Belgium - register: https://events.spacepole.be/event/262/
To register for a course and check the seminar details, navigate to the STCE Space Weather Education Center: https://www.stce.be/SWEC
If you want your event in the STCE newsletter, contact us: stce_coordination at stce.be
Website: https://www.stce.be/SWEC