- Table of Content
- 1.A sunspot oddi...
- 2.Space movie of...
- 3.Eruptosaurus S...
- 4.Review of spac...
- 5.PROBA2 Observa...
- 6.International ...
- 7.Noticeable Sol...
- 8.Geomagnetic Ob...
- 9.The SIDC Space...
- 10.Review of Iono...
- 11.Upcoming activ...
2. Space movie of Proba-3
3. Eruptosaurus Solaris
4. Review of space weather
5. PROBA2 Observations (5 Jan 2026 - 11 Jan 2026)
6. International Sunspot Number by SILSO
7. Noticeable Solar Events
8. Geomagnetic Observations in Belgium
9. The SIDC Space Weather Briefing
10. Review of Ionospheric Activity
11. Upcoming activities
A sunspot oddity
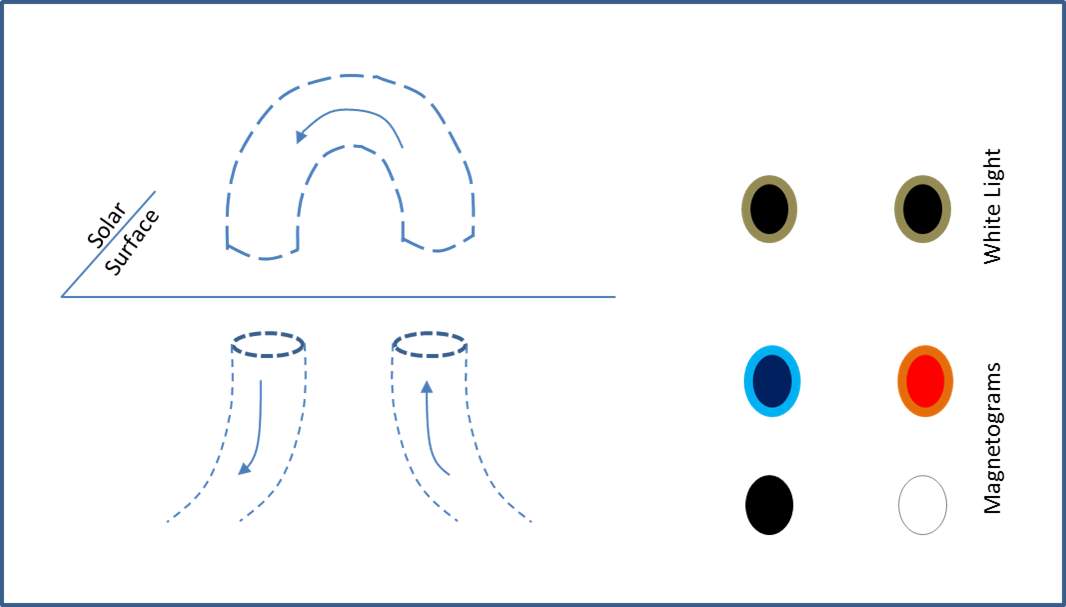
Sunspots have their origin in magnetic flux tubes rising from the solar interior and breaking through the solar surface. These magnetic disturbances create a local cooling compared to their surroundings. Due to the temperature difference, sunspots are visible in white light as dark specks on the solar surface. Seen in a magnetogram, i.e. a map of the solar disk showing the strength and direction of the Sun's magnetic field across its visible surface, sunspots look slightly different. Spots where the magnetic field (tube) comes out of the surface are often displayed as red or white. Spots where the magnetic field returns into the Sun are usually depicted in blue or black. Thus, typical sunspot groups are bipolar and have magnetic polarities that can easily be distinguished, i.e. their leading and trailing portion have opposite magnetic polarities (see sketch below). Unipolar regions are usually the result of the magnetic field being too weak to form sunspots. This often happens in the trailing portion of the active region, usually when the sunspot group is decaying. In white light, observers then see a single sunspot while the corresponding magnetogram shows an unipolar magnetic polarity.
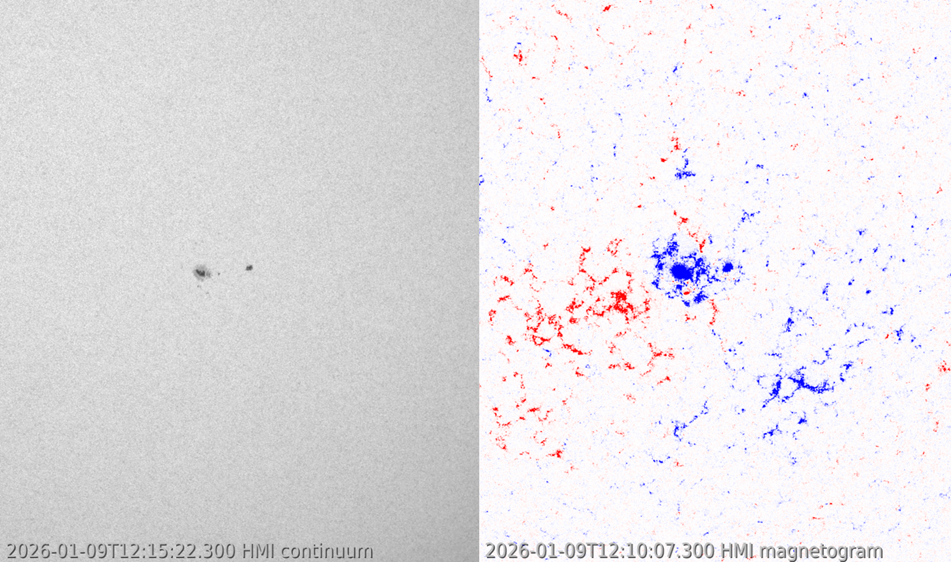
NOAA 4334 (SIDC sunspot group 722 - https://www.sidc.be/services/event-chains/sunspots ) was the return of the decaying active region NOAA 4307. It consisted of a rather big sunspot with some small spots surrounding it, all of the same negative magnetic polarity (blue or black in the magnetogram). The region became visible on 2 January, and showed the typical behaviour of a shrinking, decaying sunspot during the next few days. On 6 January, the spot started to fall apart, again a typical step in the evolution of a decaying spot. The next phase would have been that these smaller spots would decay and dissolve further locally, but then something unexpected happened: one of the spot fragments started to separate from the main portion of the sunspot, as a naughty kitten that is straying too far from the mother cat. This can be seen in the SDO/HMI imagery underneath, with on the left the white light image and on the right the magnetogram. By 8 January, the separation between the two was about 3 degrees and growing. From then onwards, most observers considered it as a bipolar sunspot region (McIntosh 1990 - https://doi.org/10.1007/BF00158405 ), with -in this case- both the leading and the trailing portion having the same magnetic polarity. This kind of configuration is rare, and has to do with the movement of the magnetic fields underlying the sunspot group.
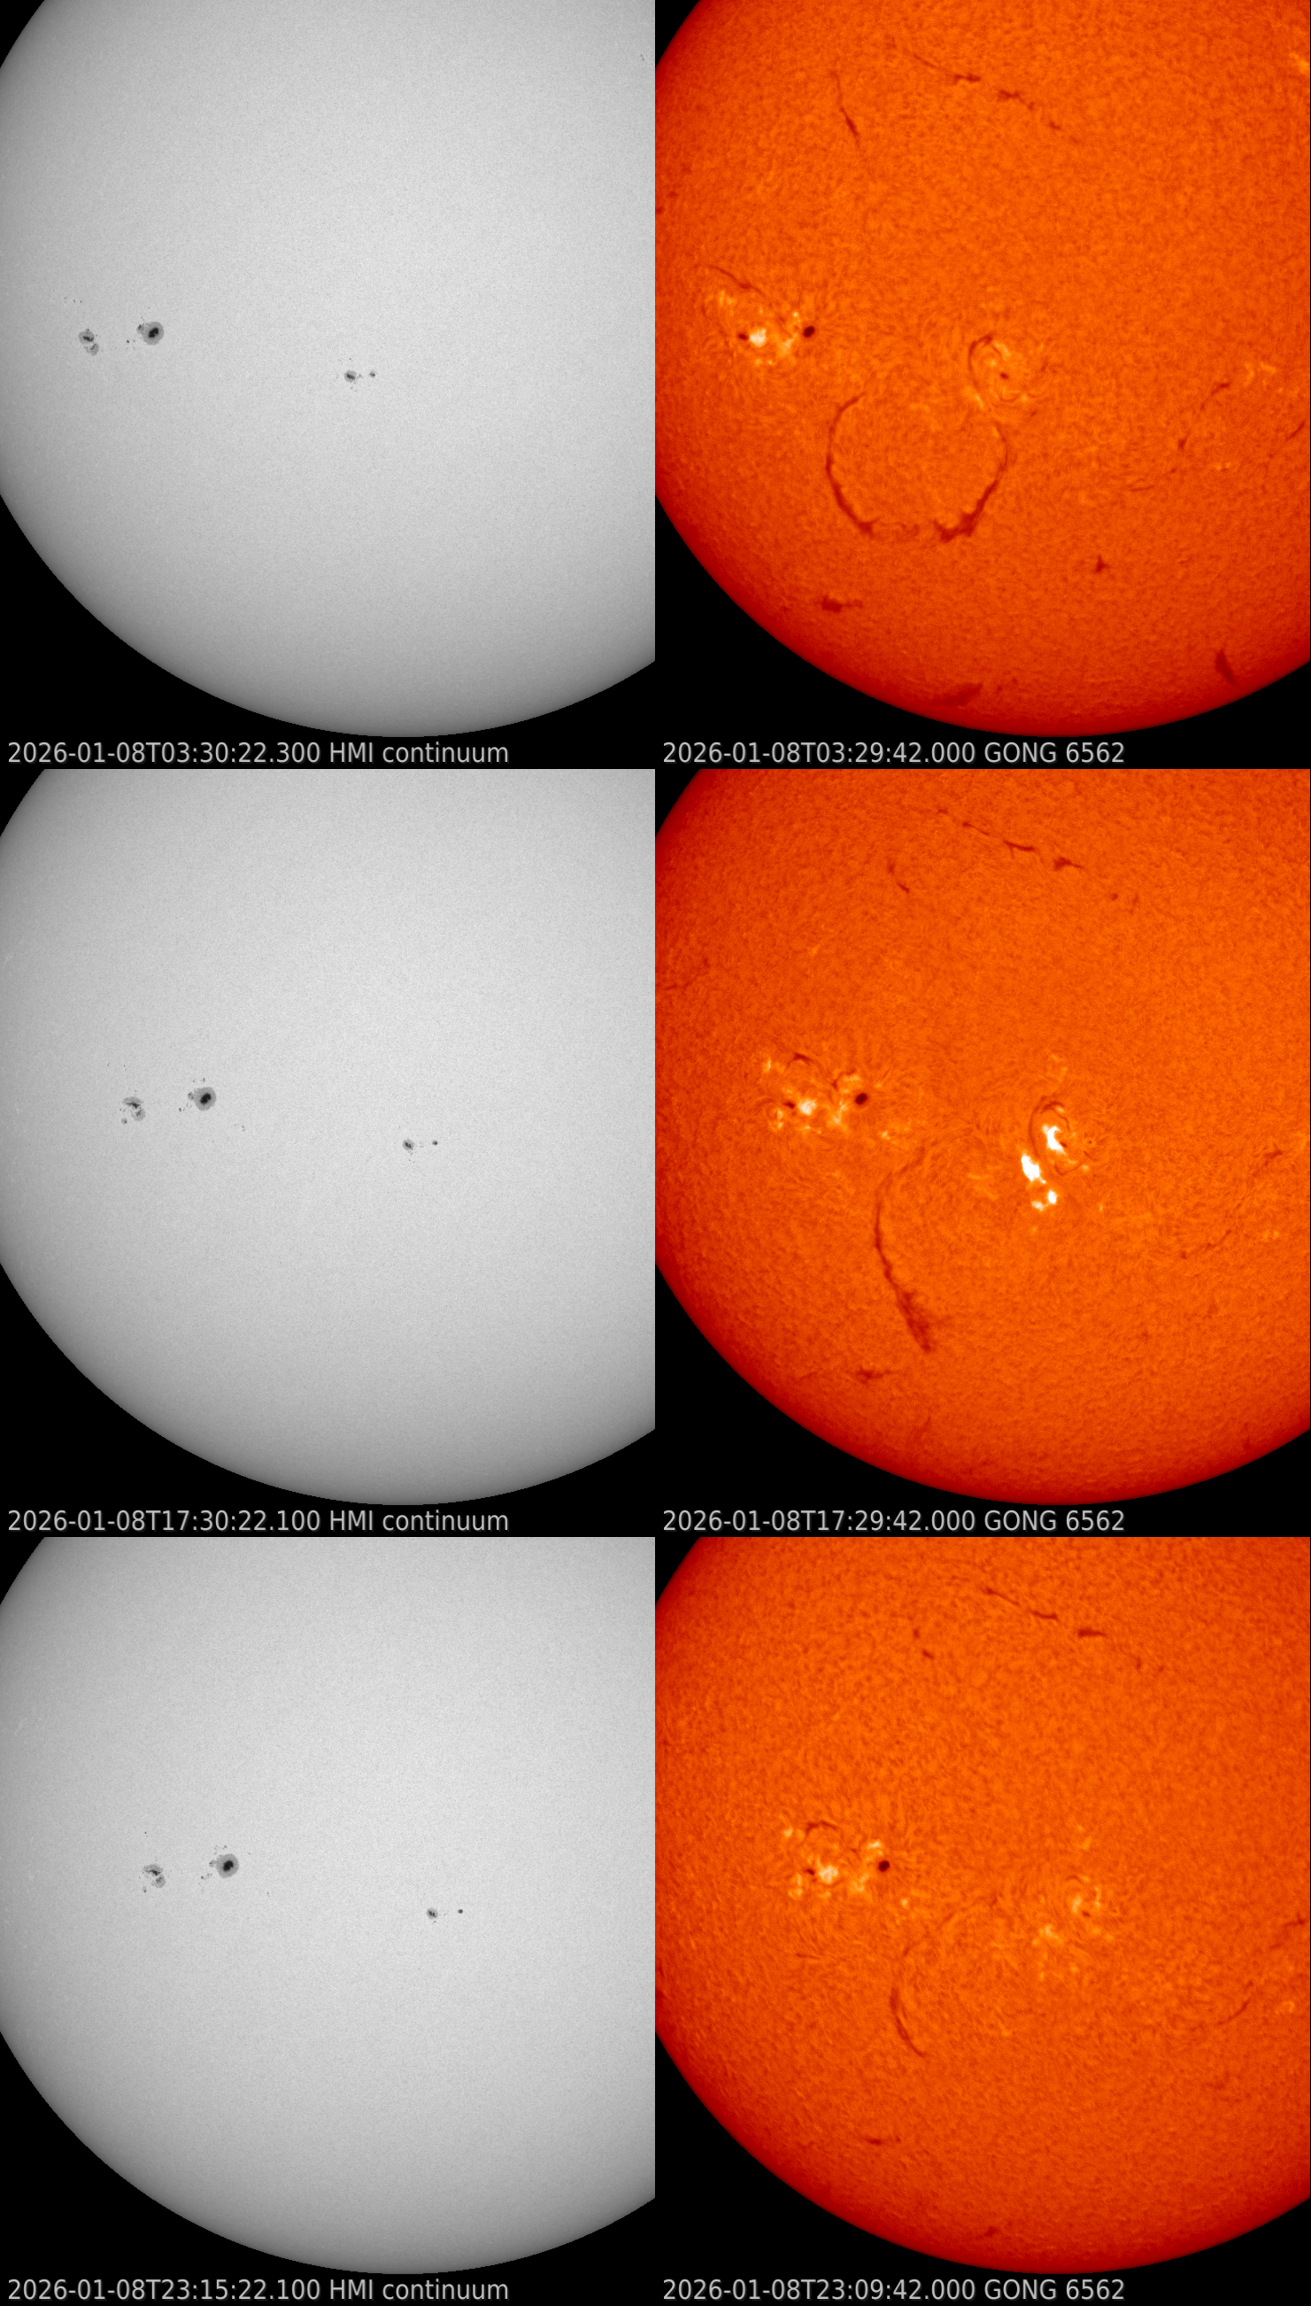
Despite its all-in-all simple magnetic structure, NOAA 4334 produced more than a dozen of small C-class flares. These were in part triggered by interaction with some nearby, weak, opposite polarity magnetic fields, as well as with nearby filaments. Solar filaments are clouds of ionized gas above the solar surface squeezed between magnetic regions of opposite polarity. Being cooler and denser than the plasma underneath and their surroundings, they appear as dark lines when seen on the solar disk using special filters such as hydrogen-alpha in the red portion of the solar spectrum. A particularly long and curvy filament (about 1.5 times the Earth-Moon distance!) was just south of NOAA 4334, with small extensions to the east and north of this active region. Such long filaments are known to become unstable and erupt, and indeed: the filament erupted on 8 January with an associated long-duration C5 flare. The filament and the eruption can be seen in the H-alpha imagery (GONG) underneath. An earth-directed coronal mass ejection was associated with this event, and would eventually be the source of a moderate geomagnetic storm late on 10 January.
Space movie of Proba-3
This is a movie of the Coronagraph Spacecraft recorded from the Occulter Spacecraft. Both spacecraft together make the Proba-3 satellite which provides images of total solar eclipses when they fly in perfect formation: https://stce.be/movies/orig-2512_031_AR_EN.mp4

In the movie you see the distance between the two spacecraft decreasing from 96.35027 meter to 29.96212 meter. You see also the blinking of the mires (at 0:03).
Both spacecraft approach each other autonomously, without human intervention. Proba-3 did this by itself.
Amazing or amazing?
You see also the door of the ASPIICS instrument indicated with the red circle in the image. ASPIICS makes total solar eclipse images. The ASPIICS door is closed at the time of recording.
Read more on: https://www.esa.int/ESA_Multimedia/Videos/2025/12/A_first_in_space_autonomy
Eruptosaurus Solaris
On March 15, 2025, the Full Sun Imager of the EUI instrument onboard of the satellite Solar Orbiter captured a peculiar event.
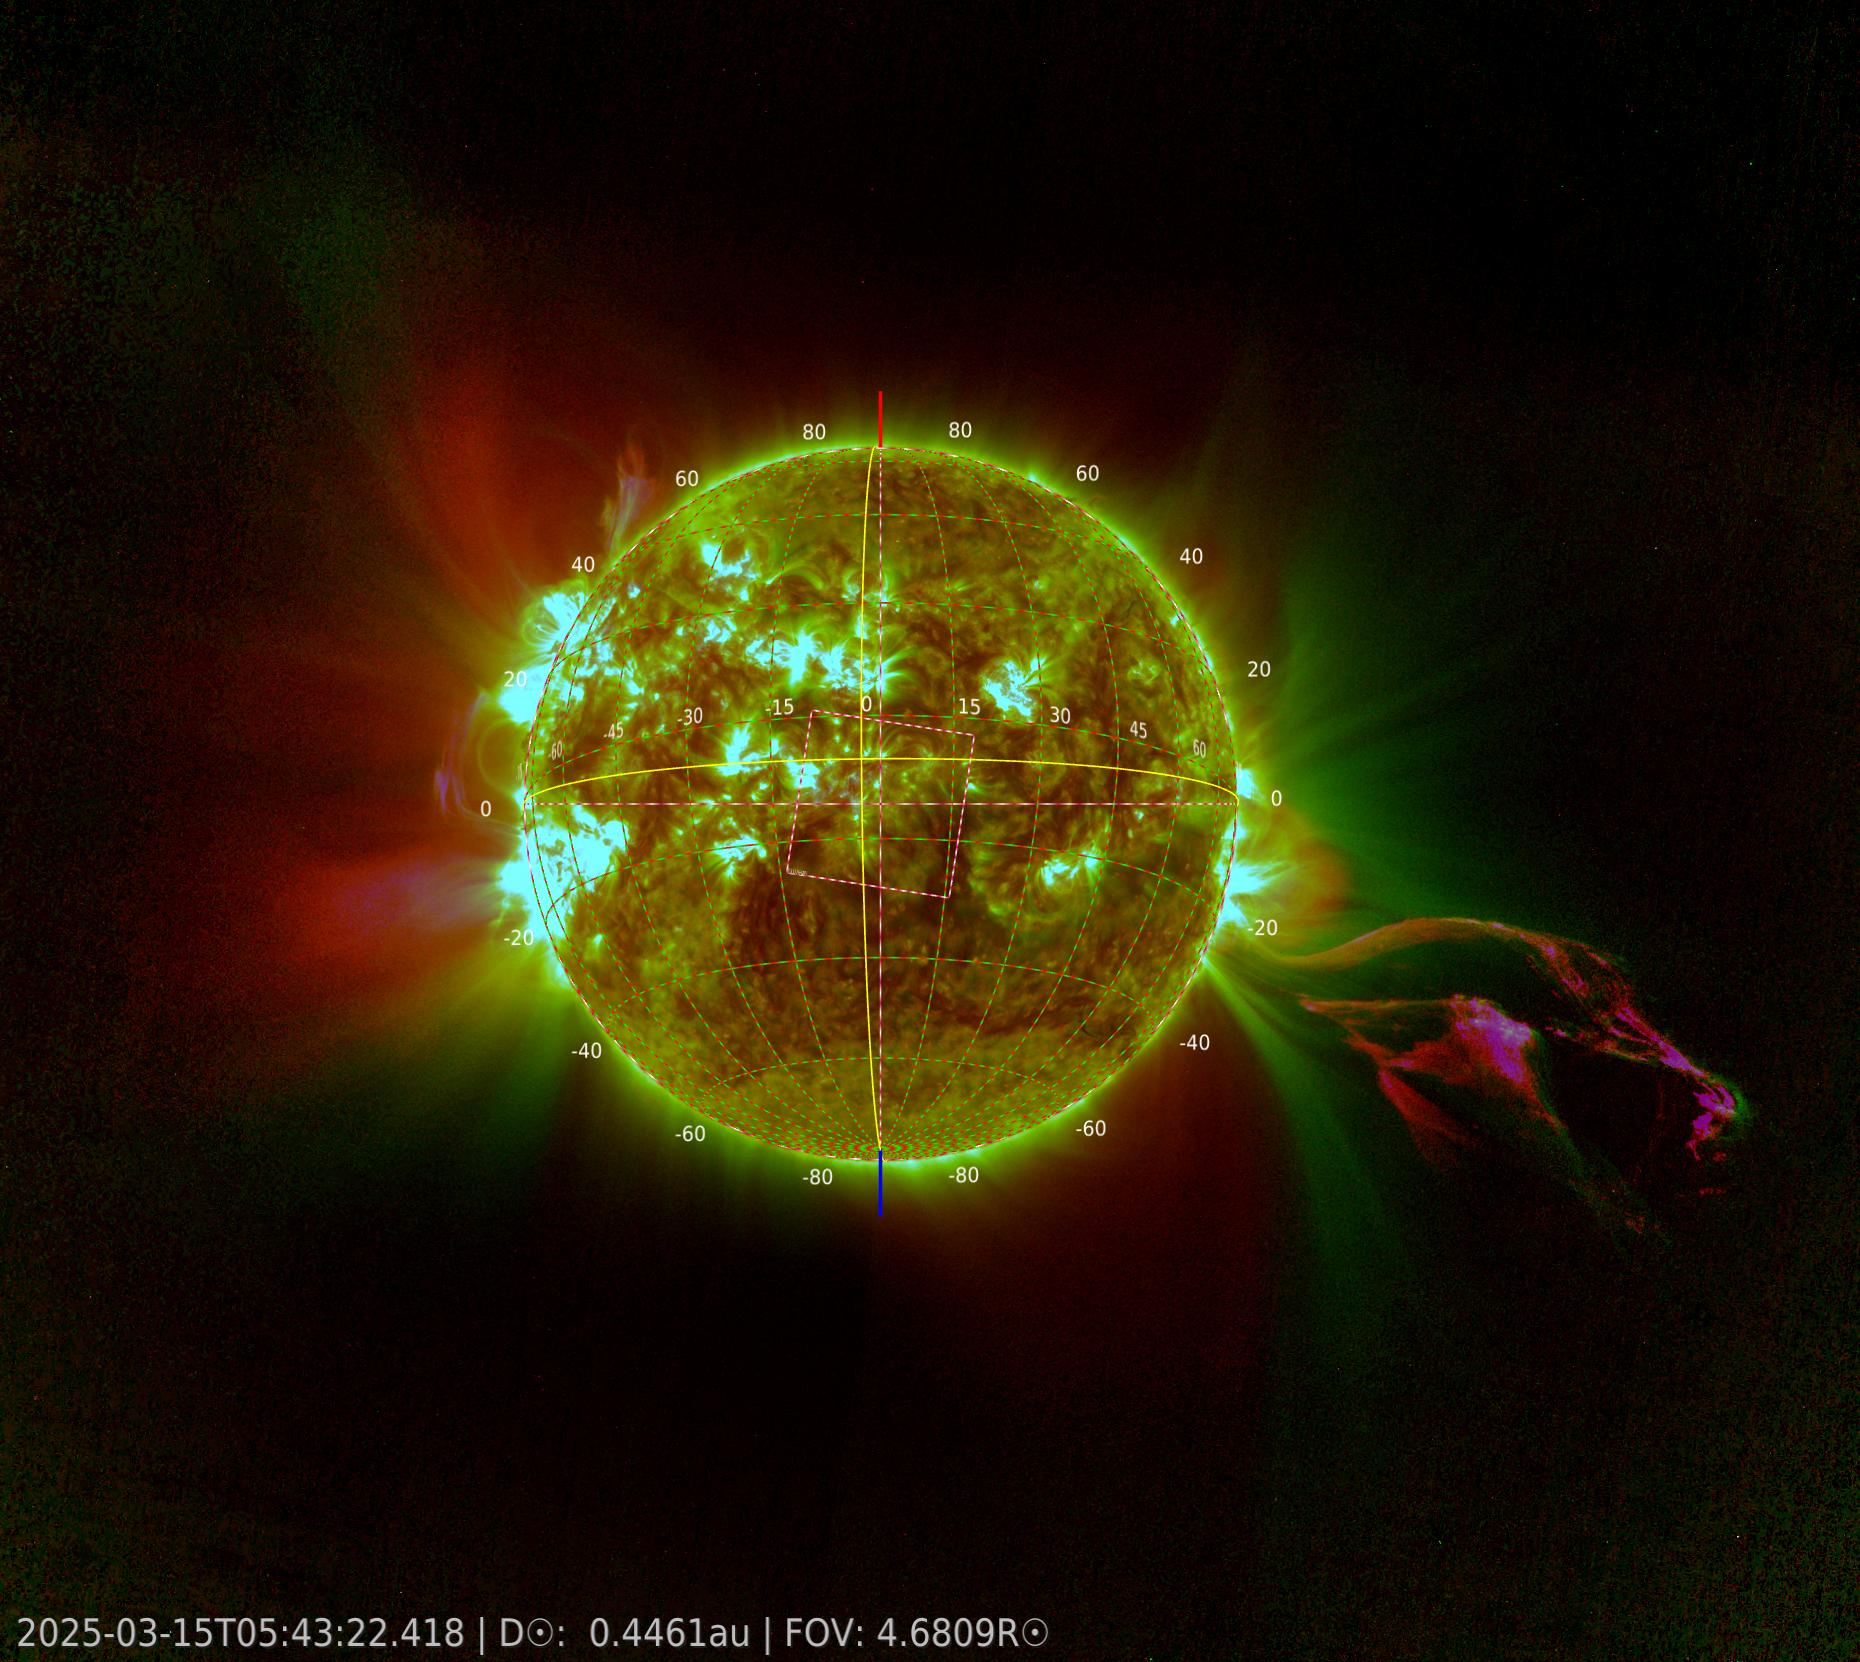
The image above is an overlay of two color channels: 304 and 174 Ångström. If you look very carefully, it reveals an extra-ordinary Eruptosaurus Solaris.
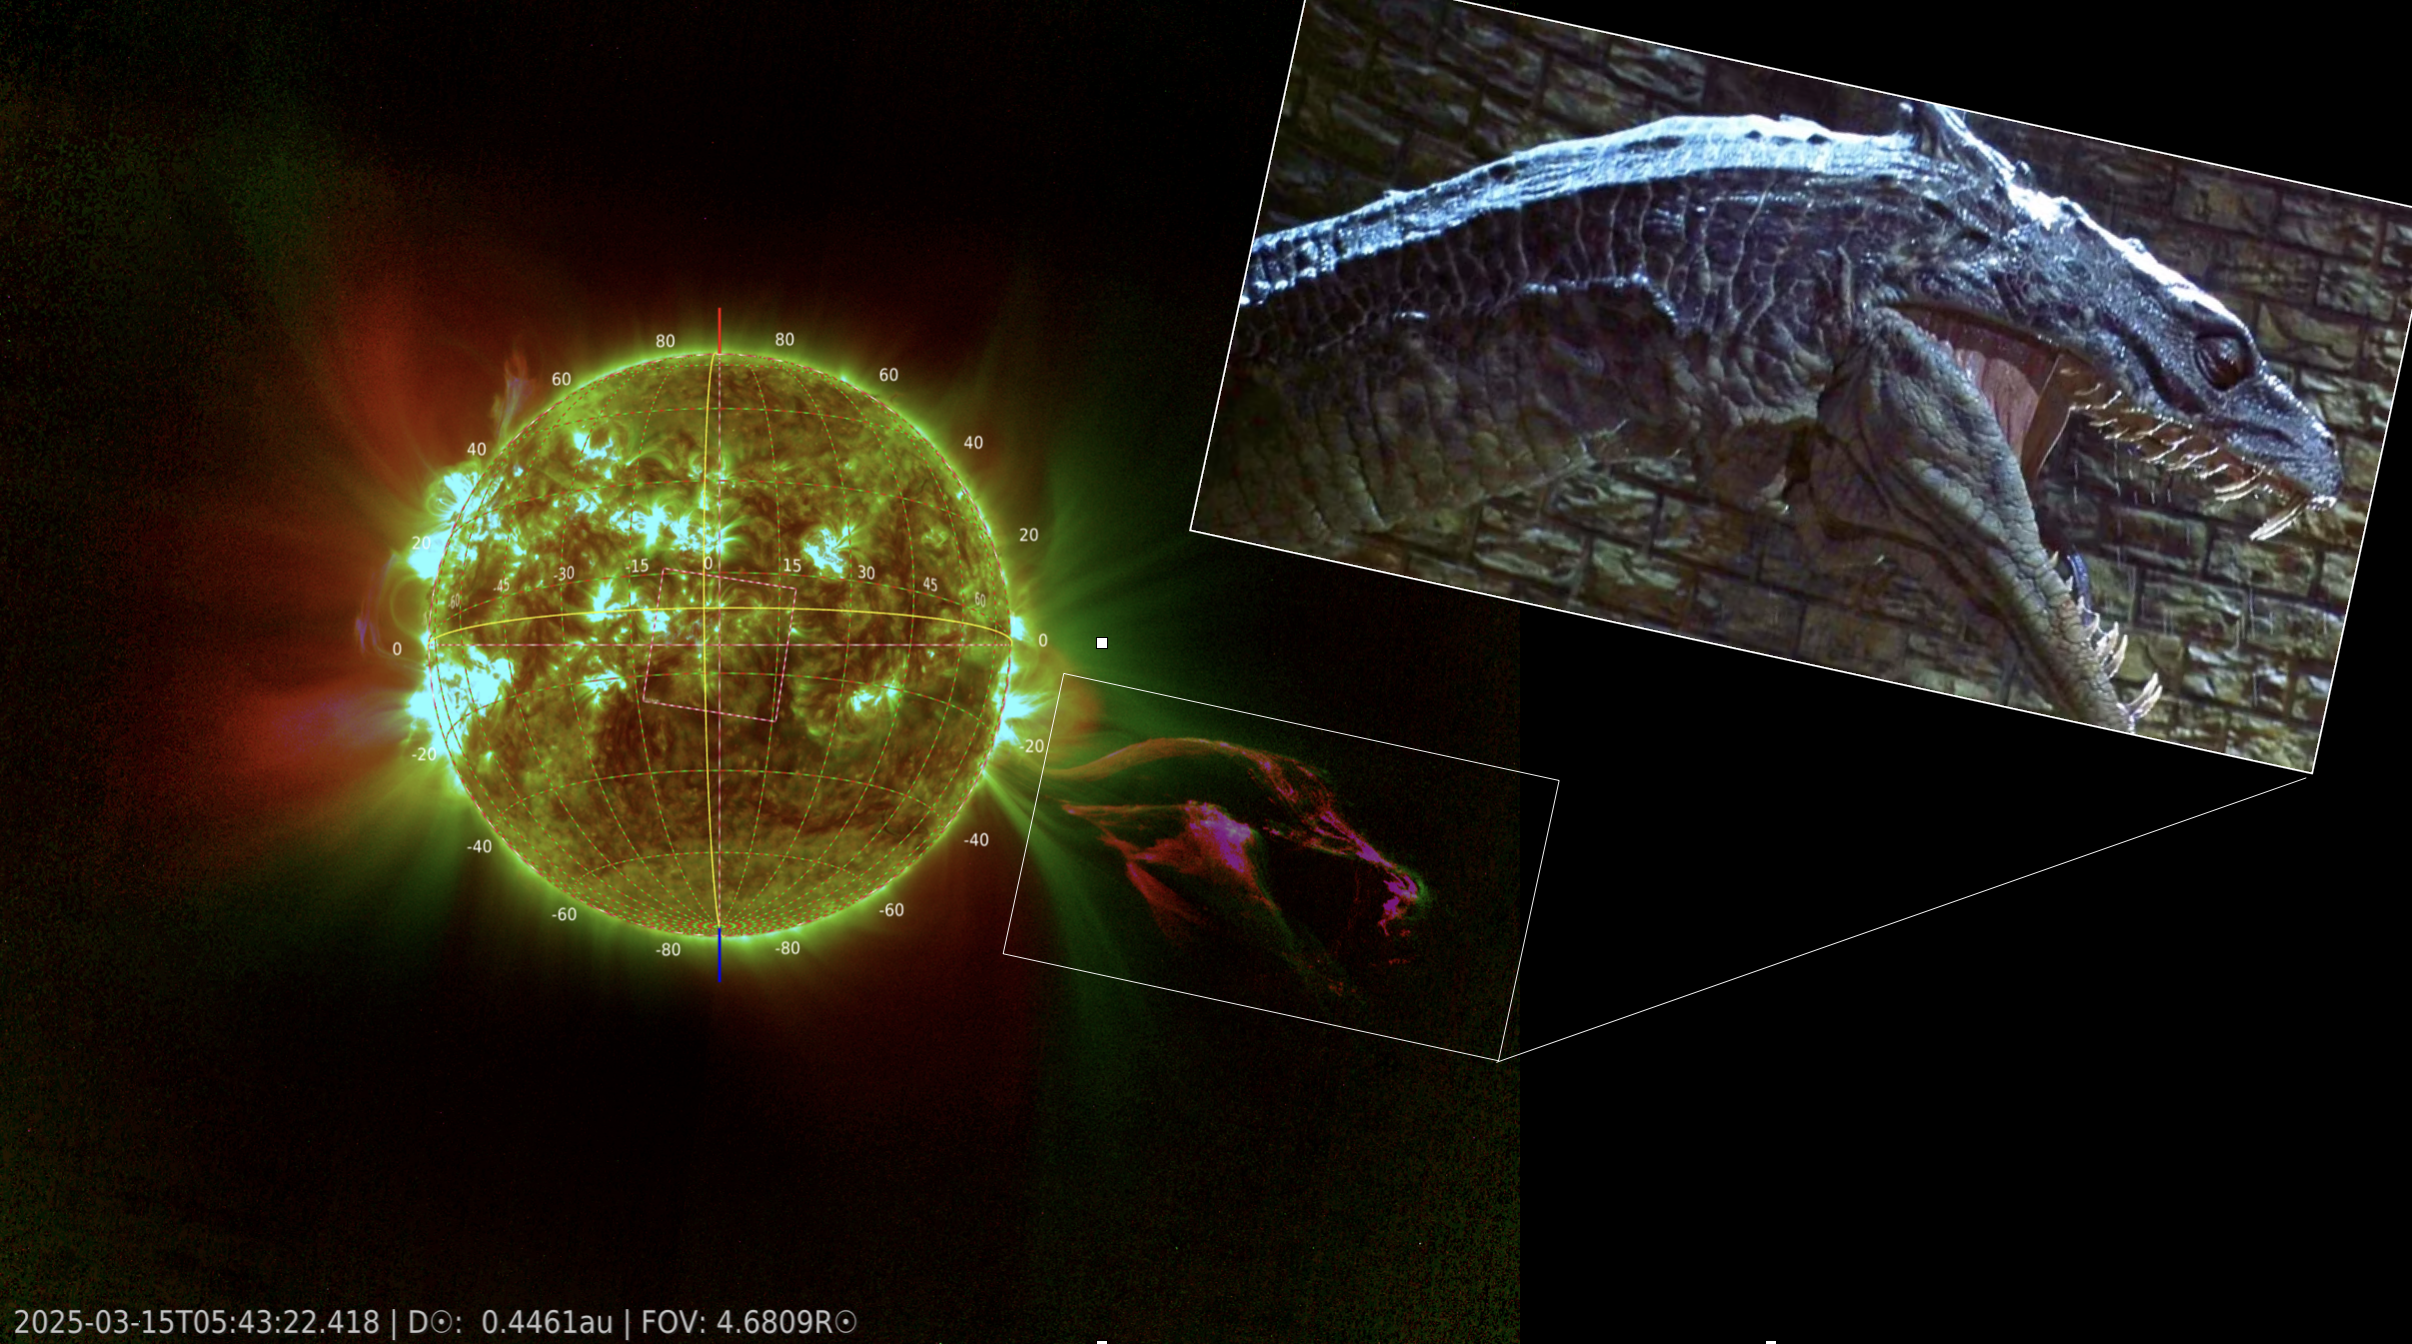
Disclaimer: this image originates from the imagination of an STCE researcher. There are no dinosaurs in space.
Enjoy the image!
Review of space weather
Solar Active Regions (ARs) and flares
Solar flaring activity was low but became moderate towards the end of the week. Fifty-one (51) C-class flares and one (1) M-class flare were recorded. The largest flare was an M3.3 flare (SIDC Flare 6631), peaking at 23:14 UTC on January 11, associated with an active region located behind the east limb. The second-largest flare was a C7.4 (SIDC Flare 6599), peaking at 06:12 UTC on January 7, produced by SIDC Sunspot Group 722 (NOAA AR 4334).
Thirteen (13) SIDC Sunspot Groups were observed on the visible solar disc. At the beginning of the week, multiple active regions were approaching the west limb, including SIDC Sunspot Groups 709 (NOAA AR 4323), 744 (NOAA AR 4324), and 745 (NOAA AR 4325). By the end of the week, only four active regions remained. The most complex and active regions were SIDC Sunspot Group 722 (NOAA AR 4334) and SIDC Sunspot Group 754 (NOAA AR 4336), both contributed significantly to the flaring activity.
Coronal mass ejections
Several Coronal Mass Ejections (CMEs) were detected in SOHO/LASCO-C2 imagery over the past week. Of these, three were determined to potentially impact Earth.
A faint CME (SIDC CME 619) was first observed at 02:12 UTC on January 6, directed toward the southeast from Earth's perspective. It was likely associated with a C2.1 flare peaking at 00:21 UTC, produced by SIDC Sunspot Group 722 (NOAA Active Region 4334), and accompanied by a small coronal dimming. While the bulk of the ejecta was expected to miss Earth, a glancing blow was anticipated early on January 9.
A second faint CME (SIDC CME 620) was observed at 06:24 UTC on January 8, also directed southeast. It was likely associated with a C4.4 flare (SIDC Flare 6611) peaking at 05:42 UTC, again produced by SIDC SG 722, and accompanied by a small coronal dimming. A glancing blow was predicted for late January 10.
Later that day, a partial halo CME (SIDC CME 622) was observed from 17:00 UTC. It was directed primarily southeast and associated with a filament eruption and a C5.6 flare (SIDC Flare 6614) peaking at 17:30 UTC, produced by SIDC SG 722. This CME was expected to have an Earth-directed component, with a predicted arrival between late January 10 and early January 11.
In addition, a halo CME (SIDC CME 621) was observed in SOHO/LASCO-C2 imagery at 10:36 UTC on January 8. The CME was directed primarily toward the southeast and was likely associated with an eruption on the far side of the Sun. Therefore, no impact on near-Earth solar wind conditions was expected.
Coronal Holes
A large negative polarity transequatorial coronal hole (SIDC Coronal Hole 144) began to cross the central meridian on January 5. A small negative polarity coronal hole in the southern hemisphere (SIDC Coronal Hole 145) crossed the central meridian on January 7. A small equatorial negative polarity coronal hole (SIDC Coronal Hole 136) began its central meridian passage on January 10.
Proton flux levels
The greater than 10 MeV proton flux, as measured by the GOES-18 satellite, remained at the background.
Electron fluxes at GEO
The greater than 2 MeV electron flux, as measured by GOES-18 and GOES-19, remained mostly below the 1000 pfu alert threshold. Brief exceedances occurred on Jan 6, 7 and Jan 10th, with a peak around 2500 pfu. The 24-hour electron fluence was normal to moderate.
Solar wind
Solar wind parameters at the beginning of the week reflected the waning influence of an interplanetary coronal mass ejection (ICME), likely associated with SIDC CME 618, which lifted off around 18:00 UTC on January 1. Between January 5 and 7, the solar wind speed gradually decreased from approximately 470 km/s to 350 km/s, while the interplanetary magnetic field decreased from around 10 nT to 6 nT.
From January 8 onward, solar wind conditions became slightly disturbed, likely due to the combined influence of an ICME associated with SIDC CME 619 (launched at around 02:00 UTC on January 6) and the arrival of a high-speed stream (HSS) from the negative polarity coronal holes SIDC CH 144 and CH 145. During this period, the solar wind speed increased from 320 km/s to approximately 560 km/s. The interplanetary magnetic field peaked at 14 nT, and the southward component (Bz) reached -10 nT.
On January 10 at 19:36 UTC, a fast forward shock was detected in the solar wind data (ACE and DSCOVR), marking the arrival of another ICME, likely associated with the CMEs that lifted off the solar surface on January 8 (SIDC CME 620 and SIDC CME 622). The interplanetary magnetic field jumped from 6 nT to 16 nT, briefly reaching up to 20 nT, while the solar wind speed jumped from about 475 km/s to 580 km/s. The Bz component reached a minimum of -20 nT.
Geomagnetism
Geomagnetic conditions became active globally (NOAA Kp = 4, 4+) between 03:00 and 09:00 UTC on January 5, following the arrival of an interplanetary coronal mass ejection (ICME) likely associated with the CME that lifted off the solar surface around 18:00 UTC on January 1 (SIDC CME 618). Over Belgium, the geomagnetic conditions remained quiet to unsettled (K-Bel = 1 to 3).
Geomagnetic activity remained mostly quiet to unsettled until January 8. On that day, global geomagnetic conditions again reached active levels (NOAA Kp = 4+, 4- ) between 00:00-03:00 UTC and 06:00-09:00 UTC, with locally active conditions observed over Belgium (K-Bel = 4) between 00:00-03:00 UTC. This was likely due to the passage of a solar wind structure with an unclear source.
On January 9, geomagnetic conditions once again reached active levels globally (NOAA Kp = 4- ) between 00:00 and 03:00 UTC, while remaining quiet to unsettled over Belgium (K-Bel = 1 to 3). This was probably due to the combined influence of an ICME associated with SIDC CME 619 (launched around 02:00 UTC on January 6) and a high-speed stream (HSS) from negative polarity coronal holes (SIDC CH 144 and CH 145).
Later in the week, geomagnetic conditions peaked at moderate storm levels globally (NOAA Kp = 6, 6- ) and minor storm levels over Belgium (K-Bel = 5) between 18:00 and 00:00 UTC on January 10, following the arrival of an ICME associated with the CMEs that lifted off the solar surface on January 8 (SIDC CME 620 and SIDC CME 622).
PROBA2 Observations (5 Jan 2026 - 11 Jan 2026)
Solar Activity
Solar flare activity fluctuated from low to moderate during the week.
In order to view the activity of this week in more detail, we suggest to go to the following website from which all the daily (normal and difference) movies can be accessed: https://proba2.oma.be/ssa
This page also lists the recorded flaring events.
A weekly overview movie (SWAP week 824) can be found here: https://proba2.sidc.be/swap/data/mpg/movies/weekly_movies/weekly_movie_2026_01_05.mp4.
Details about some of this week's events can be found further below.
If any of the linked movies are unavailable they can be found in the P2SC movie repository here: https://proba2.oma.be/swap/data/mpg/movies/.
Sunday January 11


The largest and only M-flare of this week was an M3.3, and it was observed by LYRA (top panel) and SWAP (bottom panel). The flare peaked on 2026-Jan-11 at 23:14 UT and occurred just behind the eastern limb of the Sun, originating from an upcoming active region.
Find a SWAP movie of the event here: https://proba2.sidc.be/swap/movies/20260111_swap_movie.mp4.
International Sunspot Number by SILSO

The daily Estimated International Sunspot Number (EISN, red curve with shaded error) derived by a simplified method from real-time data from the worldwide SILSO network. It extends the official Sunspot Number from the full processing of the preceding month (green line), a few days more than one solar rotation. The horizontal blue line shows the current monthly average. The yellow dots give the number of stations that provided valid data. Valid data are used to calculate the EISN. The triangle gives the number of stations providing data. When a triangle and a yellow dot coincide, it means that all the data is used to calculate the EISN of that day.
Noticeable Solar Events
| DAY | BEGIN | MAX | END | LOC | XRAY | OP | 10CM | TYPE | Cat | NOAA |
| 11 | 2153 | 2314 | 0031 | M3.3 |
| LOC: approximate heliographic location | TYPE: radio burst type |
| XRAY: X-ray flare class | Cat: Catania sunspot group number |
| OP: optical flare class | NOAA: NOAA active region number |
| 10CM: peak 10 cm radio flux |
Geomagnetic Observations in Belgium

Local K-type magnetic activity index for Belgium based on data from Dourbes (DOU) and Manhay (MAB). Comparing the data from both measurement stations allows to reliably remove outliers from the magnetic data. At the same time the operational service availability is improved: whenever data from one observatory is not available, the single-station index obtained from the other can be used as a fallback system.
Both the two-station index and the single station indices are available here: http://ionosphere.meteo.be/geomagnetism/K_BEL/
The SIDC Space Weather Briefing
The forecaster on duty presented the SIDC briefing that gives an overview of space weather from January 5 to January 11, 2026.
The pdf of the presentation: https://www.stce.be/briefings/20260112_SWbriefing.pdf
Review of Ionospheric Activity


VTEC time series at 3 locations in Europe from 5 Jan 2026 till 11 Jan 2026
The top figure shows the time evolution of the Vertical Total Electron Content (VTEC) (in red) during the last week at three locations:
a) in the northern part of Europe(N 61deg E 5deg)
b) above Brussels(N 50.5deg, E 4.5 deg)
c) in the southern part of Europe(N 36 deg, E 5deg)
This top figure also shows (in grey) the normal ionospheric behaviour expected based on the median VTEC from the 15 previous days.
The time series below shows the VTEC difference (in green) and relative difference (in blue) with respect to the median of the last 15 days in the North, Mid (above Brussels) and South of Europe. It thus illustrates the VTEC deviation from normal quiet behaviour.
The VTEC is expressed in TECu (with TECu=10^16 electrons per square meter) and is directly related to the signal propagation delay due to the ionosphere (in figure: delay on GPS L1 frequency).
The Sun's radiation ionizes the Earth's upper atmosphere, the ionosphere, located from about 60km to 1000km above the Earth's surface.The ionization process in the ionosphere produces ions and free electrons. These electrons perturb the propagation of the GNSS (Global Navigation Satellite System) signals by inducing a so-called ionospheric delay.
See http://stce.be/newsletter/GNSS_final.pdf for some more explanations; for more information, see https://gnss.be/SpaceWeather
Upcoming activities
Courses, seminars, presentations and events with the Sun-Space-Earth system and Space Weather as the main theme. We provide occasions to get submerged in our world through educational, informative and instructive activities.
* Feb 9-11, 2026, STCE Space Weather Introductory Course, Brussels, Belgium - register: https://events.spacepole.be/event/255/
* Mar 16-18, 2026, STCE course: Role of the ionosphere and space weather in military communications, Brussels, Belgium - register: https://events.spacepole.be/event/258/
* Apr 20-21, 2026, STCE cursus: inleiding tot het ruimteweer, Brussels, Belgium - register: https://events.spacepole.be/event/260/
* Mar 23, 2026, STCE lecture: From physics to forecasting, Space Weather course, ESA Academy, Redu, Belgium
* Jun 15-17, 2026, STCE Space Weather Introductory Course, Brussels, Belgium - register: https://events.spacepole.be/event/256/
* Oct 12-14, 2026, STCE Space Weather Introductory Course, Brussels, Belgium - register: https://events.spacepole.be/event/257/
* Nov 23-25, 2026, STCE course: Role of the ionosphere and space weather in military communications, Brussels, Belgium - register: https://events.spacepole.be/event/259/
* Dec 7-9, 2026, STCE Space Weather Introductory Course for Aviation, Brussels, Belgium - register: https://events.spacepole.be/event/262/
To register for a course and check the seminar details, navigate to the STCE Space Weather Education Center: https://www.stce.be/SWEC
If you want your event in the STCE newsletter, contact us: stce_coordination at stce.be