- Table of Content
- 1.Stage fright
- 2.STCE at the Ne...
- 3.Review of Sola...
- 4.International ...
- 5.PROBA2 Observa...
- 6.Noticeable Sol...
- 7.Geomagnetic Ob...
- 8.The SIDC Space...
- 9.Upcoming Activ...
2. STCE at the Nerdland Science Festival
3. Review of Solar and Geomagnetic Activity
4. International Sunspot Number by SILSO
5. PROBA2 Observations
6. Noticeable Solar Events
7. Geomagnetic Observations in Belgium
8. The SIDC Space Weather Briefing
9. Upcoming Activities
Stage fright
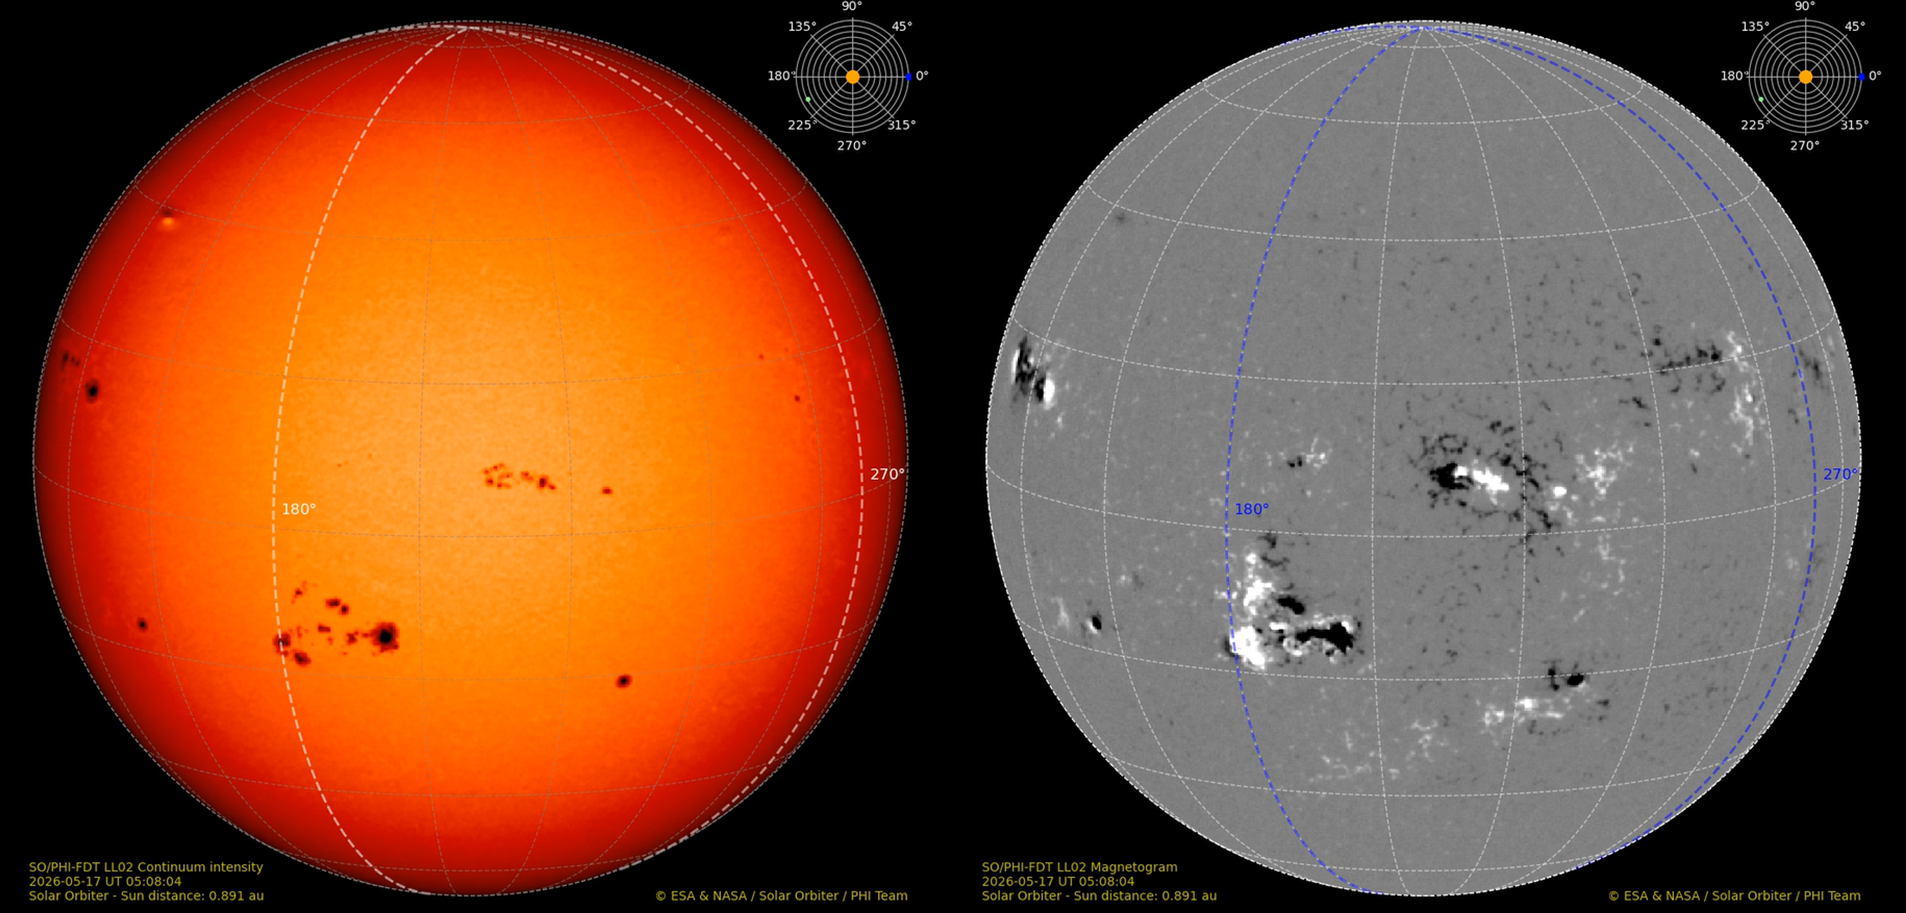
From 15 May onwards, space weather monitors noticed several coronal mass ejections that had their origin on the Sun's farside. The Polarimetric and Helioseismic Imager (PHI - https://www.mps.mpg.de/solar-physics/solar-orbiter-phi ) on board of Solar Orbiter quickly revealed the presence of a large and magnetically complex sunspot group. This region was located almost diametrically opposed to the Earth, near the 180° meridian (figure underneath). The 0° meridian (usually known as the "central meridian") is directly facing the Earth, while the 270° meridian denotes the east limb as seen from Earth. The figure underneath (PHI) shows the active region near the far side meridian on 17 May, in white light (left) and in a magnetogram (right). The latter shows a complex magnetic polarity, i.e. a "mixing" of positive (white) and negative (black), in particular in the leading and middle portions of the active region. It also hints at 2 or maybe 3 active regions close together. The inset in both images provides the location of Solar Orbiter (the green dot) and the Earth (the blue dot) with respect to the Sun (orange dot).
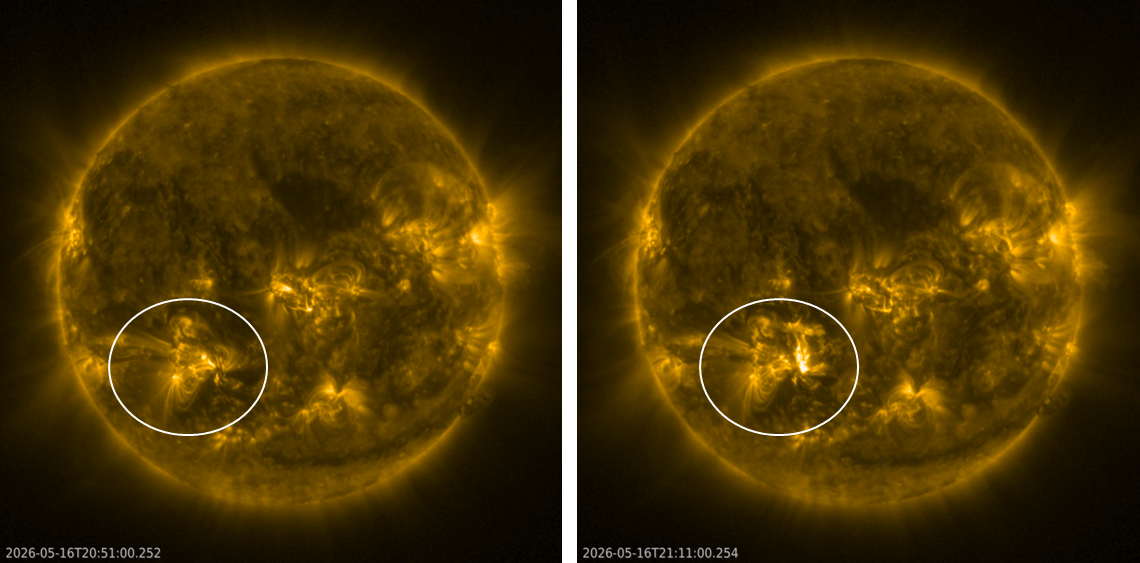
Another instrument on board Solar Orbiter, the Spectrometer and Telescope for Imaging X-rays (STIX - https://datacenter.stix.i4ds.net/view/flares/list ), revealed that the Sun was indeed very flare productive between 15 and 17 May. STIX provides a proxy for the intensity of solar flares as normally measured by GOES in soft x-rays, but deduced from observations in hard x-rays. More information is in this STCE newsitem at https://www.stce.be/news/712/welcome.html As it turns out, in just 3 days, more than a dozen of M-class and 3 X-class flares were produced by this active region. The X-class flares took place on 15 May (X1.5), and on 16 May (X1.2 and X1.6). As these are proxies, the true intensity was most likely between M7 and X3 for each of the three flares. Solar Orbiter's Full Sun Imager (FSI), which is part of the EUI instrument (Extreme Ultraviolet Imager - https://www.sidc.be/EUI/intro) revealed that the source of these "eXtreme" flares was indeed that large sunspot group. The images underneath show the Sun in extreme ultraviolet (EUV) at a wavelength of 17.4 nm (around 1 million degrees) just before (left) and near the maximum of the strongest X-class flare on 16 May.
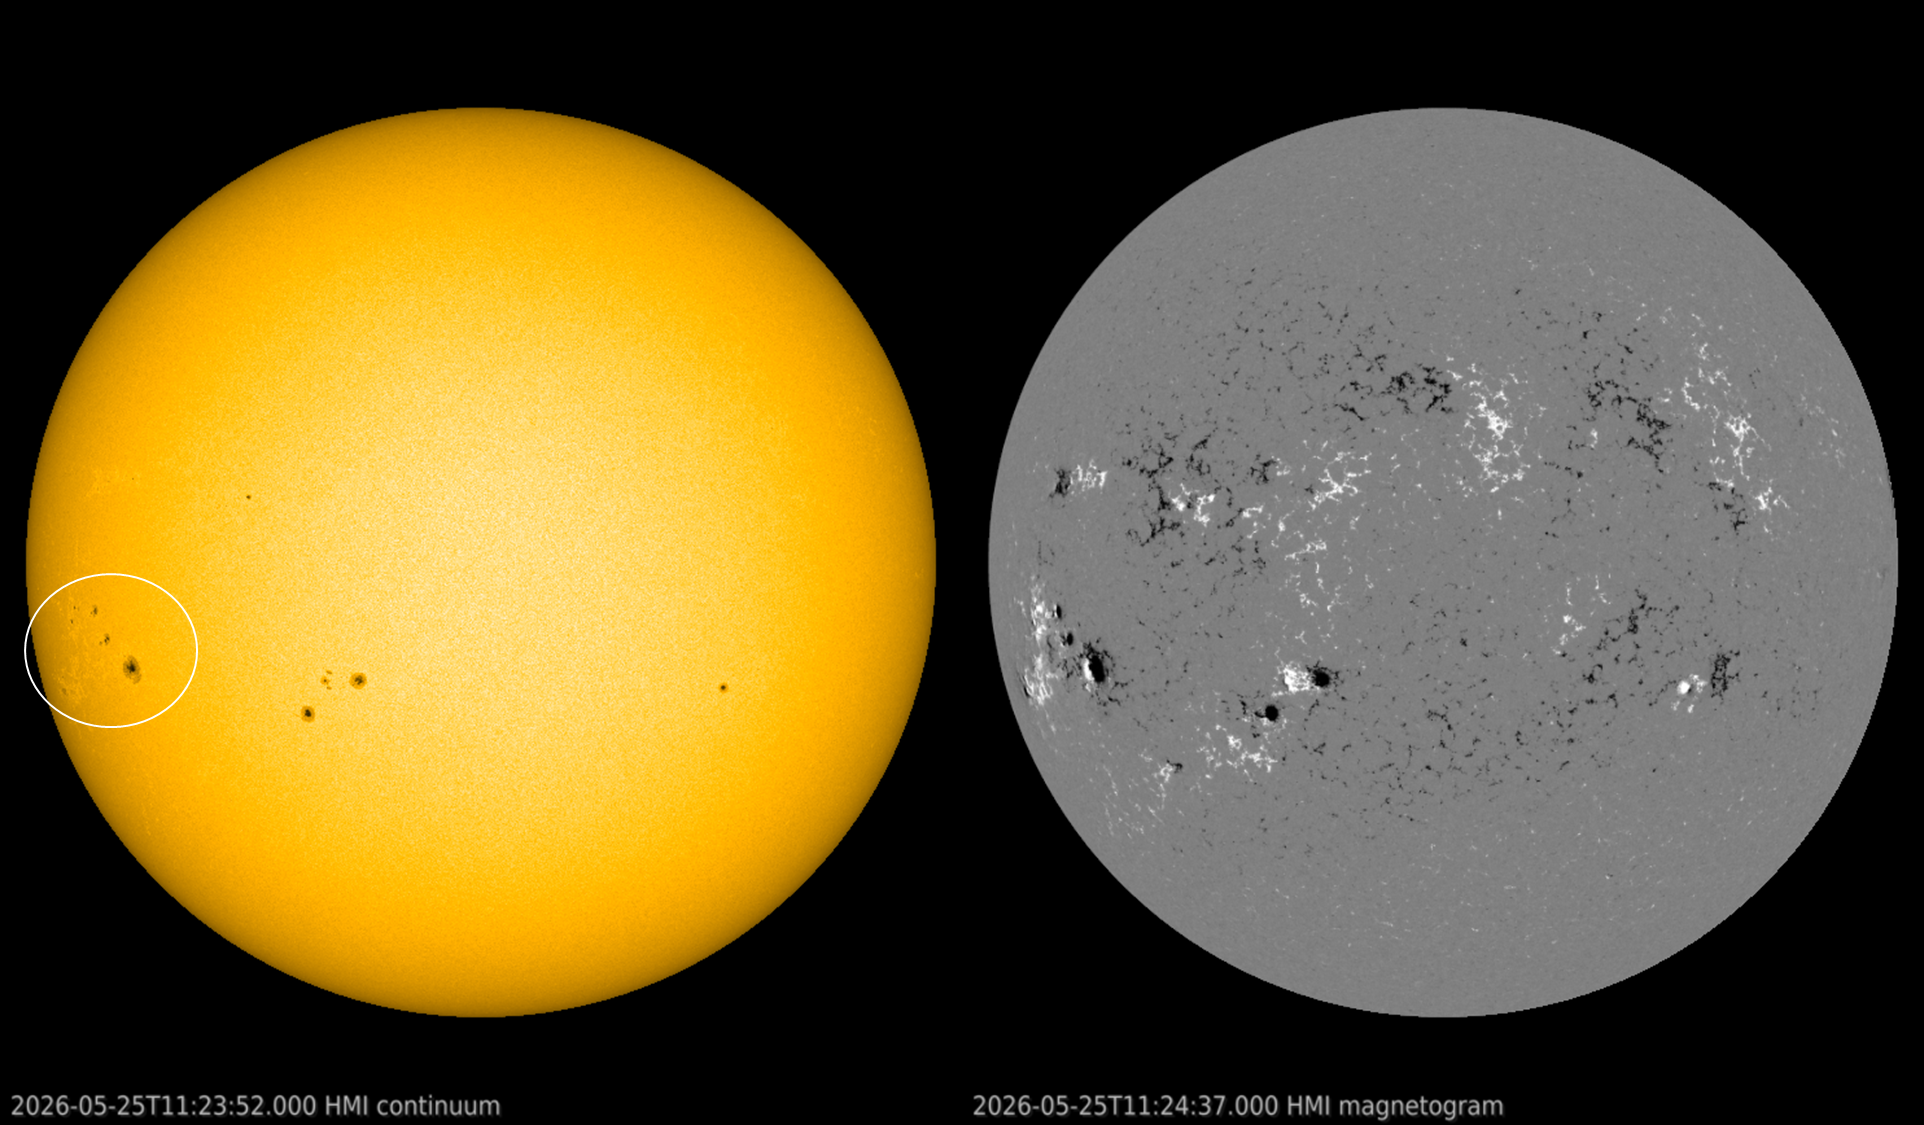
As the region was only a week behind the east limb, anticipation was high that it would still be actively flaring when rotating over the east limb and finally facing its earthly audience. Alas, when it did late on 22 May, it quickly became clear that the entire sunspot structure had shrunk in size, and that its magnetic complexity had mostly defused. No M-class flares have been observed during its transition over the earth-facing solar hemisphere so far. The region has also been split in 3 to 4 smaller sunspot groups, the largest of which is NOAA 4446 (SIDC Sunspot group 873 - https://www.sidc.be/services/event-chains/sunspots ). The SDO/HMI images (https://sdo.gsfc.nasa.gov/data/aiahmi/ ) show the active region in white light (left; annotated) and its corresponding magnetogram (right) on 25 May. Barring the emergence of some new magnetic flux, no further active M- and X-class flaring from this sunspot group is expected.
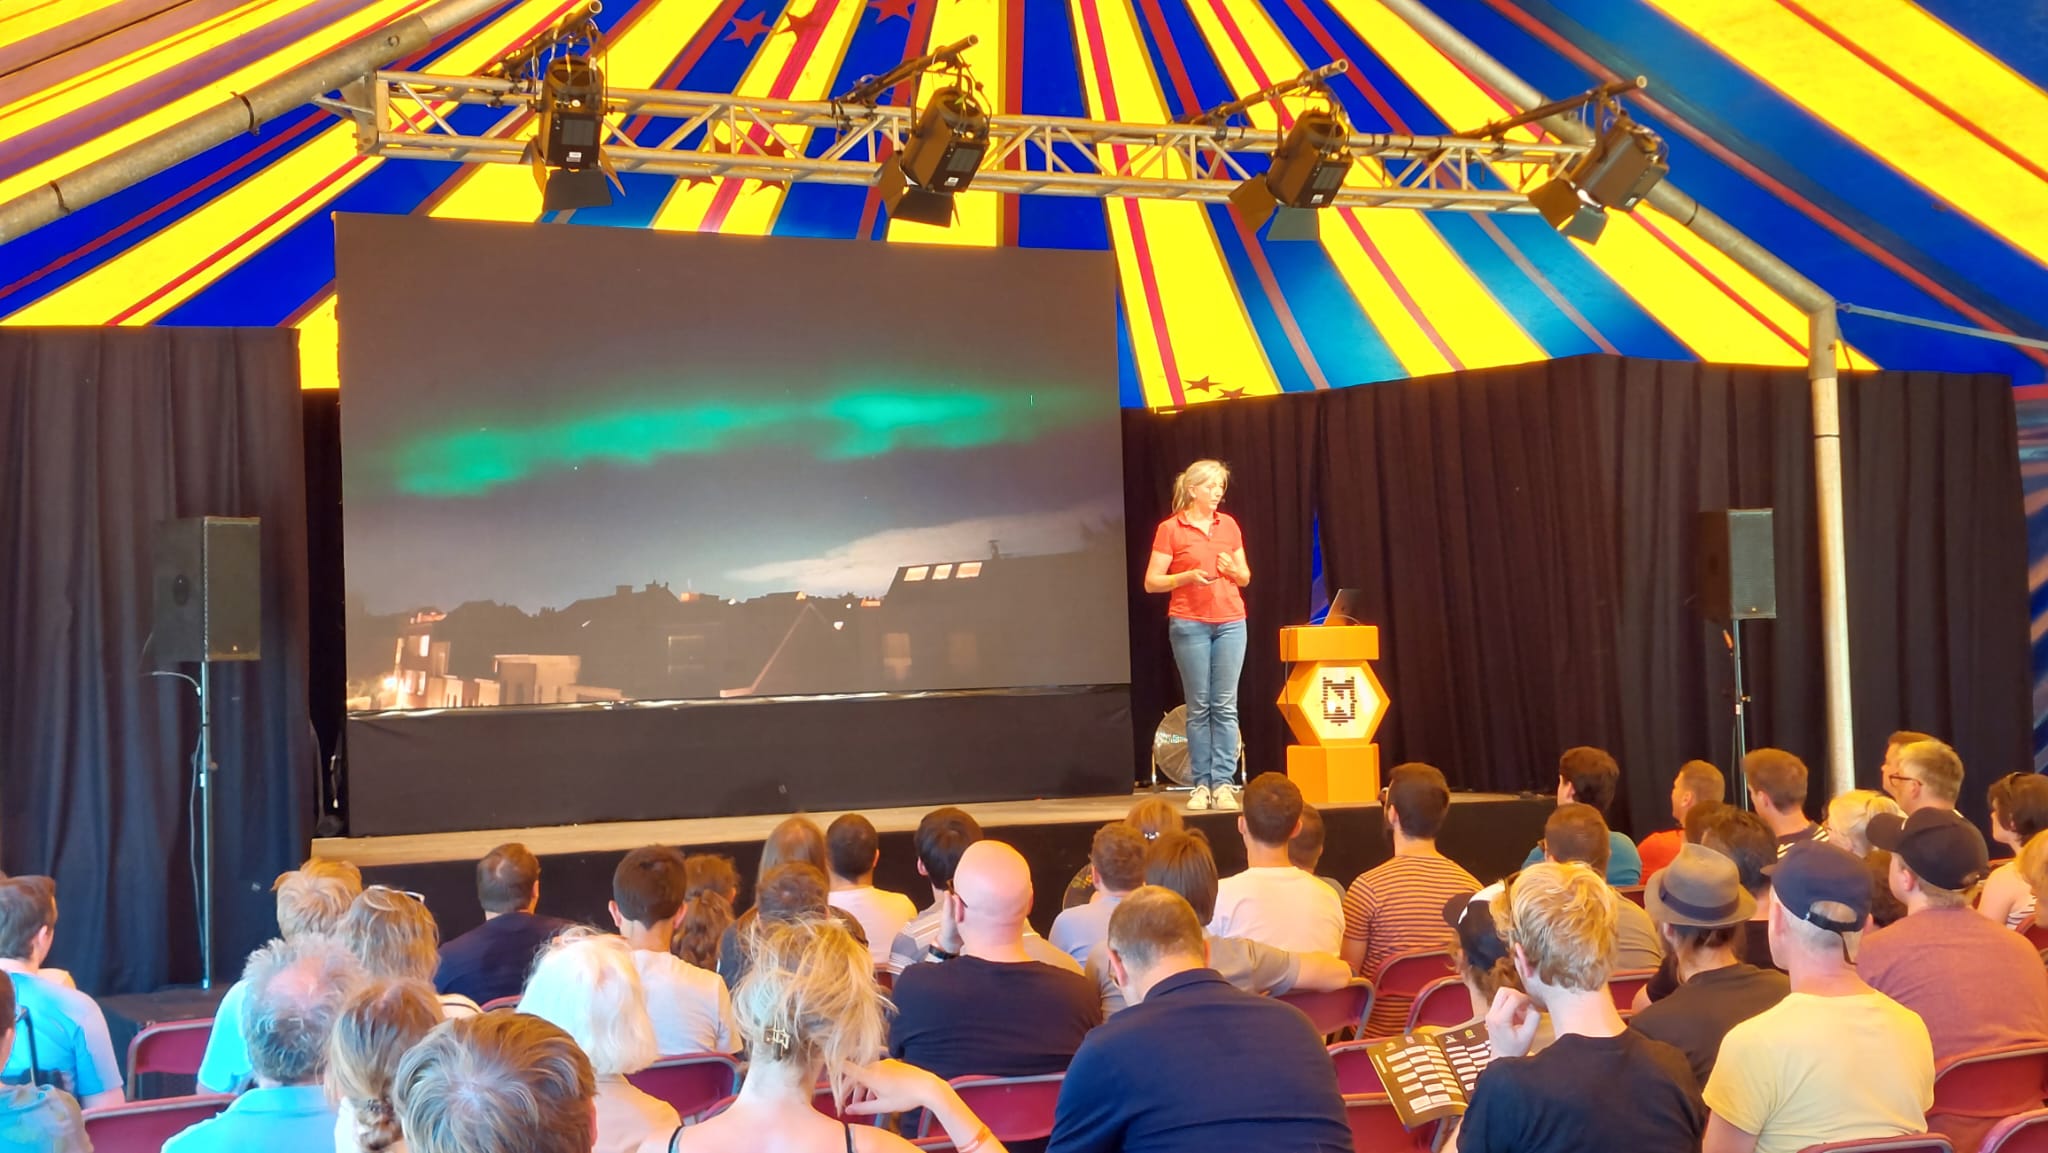
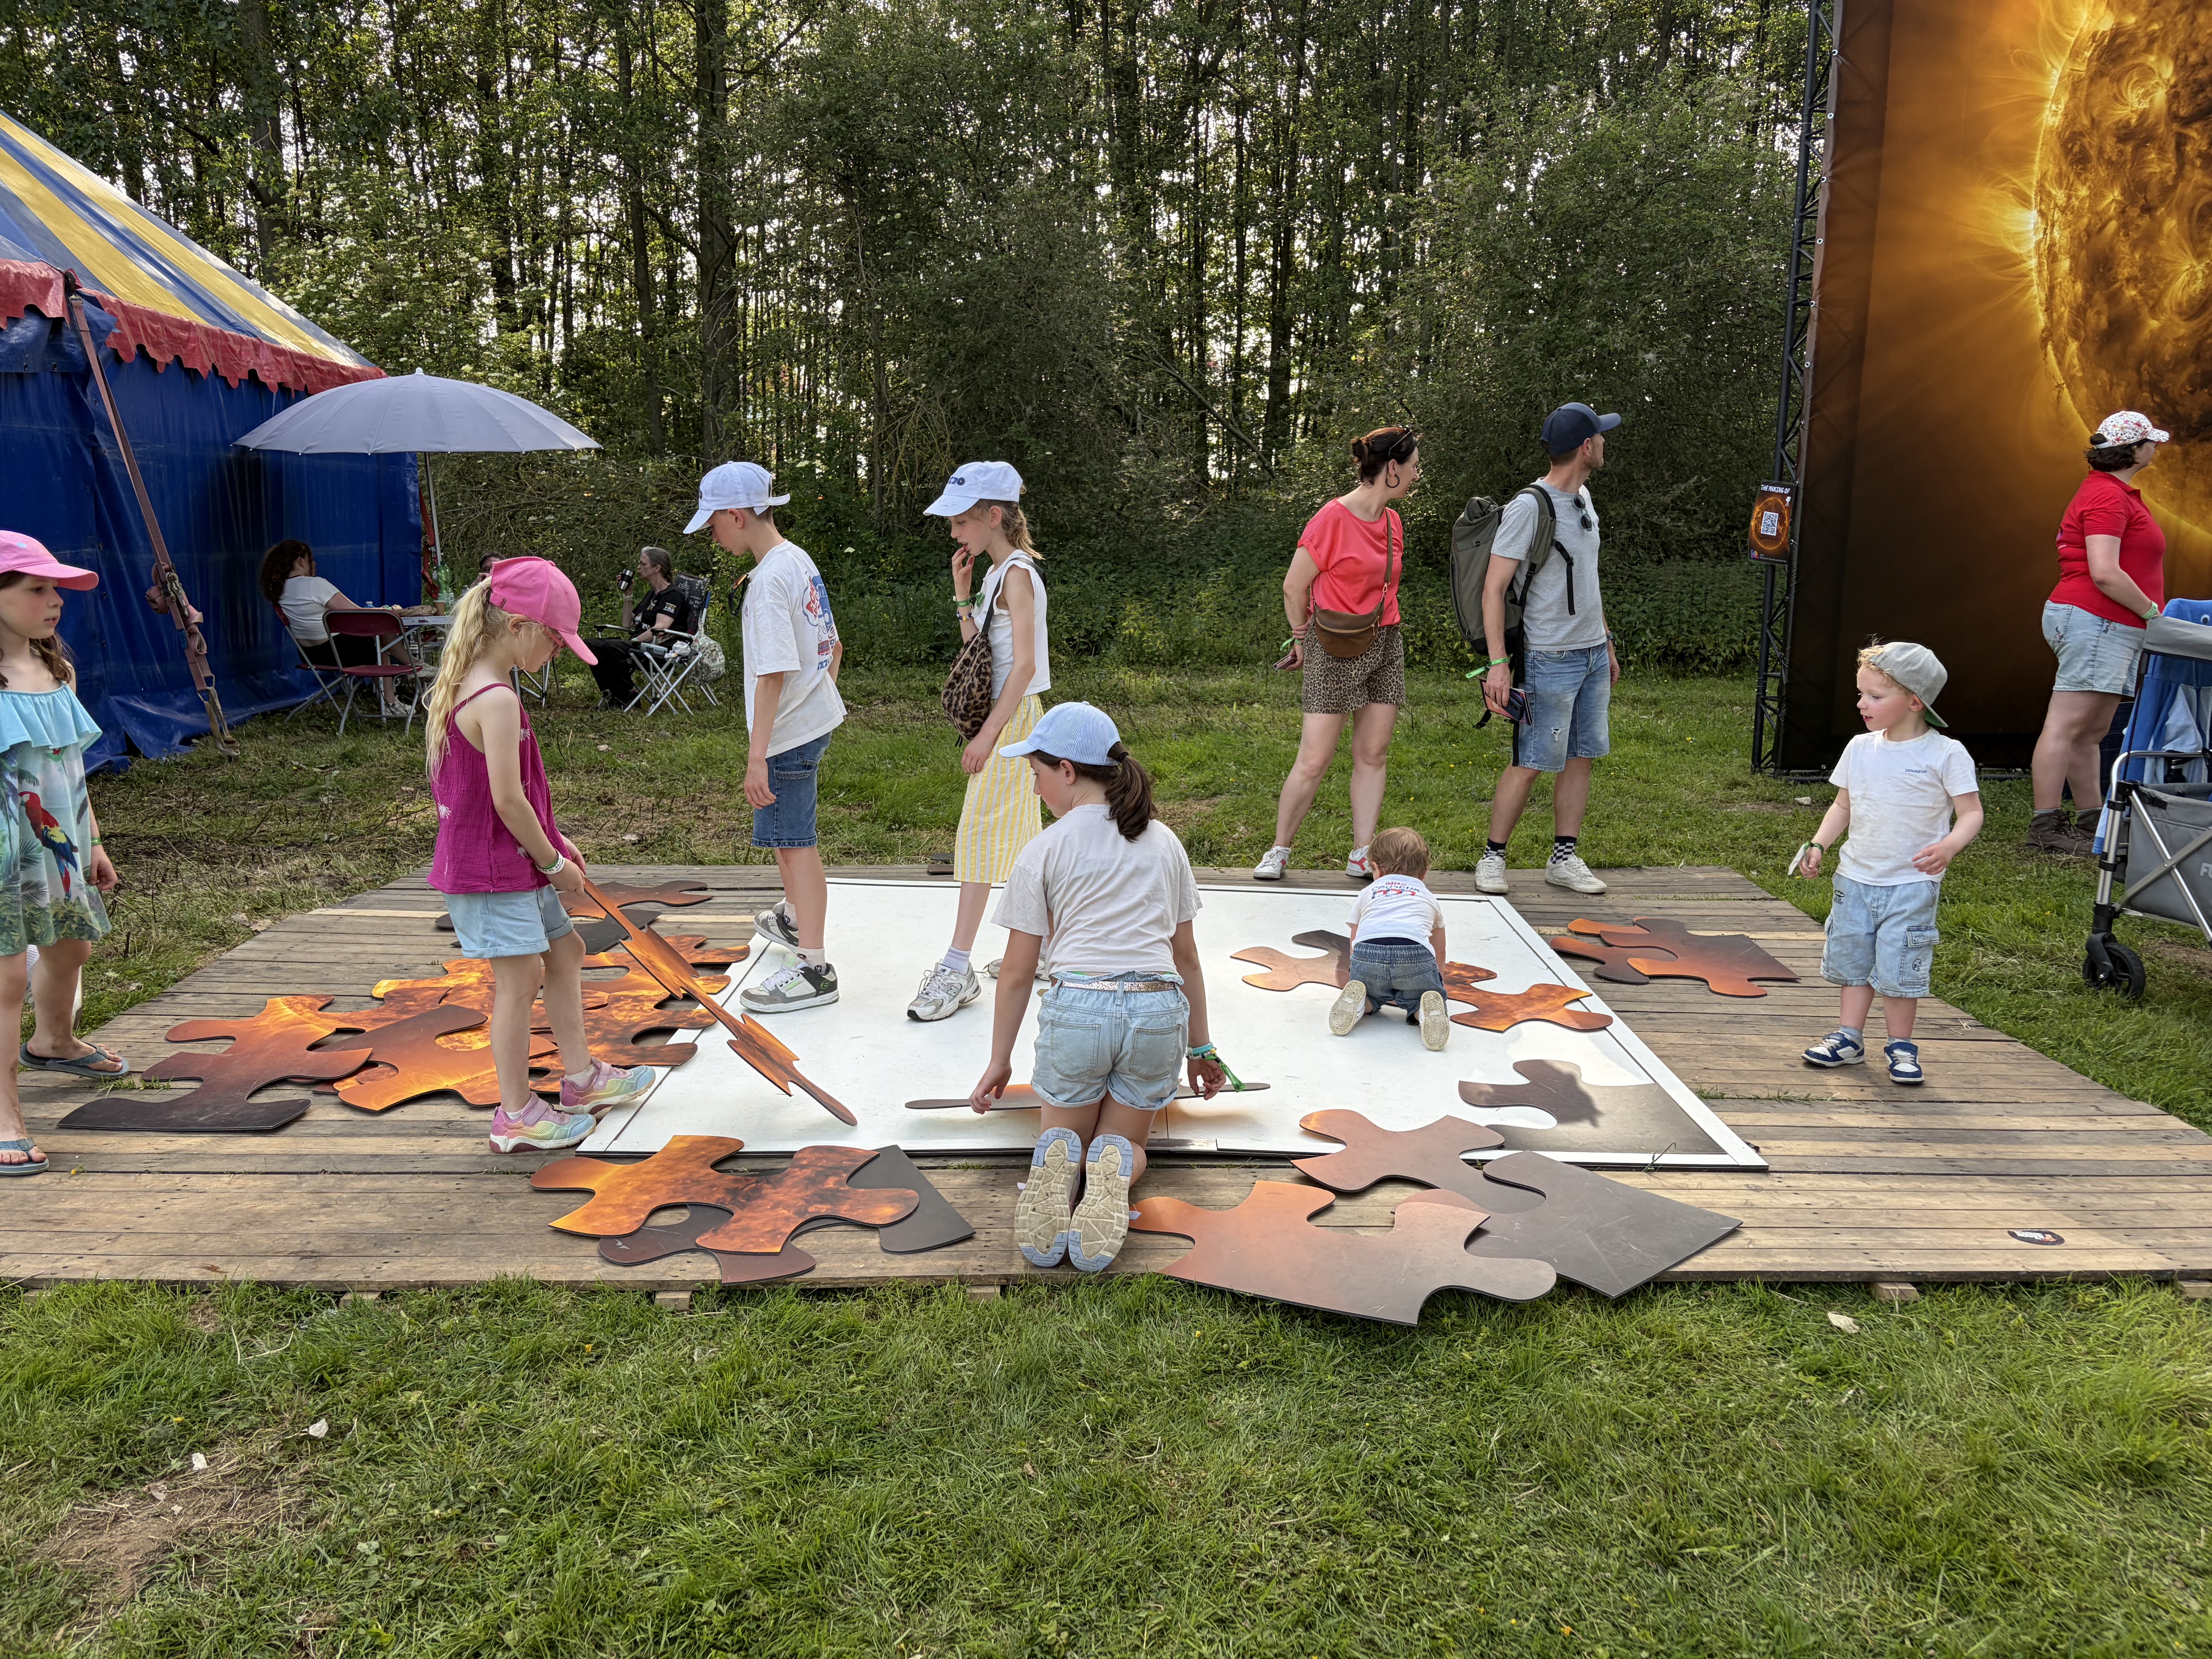
STCE at the Nerdland Science Festival
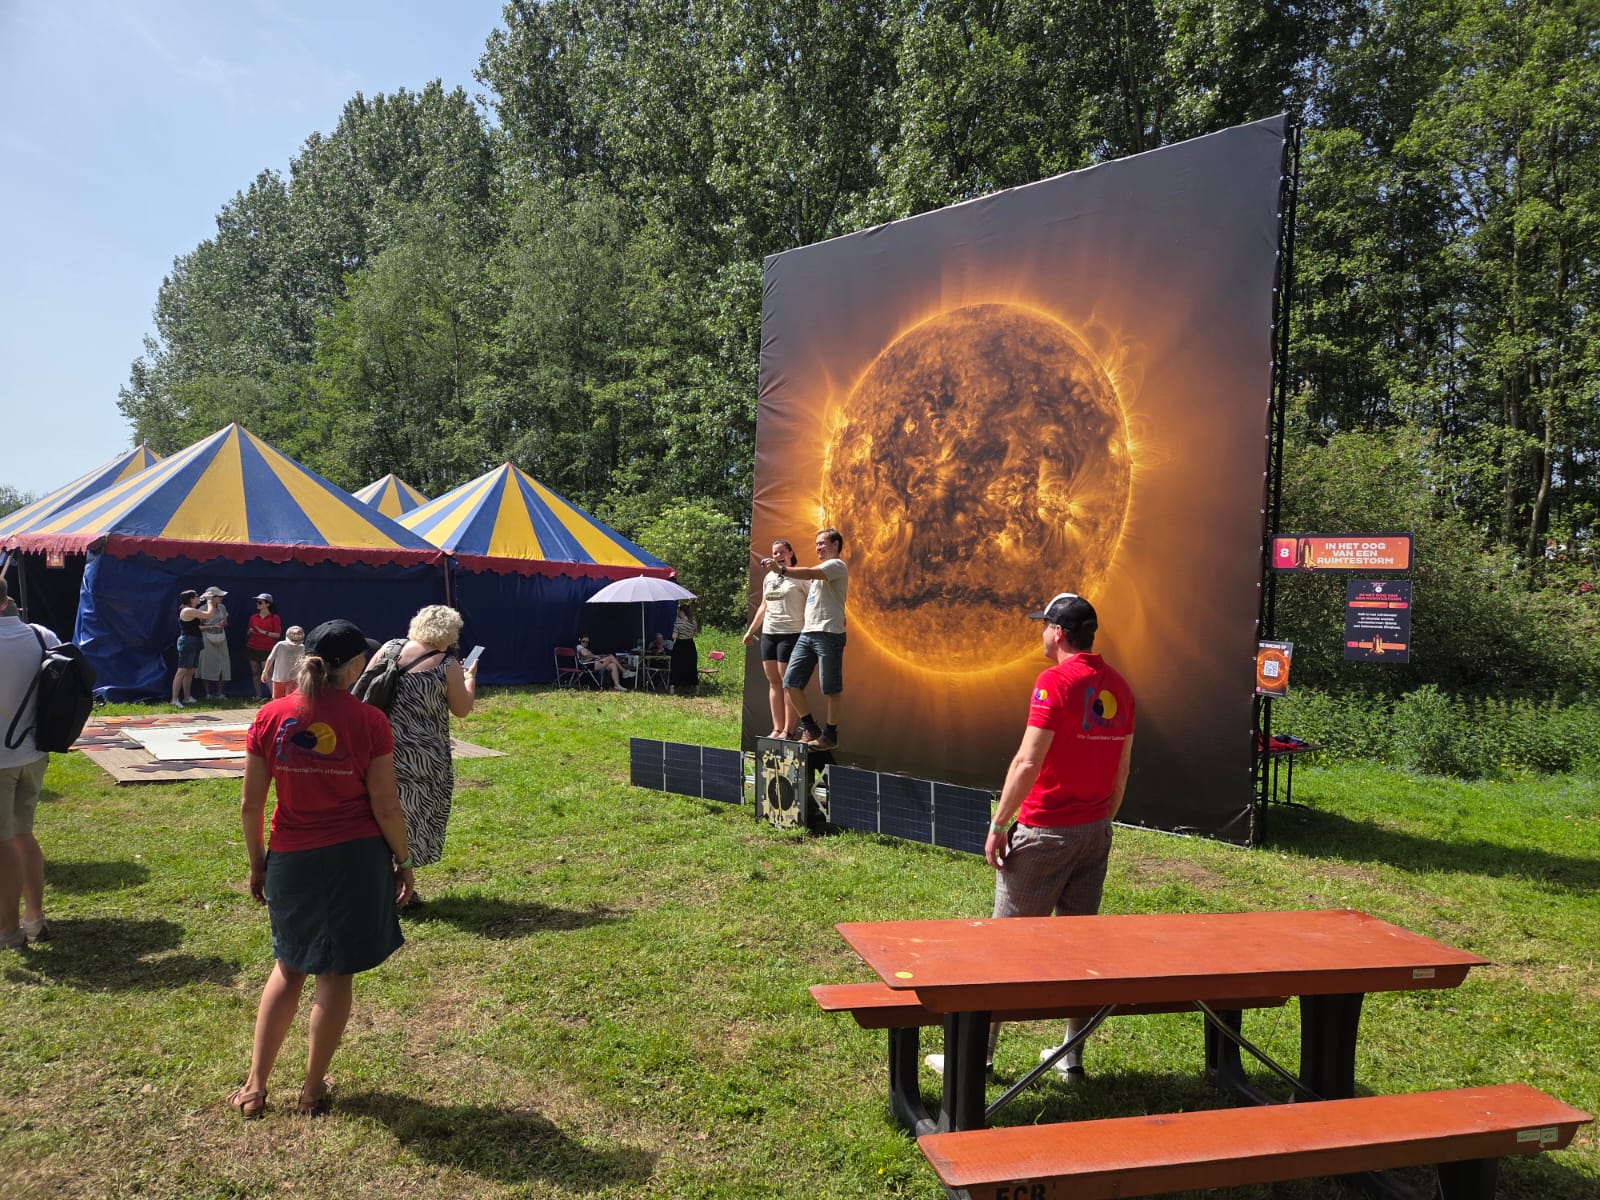
From May 22 to 25 the Nerdland Festival welcomed over 30.000 nerds in the Puyenbroeck Wachtebeke domain, close to Ghent, Belgium. Nerdland is the biggest science festival in the Benelux region (Belgium, Netherlands and Luxembourg).
After a successful edition last year, the STCE returned to Nerdland with even more experiences. We brought our enormous photobooth, where you can fly on the Solar Orbiter satellite in front of the Sun, holding the Earth in the palm of your hand. Children could puzzle the mosaic image of the Sun together. Visitors interested in space weather were immersed in our space weather room through a full dome experience. The cherry on top was the STCE show 'In the eye of a solar storm'!
Below are some impressions of the festival, we look forward to next year's edition!

Review of Solar and Geomagnetic Activity
Solar Active Regions (ARs) and flares
The solar flaring activity of the past week reached moderate levels on 22 May and low levels the rest of the week. The M-class flare of the week (SIDC flare 7753) was an M4,3 that peaked on 22 May at 10:20 UTC and was emitted by SIDC Sunspot Group (SG) 825 (NOAA Active Region [AR] 4436, Beta magnetic configuration).
Coronal mass ejections
No Earth-directed Coronal Mass Ejections (CME) were observed in the last 24 hours.
Coronal Holes
SIDC Coronal Hole 164 is a southern, high-latitude, positive polarity structure. It started crossing the solar central meridian on 20 May.
Proton flux levels
The greater than 10 MeV proton flux, as measured by the GOES-19 satellite, was at nominal levels throughout the last week.
Electron fluxes at GEO
During the last week the greater than 2 MeV electron flux as, measured by GOES 19, was above the 1000 pfu alert threshold almost constantly. The highest value observed was 5900 pfu on 17 May at 20:53 UTC.
The electron fluence was at moderate levels throughout this period.
Solar wind
At the start of the previous week the Solar Wind (SW) conditions were affected by an HSS that lasted only until 18 May. The SW speed reached 700 km/s, the interplanetary magnetic field (B) was below 4, and its North-South component (Bz) varied from -4 to 4 nT.
A glancing blow from a Coronal Mass Ejection (SIDC CME 656) arrived on 19 May and lasted only for that day. The SW speed increased from 480 to 650 km/s, the interplanetary magnetic field (B) reached a maximum value of 8 nT, and its North-South component (Bz) varied from -7 to 5 nT.
The rest of the week the SW featured a slow SW regime. The SW speed dropped to 290 km/s by the end of the week. The interplanetary magnetic field (B) was up to 8 nT, and its North-South component (Bz) varied from -7 to 5 nT.
Geomagnetism
The global and local geomagnetic conditions reached active levels (NOAA Kp 4 and K BEL 4) on 19 May. The rest of the last week they varied between quiet and unsettled levels (NOAA Kp 0+ to 3, K BEL 1 to 3).
International Sunspot Number by SILSO

The daily Estimated International Sunspot Number (EISN, red curve with shaded error) derived by a simplified method from real-time data from the worldwide SILSO network. It extends the official Sunspot Number from the full processing of the preceding month (green line), a few days more than one solar rotation. The horizontal blue line shows the current monthly average. The yellow dots give the number of stations that provided valid data. Valid data are used to calculate the EISN. The triangle gives the number of stations providing data. When a triangle and a yellow dot coincide, it means that all the data is used to calculate the EISN of that day.
PROBA2 Observations
Solar Activity
Solar flare activity fluctuated from low to moderate during the week.
In order to view the activity of this week in more detail, we suggest to go to the following website from which all the daily (normal and difference) movies can be accessed: https://proba2.oma.be/ssa
This page also lists the recorded flaring events.
A weekly overview movie (SWAP week 843) can be found here: https://proba2.sidc.be/swap/data/mpg/movies/weekly_movies/weekly_movie_2026_05_18.mp4.
Details about some of this week's events can be found further below.
If any of the linked movies are unavailable they can be found in the P2SC movie repository here: https://proba2.oma.be/swap/data/mpg/movies/.
Friday May 22
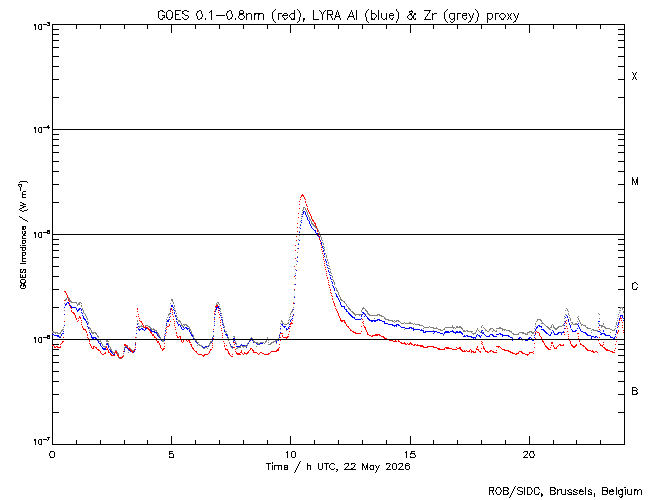
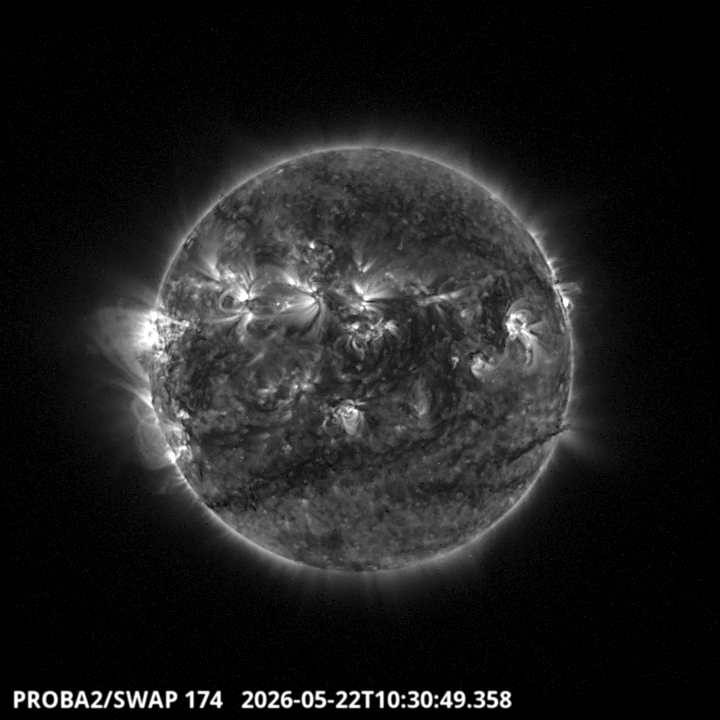
The largest and only M-class flare of this week was an M2.3, and it was observed by LYRA (top panel) and SWAP (bottom panel). The flare peaked on 2026-May-22 at 10:29 UT and occurred at the western limb of the Sun, originating from active region NOAA4436.
Find a SWAP movie of the event here: https://proba2.sidc.be/swap/movies/20260522_swap_movie.mp4.
Noticeable Solar Events
| DAY | BEGIN | MAX | END | LOC | XRAY | OP | 10CM | TYPE | Cat | NOAA |
| 22 | 1003 | 1029 | 1101 | M2.3 | 4436 |
| LOC: approximate heliographic location | TYPE: radio burst type |
| XRAY: X-ray flare class | Cat: Catania sunspot group number |
| OP: optical flare class | NOAA: NOAA active region number |
| 10CM: peak 10 cm radio flux |
Geomagnetic Observations in Belgium
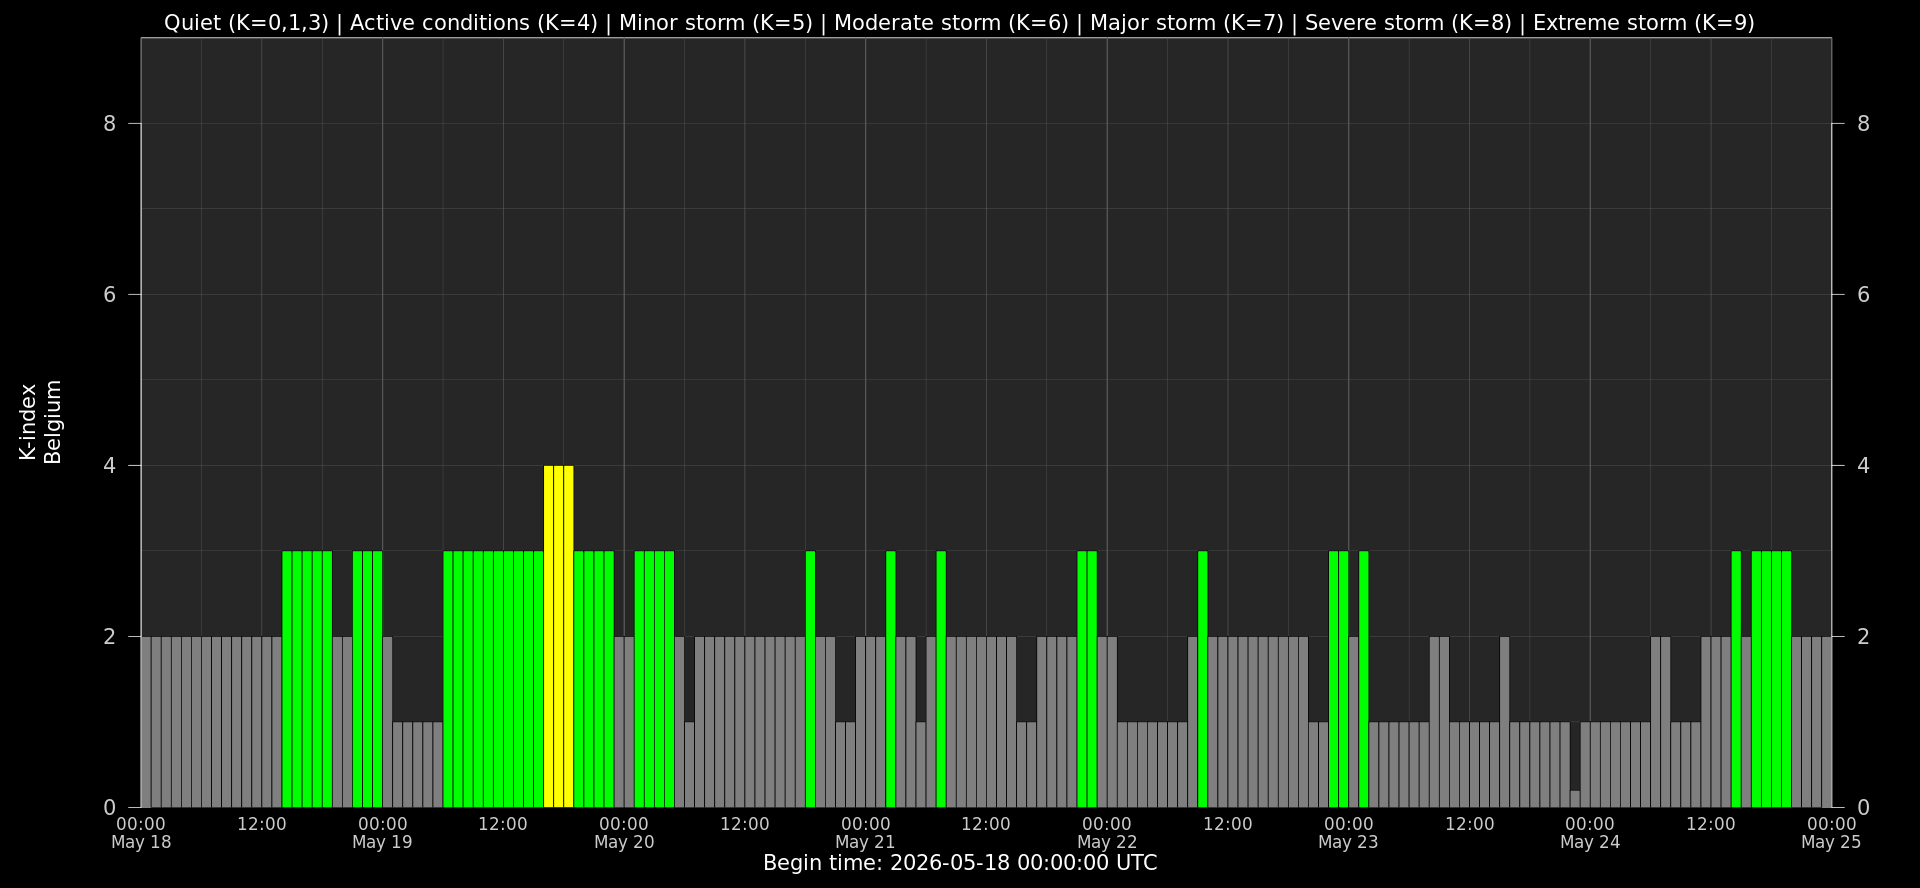
Local K-type magnetic activity index for Belgium based on data from Dourbes (DOU) and Manhay (MAB). Comparing the data from both measurement stations allows to reliably remove outliers from the magnetic data. At the same time the operational service availability is improved: whenever data from one observatory is not available, the single-station index obtained from the other can be used as a fallback system.
Both the two-station index and the single station indices are available here: http://ionosphere.meteo.be/geomagnetism/K_BEL/
The SIDC Space Weather Briefing
The forecaster on duty presented the SIDC briefing that gives an overview of space weather from May 18 to 24.
The pdf of the presentation: https://www.stce.be/briefings/20260525_SWbriefing.pdf

Upcoming Activities
Courses, seminars and events with the Sun-Space-Earth system and Space Weather as the main theme. We provide occasions to get submerged in our world through educational, informative and instructive activities.
* Jun 15-17, 2026, STCE Space Weather Introductory Course, Brussels, Belgium - register: https://events.spacepole.be/event/256/ - Fully booked
* Oct 12-14, 2026, STCE Space Weather Introductory Course, Brussels, Belgium - register: https://events.spacepole.be/event/257/ - Reserved
* Oct 29- Nov 1, 2026, Prior to ESWW2026 - Space Weather Training Course in Firenze, Italy - Apply: https://events.spacepole.be/event/278/
* Nov 2-6, 2026, European Space Weather Week, Florence, Italy, https://esww2026.eswan.eu/
* Nov 23-25, 2026, STCE course: Role of the ionosphere and space weather in military communications, Brussels, Belgium - register: https://events.spacepole.be/event/259/
* Dec 7-9, 2026, STCE Space Weather Introductory Course for Aviation, Brussels, Belgium - register: https://events.spacepole.be/event/262/
To register for a course and check the seminar details, navigate to the STCE Space Weather Education Center: https://www.stce.be/SWEC
If you want your event in the STCE newsletter, contact us: stce_coordination at stce.be
Website: https://www.stce.be/SWEC