- Table of Content
- 1.The great geom...
- 2.Space Weather ...
- 3.Review of sola...
- 4.International ...
- 5.Noticeable Sol...
- 6.Geomagnetic Ob...
- 7.The SIDC Space...
- 8.Events and Tra...
2. Space Weather forecasters on excursion
3. Review of solar activity
4. International Sunspot Number by SILSO
5. Noticeable Solar Events
6. Geomagnetic Observations in Belgium
7. The SIDC Space Weather Briefing
8. Events and Training courses
The great geomagnetic storm of 4 February 1872
Over the last few decades, the Earth's magnetic field has been rattled several times by the passage of powerful coronal mass ejections (CMEs), magnetic clouds of charged particles expelled by violent solar eruptions. Typical examples of these extremely severe geomagnetic storms, which reach the maximum of "9o" on the Kp index (STCE SWx classification page at https://www.stce.be/educational/classification#levelsmagn ), are the Mother's Day storm (or Gannon storm) of 10-11 May 2024, the Halloween storms late October 2003, and the March 1989 storm. These storms reached a minimum Disturbance storm-time index (Dst ; https://www.stce.be/educational/classification#geomag ) between -350 and -600 nT, and had a significant impact on our technologies.
Within this select club of extremely severe storms, there exists a trio with a minimum Dst that is about 50% stronger than the rest of the pack, so somewhere in the -800 nT to -950 nT range. The obvious example is of course the famous Carrington event of 1-2 September 1859 (Dst = -949 +/- 31 nT; Hayakawa et al. 2022 - https://iopscience.iop.org/article/10.3847/1538-4357/ac2601 ). Some may also recall that the strongest geomagnetic storm of the entire 20th century was not the March 1989 storm, but the -also famous- New York Railroad Storm of 14-15 May 1921 (STCE newsitem at https://www.stce.be/news/529/welcome.html ) with an estimated minimum Dst of -907 +/- 132 nT (Love et al. 2019 - https://doi.org/10.1029/2019SW002250 ). Note that because the modern Dst index was only established in 1957, the exact Dst value for these storms cannot be directly calculated and has to be proxied using surviving ground-based magnetometer records.
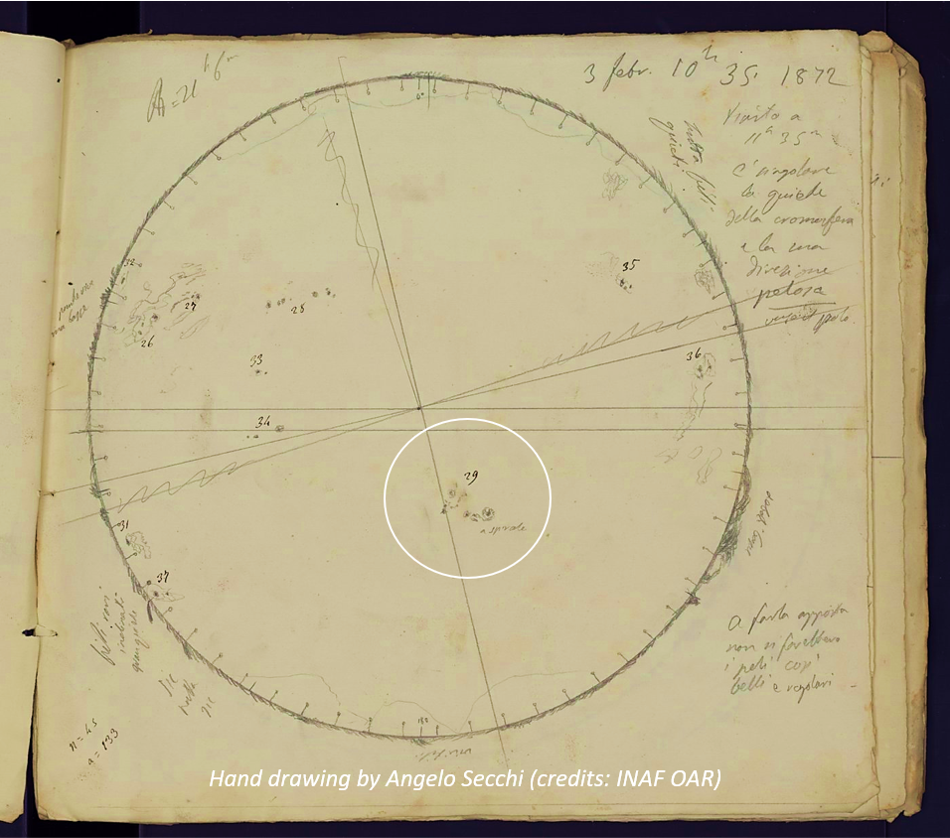
The third of these "superstorms" is the one from 4 February 1872, also known as the Chapman–Silverman storm (C-S storm). It occurred in the declining phase of the very strong solar cycle 11 which had a smoothed maximum of 234 (!) in August 1870 (SILSO - https://www.sidc.be/SILSO/cyclesminmax ). A study by Hayakawa and his collaborators a few years ago (2023 - https://doi.org/10.3847/1538-4357/acc6cc ) indicated that the minimum Dst during the C-S storm reached a value of -834 nT, and that this was a conservative estimate. The source region was most likely a moderately sized sunspot group about 3 times the surface are of the Earth, and located close to the Sun's central meridian. This sunspot group, labeled "29" on solar drawings by the Italian astronomer Angelo Secchi, had a complex and unusual shape. As can be seen in the annotated hand drawing (above) by Angelo Secchi from 3 February 1872, there was no clear bipolar structure of the dominant spots. Indeed, contrary to most sunspot groups, which are mostly parallel with the solar equator, this group did not have a particular axis of symmetry. Its outlook shared some characteristics with the considerably larger NOAA 12673 in September 2017, the group responsible for the strongest solar flares of the preceding solar cycle 24 (STCE newsitem https://www.stce.be/news/402/welcome.html ). Hence, the general shape and proximity of multiple individual sunspots suggest some magnetic polarity mixing within the group, and thus an increased chance on strong flaring from this active region. There is no direct evidence of a flare and solar eruption in Group 29 in Secchi's drawings, as there existed no systematic flare patrols in the early 1870s and chromospheric observations (H-alpha) were just not sufficiently evolved yet.
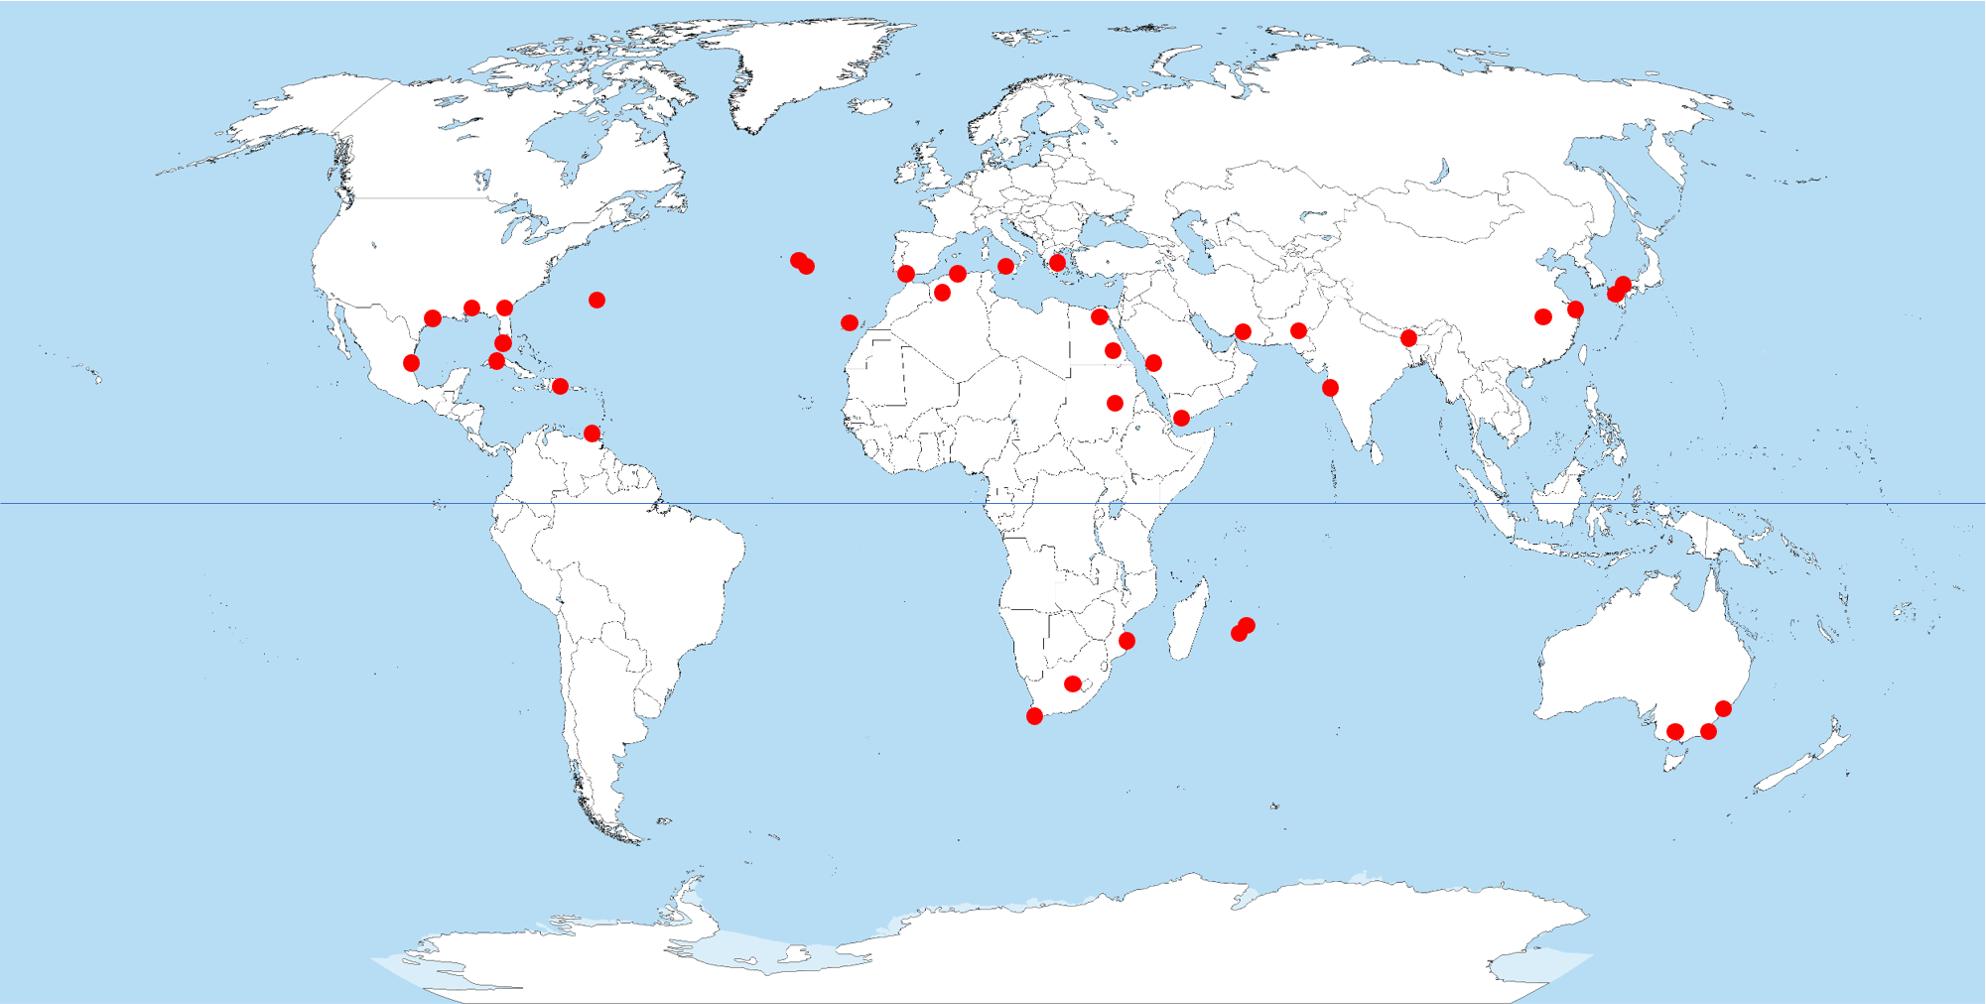
The C-S storm has become famous for the intense and dynamic auroras that were visible at that time. Many observers commented on the bright red pillars ("columns of fire") shooting from the horizon all the way up to the zenith. In Hamada (south-west Japan), the brightness of the auroral display enabled observers to count the trees on the mountains and in the forests. Some villagers thought that big cities such as Kyoto and Nagoya were ablaze (Hayakawa et al. 2018 - https://doi.org/10.3847/1538-4357/aaca40 ). The auroras were seen overhead from locations as far south as Jacobabad (Pakistan; British India at that time) and Shanghai (China), both at about 20° in magnetic latitude (MLAT). Auroral visibility was reported from 13 locations with MLAT between -20° and +20°, many more than the single location recorded for the 1859 and 1921 storms. Mind-boggling examples are Aden (Jemen), Mecca (Saudi Arabia), Bombay (Mumbai, India), and Khartoum (Sudan). Other quite equatorial locations were Mauritius (near Madagascar), Sifook (Mozambique) and Tobago (just north of Venezuela!). In Bloemfontein (South-Africa), the bright red streamers frightened the natives considerably (Stone, 1872 - https://www.nature.com/articles/005443b0 ). In Havana, a correspondent from the New York Times wrote that "...the number of men and women who read the destruction of the world in this sign, was large and the latter took great care to go to church and pray that the calamity might be averted." (Sten Odenwald - https://www.solarstorms.org/SRefStorms.html ). The map above depicts the more equatorial locations from which aurora were observed, based on a selection of stations from the Hayakawa et al. papers and the Silverman 2008 article (https://doi.org/10.1016/j.jastp.2008.03.012 ). The auroral extension and conservatively estimated storm intensity are good indicators that this geomagnetic storm was of comparable strength as the extreme storms of September 1859 and May 1921. This places the 1872 storm amongst the three largest geomagnetic storms yet observed.
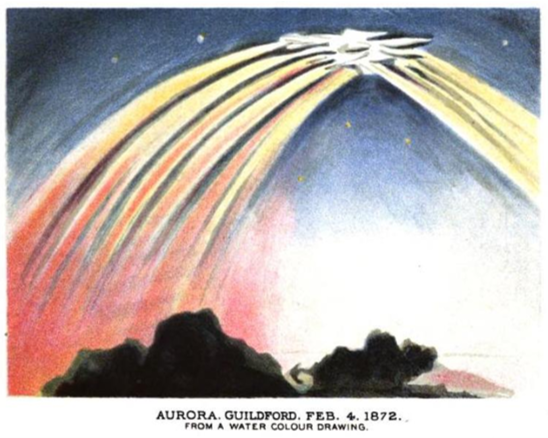
Water-colour sketch of the 4 February 1872 aurora
Credits: Capron J.R.; Aurorae: Their Characters and Spectra (1879 ; pp. 19-21)
https://www.gutenberg.org/files/56159/56159-h/56159-h.htm
It's no surprise then that the auroras were well observed from Belgium too. In its annuary of 1873, the Royal Observatory of Belgium (ROB) consecrated no less than 10 pages to this event alone. It contains reports from about a dozen of observers spread over the entire country, from Ostende to Liège. The descriptions of the auroras (in French) are similar to the ones mentioned above, maybe highlighting also the presence of violet blue colours in particular during the beginning of the celestial phenomenon. Many commented on the auroral corona ("polar crown") high up in the (southern) sky from which bright white and red beams propagated downward all the way to the horizon. The image above is a water-colour sketch of the auroras made by J.R. Capron from Guildford (UK).
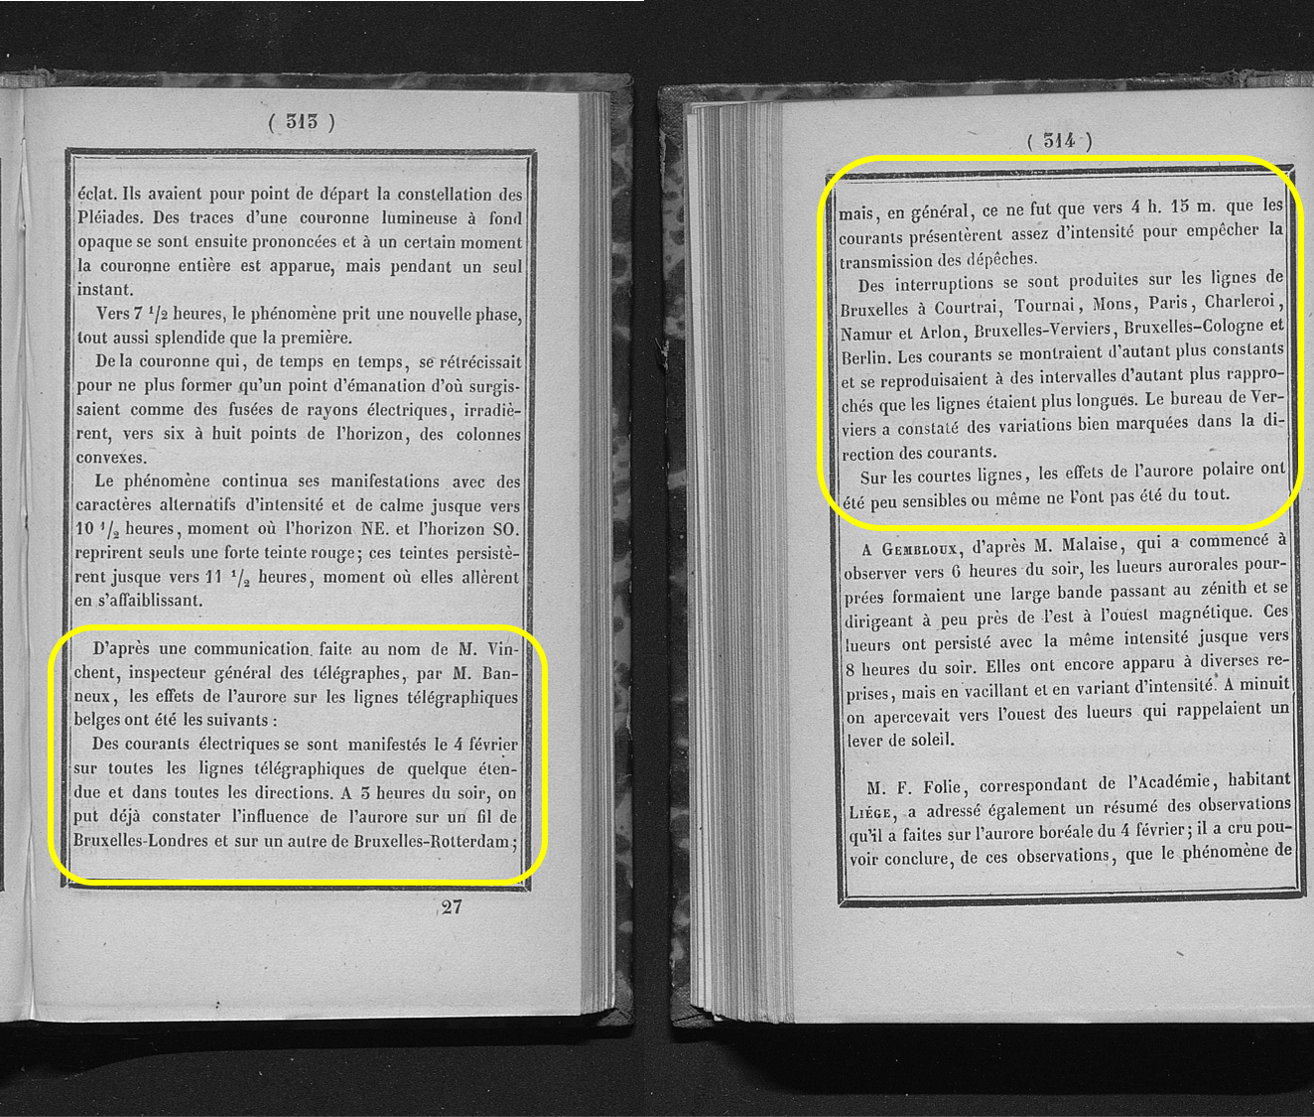
The annuary also contains a description of the impact of the geomagnetic storm on the high-tech assets at that time, i.e. the telegraph lines (see annotated pages underneath). The inspector-general of the telegraphs mentioned that the effects of "... electrical currents were present on 4 February on all telegraph lines and in all directions. Affecting already from 3 pm local time the messagery between Brussels and London and between Brussels and Rotterdam, it was not until 4:15 pm that the currents were strong enough as to prohibit the sending of telegraphic messages. Interruptions were observed on all lines, not only in Belgium (e.g. Brussels-Namur, Brussels-Kortrijk), but also on the lines to Paris, Berlin and Cologne. It was noted that the longer the lines, the more constant the currents were and the more they recurred at increasingly shorter intervals." Telegraph lines were disturbed for hours by these electrical currents all over the world, even at locations far away from the poles, such as between Cairo and Khartoum, and the submarine cable in the Indian Ocean between Bombay (Mumbai) and Aden (Jemen) - (Hayakawa et al. 2023). Also, according to Angot (1897 - https://www.spaceweather.gc.ca/tech/se-chr-en.php ), "... many of the submarine cables were so affected as to prevent the transmission of any messages; the disturbance was especially marked on the line from Lisbon to Gibraltar, on the Mediterranean cable, on the line from Suez to Aden, and from Aden to Bombay, and finally along the Transatlantic cable from Brest (France) to Duxbury (Massachusetts, USA)."
Also another transatlantic cable (or "canapo transatlantico" as Secchi called it) got severely disturbed (Berrilli and Giovannelli, 2021 - https://doi.org/10.1051/swsc/2021046 ), basically disrupting the entire telegraph service connecting the United States and Europe. In fact, Europe in the decade 1850-1860 had built about 100,000 km of telegraph lines. Starting from 1866, two transoceanic cables were activated that connected the United States (Heart's Content, Newfoundland ) with Europe (Valentia, Ireland). Therefore, it was possible to send telegrams with a transmission speed of about 8 words per minute. However, this global cabling, initially made with a wire technology and which was laid at high latitudes, was obviously very sensitive to magnetic field variations and to what is now called geomagnetically induced currents (GICs). During the 4 February 1872 storm, voltages of 1000 to 2000 Volts were recorded over the transatlantic cable (Sten Odenwald - https://www.solarstorms.org/Scommun.html ), effectively drowning the weak signals normally used to transmit the messages (only a few 10s of Volts). On Valentia Island, the lines had to be disconnected entirely from the sensitive instruments to prevent the induced currents from burning out the delicate instruments.
In conclusion: Based on the impressive auroral display, the very negative Dst, and the havoc created amongst the telegraphic services, the 4 August 1872 storm rightfully deserves its place in the Top 3 of strongest geomagnetic storms of the last 200 years.
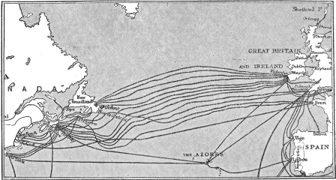
The transatlantic cable system in 1903
Charles Bright: The Story of the Atlantic Cable (1903)
https://www.gutenberg.org/files/46105/46105-h/46105-h.htm
Space Weather forecasters on excursion
Space Weather forecasters of the STCE went on a field trip to ... Dourbes, a place where GSM signals are scarce, neutrons run wild, electrons crackle and creak high above our heads, the earth magnetic field is casted into a graph and the radio channel is tuned to cosmic noise.
Tobias Verhulst guided the forecasters through this wild life of geo-research, some done in remarkable places that speak to the imagination. The visit was classified as a success. Thanks Tobias!


Review of solar activity
Solar Active Regions (ARs) and flares
Mostly low solar flaring activity, with a moderate interval, was observed this week. A few C-class flares and one M-class flare were recorded. The strongest flare was an M1.1 flare (SIDC Flare 7797), peaking at 07:04 UTC on May 29, associated with SIDC Sunspot Group 860 (NOAA Active Region 4455, magnetic type beta). There was a total of 21 numbered active regions on the visible disk, mostly with magnetic types alpha and beta. SIDC Sunspot Group 879 (NOAA Active Region 4452) briefly developed a beta-gamma magnetic type on May 29-30.
Coronal mass ejections
Three partial halo Coronal Mass Ejections (CMEs) were detected, but they were either back-sided events or the source region was near the limbs. None of these CMEs was Earth-directed.
The first partial halo CME (SIDC CME 658) was observed in LASCO/C2, LASCO/C3 and STEREO-A coronagraph imagery, starting from 22:30 UTC on May 25, lifting off from the west limb. The bulk of the ejecta propagated to the northwest, with an estimated projected speed of around 1250km/s.
The second was a slow partial halo CME (SIDC CME 660) was observed in LASCO/C2, LASCO/C3 and STEREO-A coronagraph imagery, starting from 13:30 UTC on May 26. The bulk of the ejecta propagated to the south with an estimated projected speed of around 280-300 km/s.
The third partial halo CME (SIDC CME 662) was observed in LASCO/C2, LASCO/C3 and STEREO-A coronagraph imagery, starting from 08:30 UTC on May 30, lifting off from the north limb with a projected speed of 550 km/s.
Coronal Holes
Three negative polarity coronal holes crossed the central meridian. The first was a southern coronal hole (SIDC Coronal Hole 149), which crossed the central meridian on May 25. The second was a northern coronal hole (SIDC Coronal Hole 142) and crossed the central meridian on May 26. The last was a small, equatorial coronal hole (SIDC Coronal Hole 165) and crossed the central meridian on May 28.
Proton flux levels
The greater than 10 MeV proton flux was mostly below the 10 pfu threshold throughout the week. It briefly exceeded the 10 pfu threshold between 00:10 UTC and 04:30 UTC on May 26. The increase was associated with the partial halo CME (SIDC CME 658). It has then gradually decreased to nominal levels.
Electron fluxes at GEO
The greater than 2 MeV electron flux as measured by GOES 18 was enhanced after May 29 but remained below the 1000 pfu threshold throughout the week. The greater than 2 MeV electron flux as measured by GOES 19 remained below the 1000 pfu threshold throughout the week. The 24-hour electron fluence was at moderate levels on May 25 and decreased back to nominal levels for the rest of the week.
Solar wind
The solar wind parameters reflected mostly slow solar wind conditions until May 30, with some isolated small enhancements. Since the UTC afternoon on May 30, the solar wind parameters were enhanced, under the influence of high-speed streams from the negative polarity coronal holes. The solar wind speed increased up to 560 km/s. The interplanetary magnetic field reached a maximum of 11 nT and the Bz component a minimum of -11 nT. A gradual return to slow solar wind conditions followed towards the end of the week.
Geomagnetism
The global geomagnetic conditions were mostly quiet to unsettled (NOAA Kp 1 to 2), with short, isolated active intervals (NOAA Kp 4). A longer active interval was observed between 18:00 UTC on May 30 and 03:00 UTC on May 31, under the effect of the high-speed streams from the negative polarity coronal holes. The local geomagnetic conditions were also mostly quiet to unsettled (K Bel 1 to 2), with few isolated active intervals (K Bel 4). A longer active interval was recorded between 18:00 UTC and 22:00 UTC on May 30.
International Sunspot Number by SILSO

The daily Estimated International Sunspot Number (EISN, red curve with shaded error) derived by a simplified method from real-time data from the worldwide SILSO network. It extends the official Sunspot Number from the full processing of the preceding month (green line), a few days more than one solar rotation. The horizontal blue line shows the current monthly average. The yellow dots give the number of stations that provided valid data. Valid data are used to calculate the EISN. The triangle gives the number of stations providing data. When a triangle and a yellow dot coincide, it means that all the data is used to calculate the EISN of that day.
Noticeable Solar Events
| DAY | BEGIN | MAX | END | LOC | XRAY | OP | 10CM | TYPE | Cat | NOAA |
| 29 | 0640 | 0704 | 0724 | N14E61 | M1.1 | SF | 37 | 4455 |
| LOC: approximate heliographic location | TYPE: radio burst type |
| XRAY: X-ray flare class | Cat: Catania sunspot group number |
| OP: optical flare class | NOAA: NOAA active region number |
| 10CM: peak 10 cm radio flux |
Geomagnetic Observations in Belgium

Local K-type magnetic activity index for Belgium based on data from Dourbes (DOU) and Manhay (MAB). Comparing the data from both measurement stations allows to reliably remove outliers from the magnetic data. At the same time the operational service availability is improved: whenever data from one observatory is not available, the single-station index obtained from the other can be used as a fallback system.
Both the two-station index and the single station indices are available here: http://ionosphere.meteo.be/geomagnetism/K_BEL/
The SIDC Space Weather Briefing
The forecaster on duty presented the SIDC briefing that gives an overview of space weather from May 25 to 31.
The pdf of the presentation: https://stce.be/briefings/20260601_SWbriefing.pdf
Events and Training courses
Courses, seminars and events with the Sun-Space-Earth system and Space Weather as the main theme. We provide occasions to get submerged in our world through educational, informative and instructive activities.
* Jun 8, 2026, Watching the Sun: a 200 year journey, public visits of the solar physics and space weather department, NL/FR/EN, Brussels, Belgium - book your tickets on https://200year.observatory.be/en-gb/coupole
* Jun 15-17, 2026, STCE Space Weather Introductory Course, Brussels, Belgium - register: https://events.spacepole.be/event/256/ - Fully booked
* Oct 12-14, 2026, STCE Space Weather Introductory Course, Brussels, Belgium - register: https://events.spacepole.be/event/257/ - Reserved
* Oct 29- Nov 1, 2026, Prior to ESWW2026 - Space Weather Training Course in Firenze, Italy - Apply: https://events.spacepole.be/event/278/
* Nov 2-6, 2026, European Space Weather Week, Florence, Italy, https://esww2026.eswan.eu/
* Nov 23-25, 2026, STCE course: Role of the ionosphere and space weather in military communications, Brussels, Belgium - register: https://events.spacepole.be/event/259/
* Dec 7-9, 2026, STCE Space Weather Introductory Course for Aviation, Brussels, Belgium - register: https://events.spacepole.be/event/262/
To register for a course and check the seminar details, navigate to the STCE Space Weather Education Center: https://www.stce.be/SWEC
If you want your event in the STCE newsletter, contact us: stce_coordination at stce.be
Website: https://www.stce.be/SWEC