
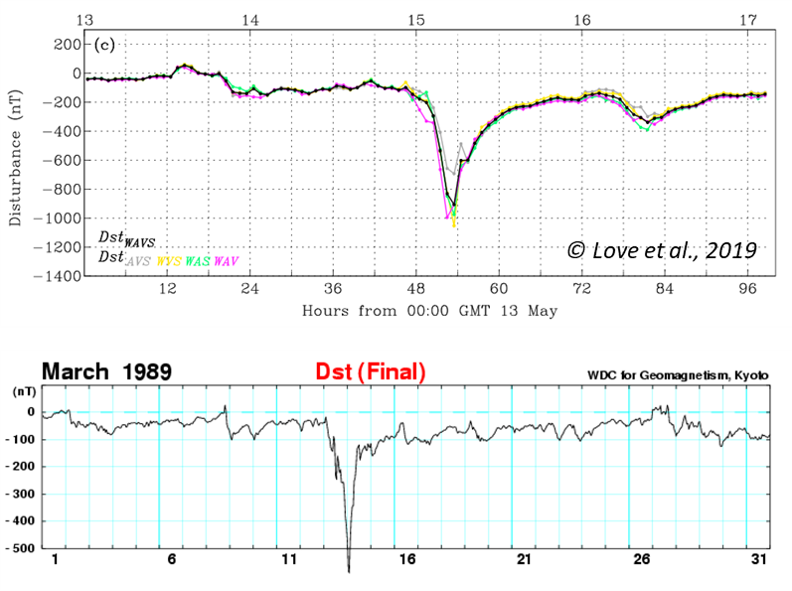
On 15 May 1921, the strongest geomagnetic storm of the entire 20th century took place. With a reconstructed Dst index of 907 +/- 132 nT (Love et al., 2019), it was significantly stronger than the March 1989 storm (-589 nT ; see the comparison underneath) and of comparable strength as the Carrington storm in 1859 (Dst between -850 (Siscoe et al., 2006) and -1050 nT (Gonzalez et al., 2011). The Dst ("Disturbance storm-time") index is calculated by 4 near-equatorial geomagnetic observatories and reflects variations in the intensity of the ring current. The stronger the disturbance, the more negative is the Dst index. Underneath a comparison of the storms from 1921 (black curve, Dst reconstructed from 4 observatories; from Love et al. 2019) and 1989 (from the Kyoto World Data Center for Geomagnetism). Mind the difference in scaling of both the horizontal (time) and vertical (Dst) axis.
This strong geomagnetic storm induced electrical currents in the Earth's crust which found their way in telegraph/telephone systems, the key technologies at that time. Telegraph service was severely disturbed worldwide. Telegraph systems in Paris were unable to receive messages from the rest of Europe, or from the United States, during the night of 14/15 May. In Karlstadt (Sweden), currents were so strong they created a fire in the telegraph and telephone station. In Brewster (New York state), a railroad station got destroyed following a fire which was attributed to srong electrical currents in the telegraph system. Another fire destroyed a railroad control tower near New York City's Grand Central station, also and significantly delaying train traffic. However, recent research by Hapgood (2019) has indicated that the latter incident occurred well after the main storm phase and was probably due to technical failures. Nonetheless, the labelling of this geomagnetic storm as the "New York Railroad Storm" has remained, in view of the Brewster incident.
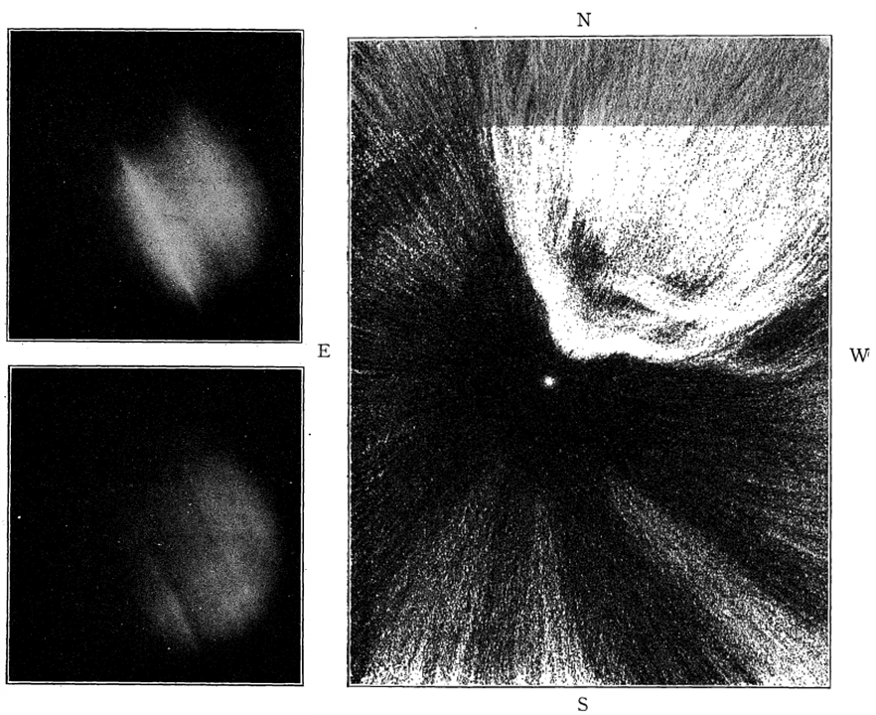
The polar lights were particularly bright, despite the first-quarter moon (Campbell, 1921). They were even seen from Samoa, which is only 14 degrees south of the Earth's equator, where intense red aurora were reported as high as 22 degrees in the sky (Hapgood, 2019). Other reports from southern locations were coming from Texas, Arizona, California, and Hawaii. In France, aurora were observed by Bernard Lyot and colleagues at Meudon. Three maxima of auroral intensity were reported (at 01:14, 02:10 and 03:05 GMT). The second maximum was most intense, obscuring some second magnitude stars and providing enough light to read watches and make notes. In New York, visitors from movie theatres returning home were treated on an encore performance by the night sky theatre, where aurora were so brilliant they easily outshone the Broadway lights. The two pictures below left were taken from the Lowell Observatory in Flagstaff, Arizona (!), USA and reported by Truman in the Popular Astronomy magazine (1921). The aurora were about 10 to 20 degrees above the northwestern horizon, the pictures bringing out very well the auroral streamers. The drawing on the right was made by L. J. Wilson from New York City (published in Popular Astronomy (1921), who commented that the shining auroral cloud was moving to Arcturus (the bright dot near the middle) from the northwest, and that it had colors of pale green and lavender.
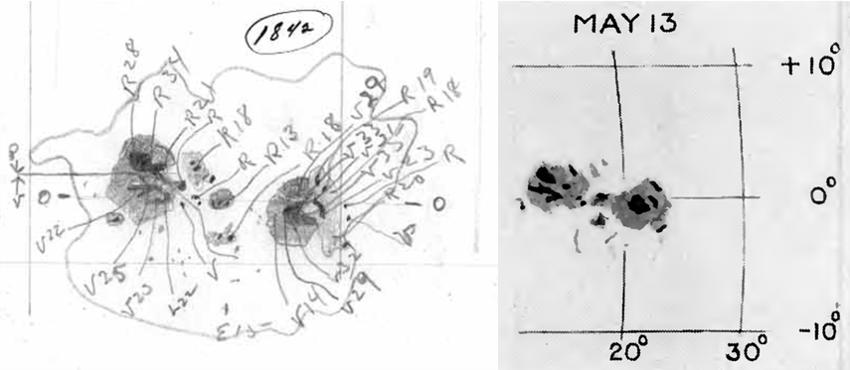
The source region of all this excitement was sunspot group Greenwich 933404, which rounded the Sun's east limb on 8 May. Its maximum area was reached on 11 May, and was about 10 times the total surface area of the Earth (see the Solar Cycle Science webpage), making it a large sunspot region, but not extremely so. Analysis of Mount Wilson drawings and magnetograms indicated that the sunspot group, here called Mount Wilson 1842, contained several magnetic delta's in its main portions. Delta's are spots of opposite magnetic polarity separated by less than 2 degrees and situated within the common penumbra. See the STCE Space Weather Classifications page for more information. These magnetic structures are known to increase the likelihood on very strong flares, which may be associated with solid coronal mass ejections. The figure above on the left is a Mount Wilson drawing of the group on 13 May, indicating the magnetic polarity and intensity of the sunspots. "V" means a direction of the magnetic field towards the Sun, "R" means away from the Sun, and the 2 numbers express the magnetic field strength in Gauss divided by 100. Typical values for sunspots are between 2600 and 2900 Gauss (Borrero et al., 2011). The drawing above on the right was made by projection with the 15-inch equatorial by the Rev. H. Macklin, S.J. from the Stonyhurst College Observatory on the same day (from Cortie, 1921).
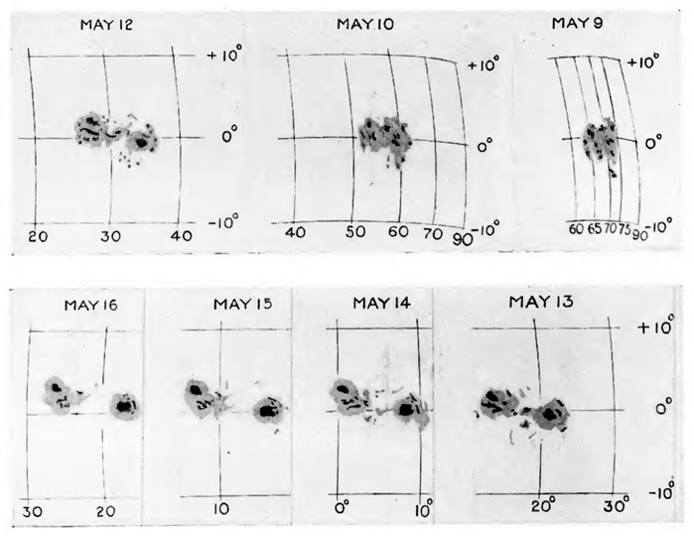
The drawings above illustrate the development and evolution of the sunspot group, for the period of 9 till 16 May 1921. They are accurate copies of the drawings made by the Rev. H. Macklin, S.J. from the Stonyhurst College Observatory (Cortie, 1921).
