
During the first two months of 2013, quite a few Coronal Mass Ejections (CMEs) were visible. As an example, this movie shows the CME-activity from 23 till 28 February. The 10 most interesting events were numbered and are discussed below.
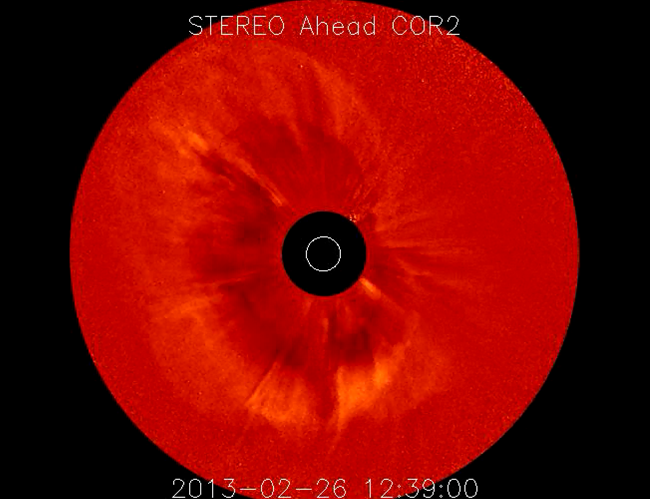
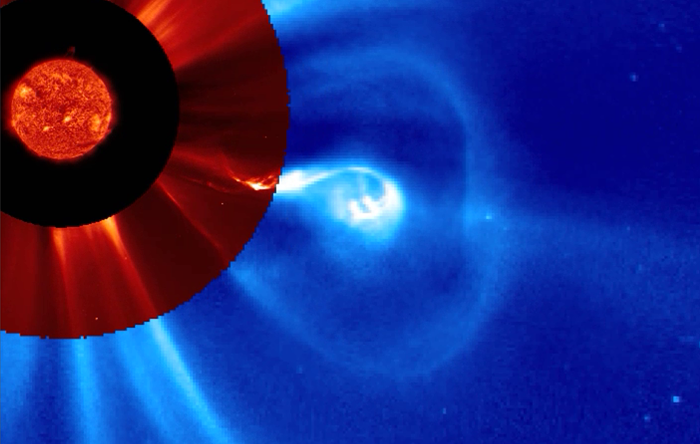
Two CMEs in this list are particularly noteworthy. The first (number "6") occurred during the morning hours of 25 February and was related to flaring activity in active region NOAA 1678 (backside event). As seen from STEREO-A, it concerned a halo CME (see image above). The second CME (number "8") happened a day later during the spectacular eruption of a massive filament near the southwest solar limb (see image below).
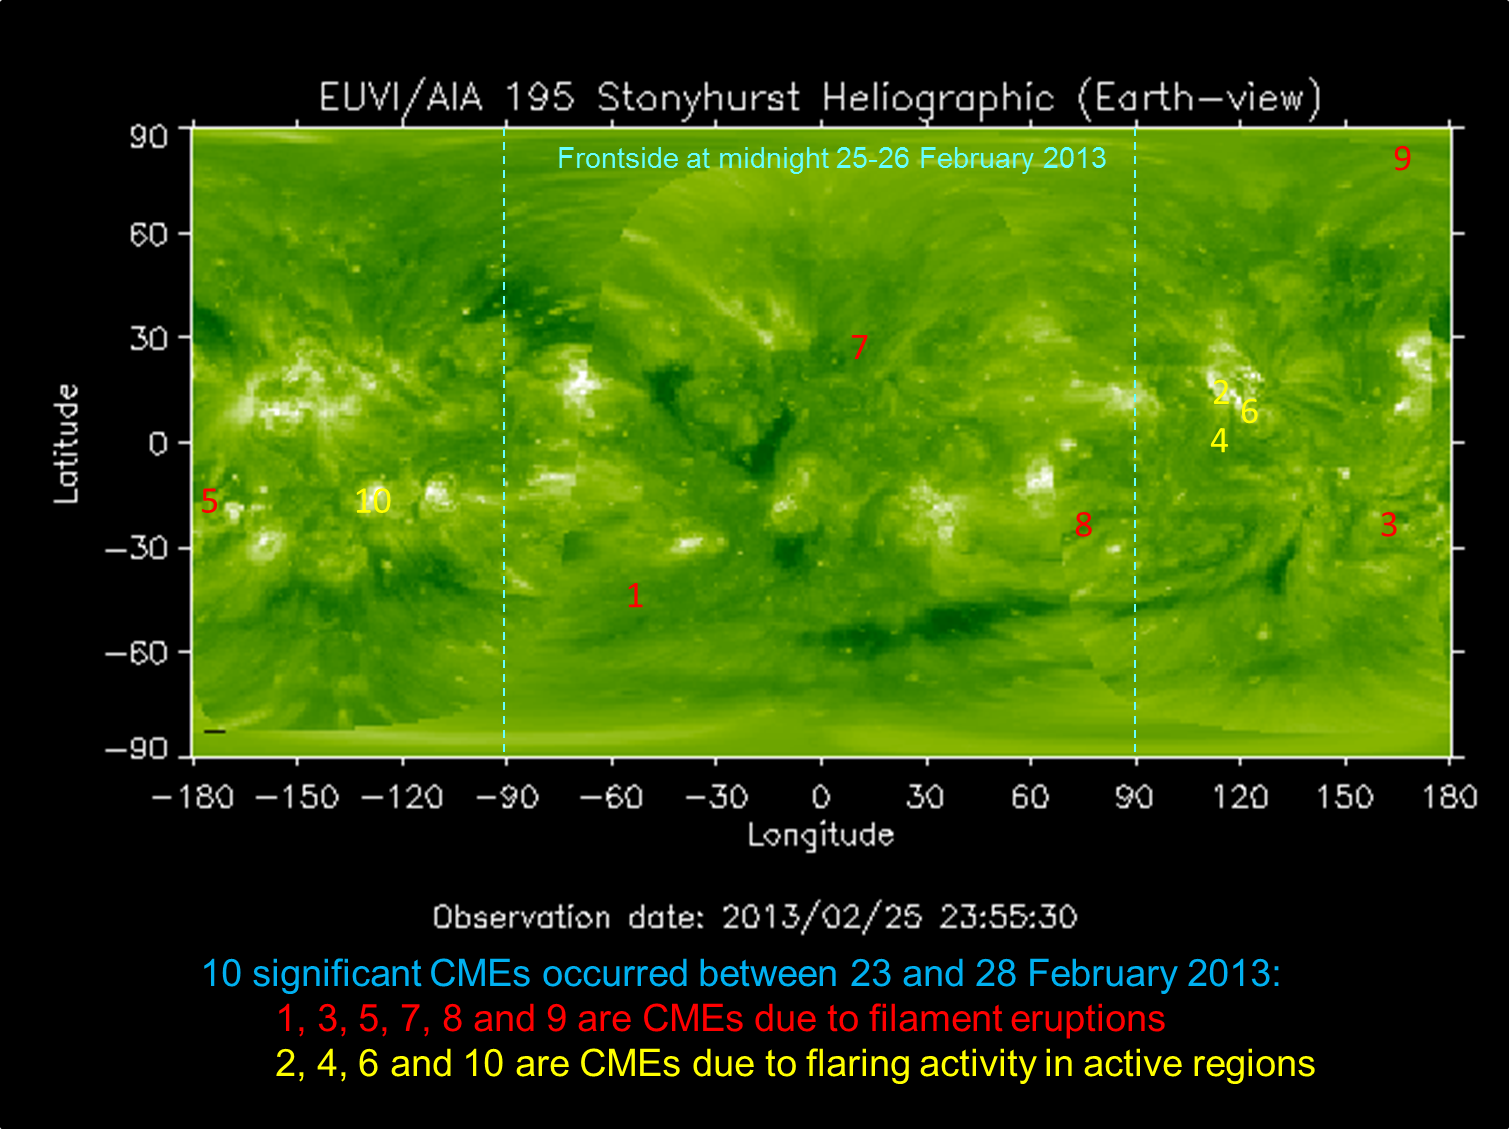
It's always nice to try and find the source region of the CMEs. With STEREO-A and -B, SOHO and SDO keeping a permanent eye on the entire Sun and its surroundings, this is not such a challenging task. As it turns out, 6 of the 10 CMEs were due to filament eruptions, while the other CMEs were associated with flaring activity in active regions NOAA 1678 and 1685. Also, as seen from Earth, most of the CMEs originated near the solar limb or on the backside of the Sun.
The 10 source regions were plotted in the heliographic map underneath. These maps are compiled from STEREO and SDO imagery, and provide an overview of the entire solar surface in EUV. Only the area between -90° and +90° can be seen from Earth. As the Sun rotates, other heliographic longitudes become visible (here: moving from left to right). Red numbers indicate CMEs from filament eruptions, yellow numbers indicate CMEs from flaring activity in active regions (bright). Notice in the second movie how the use of the different satellites reveals how all this activity is happening all over the solar surface.
Credits - Images and movies for this topic were taken from SDO, SOHO/Lasco, the STEREO spacecraft, and GOES-15/SXI.
 |
 |
