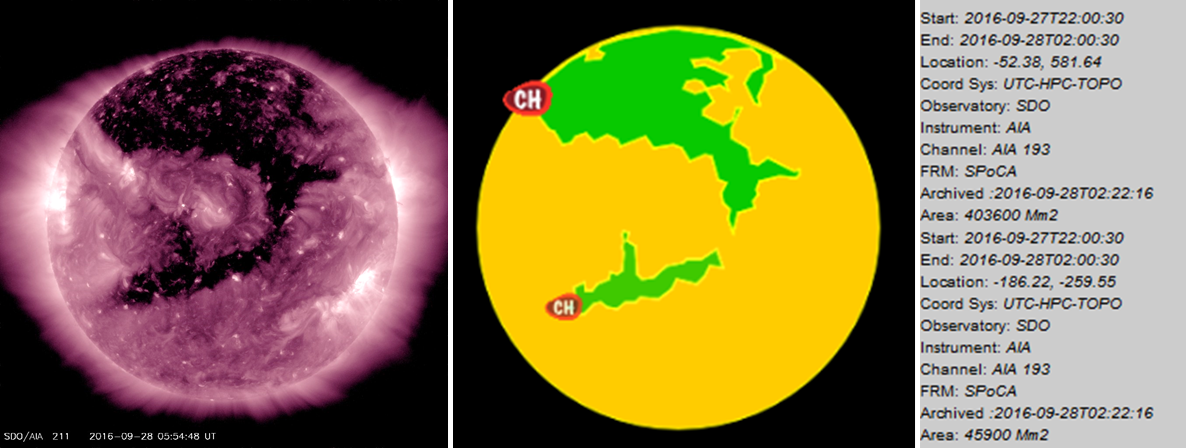
A huge trans-equatorial coronal hole (CH) is transiting the solar disk. According to the latest data from LMSAL/SPOCA (28 September), the total coronal hole area is the equivalent of about 880 times the total surface area of the Earth. It is by far the largest CH since the last solar cycle maximum, even dwarfing the large southern polar CH from late 2014 - early 2015 (see the 2014 space weather highlights).
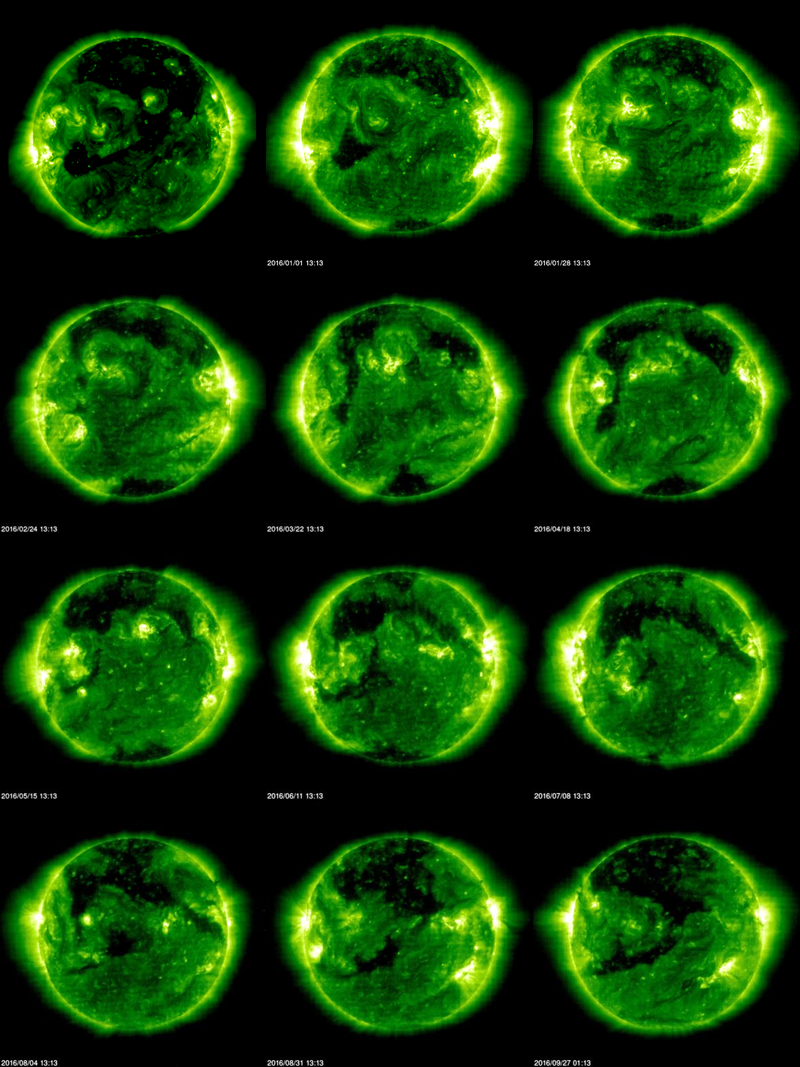
This coronal hole has been around for quite a while now, and has been showing a considerable variation in size and outlook. The main part started to grow from the northern solar pole already during the summer months of 2015, then gradually developing some equatorwards extensions and interacting with more fleeting, smaller equatorial CHs. This can be seen in the collage underneath showing an extreme ultraviolet image of the Sun made by SOHO/EIT 195. It spans the period from 5 December 2015 till 27 September 2016, with one image every 27 days (Bartels solar rotation). It also shows how the first few months of 2016, the full extent of the CH is somewhat hidden as the Sun's north pole is turned away from the Earth. Then, starting the summer months, the north pole is gradually turning again towards Earth showing the behemoth CH in all its glory. Notice also the similarity in outlook between the December 2015 and September 2016 images, and the changes in between.
The changing appearance of the CH also explains the varying geomagnetic influence that the associated wind speed streams have, both in starting time, duration and intensity. This can be seen in the graph underneath, running from 1 January 2015 (top left) till 27 September 2016 (last colored square). For each day, it displays the maximum recorded 3-hour Kp index (see this news item for more information) as obtained from the Kyoto World Data Centre, with preliminary data from NOAA/SWPC for the second half of September 2016. Days with quiet to unsettled geomagnetic conditions got a green colored square, active days an orange square, and minor to major storming levels are indicated by red squares. The purple squares represent the two strongest storms so far this solar cycle on 17 March and 22-23 June 2015 (severe storming), both caused by coronal mass ejections (CMEs). The data are again depicted in series of 27 days (Bartels rotation), with the start day indicated on the left. The black line in the middle reflects the transition from 2015 to 2016.
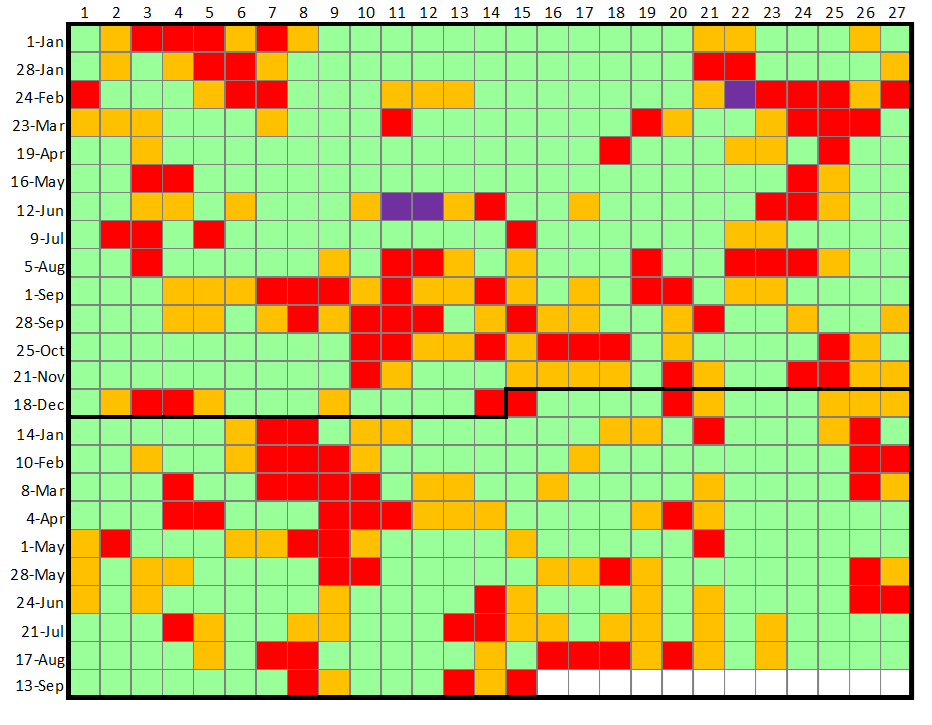
As expected from the above analysis, the influence of the CH wind stream is indeed not a nice reoccuring event starting every 27 days on the same day, or having the same duration and intensity. For example, the December 2015 transit gave only rise to active geomagnetic conditions. Then, for several months, no geomagnetic disturbance at all was detected from this CH (the 1 January storm was due to a CME). Starting during the summer months, as the CH was widening and gradually being inclined again towards Earth over subsequent transits, first active conditions were recorded giving gradually way to geomagnetic storming that lasted for several days. This is also the case during this transit, with several days of geomagnetic storming observed and moderate storm levels reached on 27 September. Disturbed geomagnetic conditions are expected to continue for the next few days.