
The low solar activity of the last few months does not only manifest itself in many spotless days and significantly reduced flaring activity, it is also noticeable in the number of observed coronal mass ejections (CMEs). A CME is an ejection of charged particles ("plasma") from or through the solar corona, often -but not always- as a result from eruptive processes on the Sun. If such particle clouds impact Earth, they can result in significant geomagnetic storms.
As we are heading for the next solar cycle minimum and solar activity continues to decrease, it comes as no surprise that we are observing only very few CMEs. This was also true for the month of March 2018, with just a handful of CMEs recorded by the coronagraphs from the SOHO spacecraft. A coronagraph is an instrument that creates a permanent artificial solar eclipse such that the immediate surroundings of the Sun can be observed and any ejected plasma cloud (= CME) is detected.
Some of these disturbances are weak, so the very handy CACTus tool was developed to help with the identification and typical characteristics of a CME, such as its plane-of-the-sky speed and width. CACTus is short for "Computer Aided CME Tracking", the "us" was conveniently added by a creative mind. Developed by the SIDC (Solar Influences Data analysis Centre) during the early years of the 21st century, the tool automatically detects CMEs in SOHO's coronagraphic imagery and quickly provides a list of the CMEs, much faster and more objectively than a human operator can.
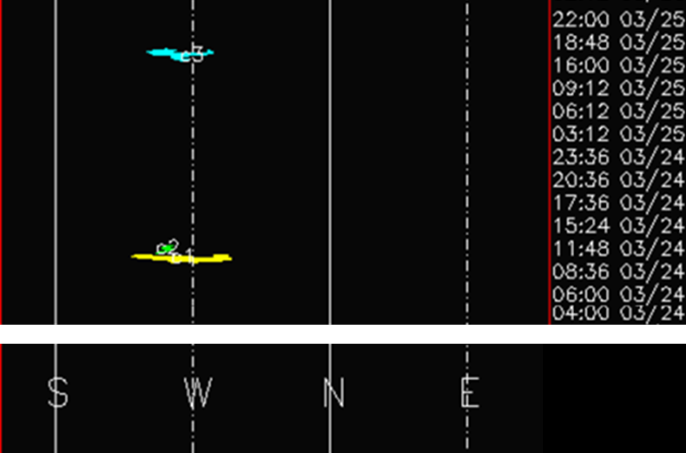
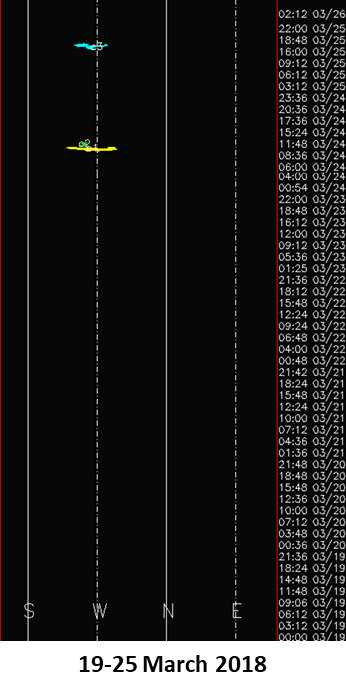
An example of the CACTus output showing CME activity for the entire week of 19 till 25 March 2018 can be found underneath, as well as a close-up for 24-25 March (above). Note time is running vertically (upward), and the horizontal axis gives the position/width in a counter-clockwise direction (south-west-north-east) along the solar limb. The CMEs are the coloured irregular lines ("wrinkles"), the colours being added to more easily distinguish the various CMEs. Only 2 (two) CMEs were detected over the entire week, both of them being small and ejected to the west and away from Earth. The 24 March CME is also shown in the imagery above.
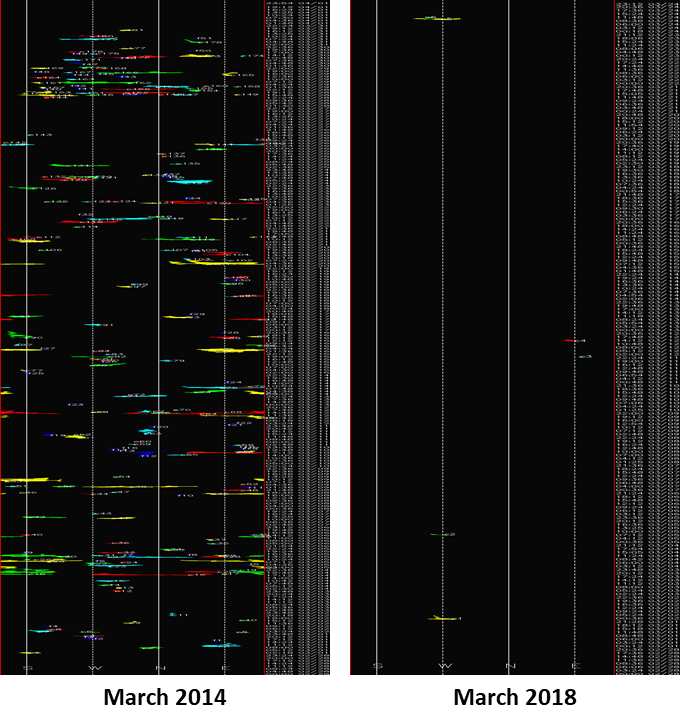
Two is obviously not an impressive number, and it's getting even worse when one looks at the entire month of March (graph underneath, right). So far, i.e. until 24 March, only a handful of CMEs have been detected! Going back just 4 years to March 2014, CACTus paints us an entirely different picture (graph underneath, left). Solar Cycle 24 (SC24) was near its maximum and so was solar activity. CMEs were abundant, with no less than 181 events reported! This means on the average about 6 CMEs *daily*, almost the number that has been observed over the entire month of March 2018! Needless to say, space weather forecasters had their hands full at that time determining whether or not these CMEs were going to impact Earth, and when and how intense the strike would be. Ah, those were the days!...
Further reading:
- Robbrecht, E. and Berghmans, D., Automated recognition of coronal mass ejections (CMEs) in near-real-time data, A&A 425, 1097-1106 (2004)
- More info on and results from CACTus are at this link , with the latest CME detections here.
- CACTus results for imagery from the STEREO coronagraphs can be found on this page.
