
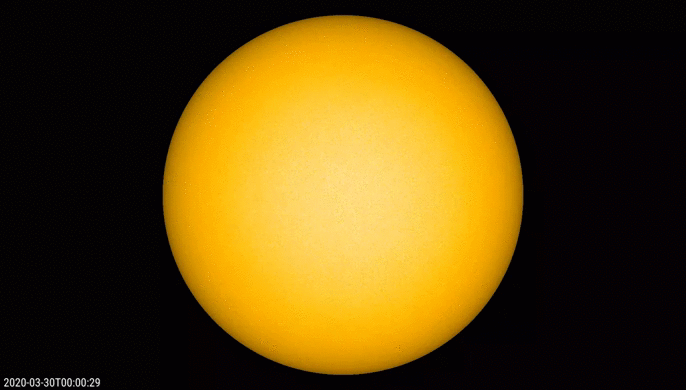
NOAA 2759 was a small sunspot group that appeared on 30 March near the northeast limb. Based on its magnetic configuration and its high latitude (+28 degrees), it belonged to the new solar cycle 25 (SC25). See this STCE Newsitem for more info on magnetic polarities and on how to identify to which solar cycle a sunspot group belongs. The SDO/HMI imagery underneath first shows the (full disk) evolution of the sunspot group as it transits the solar disk from 30 March till 07 April, followed (zoom) by a comparison between white light image and the magnetogram of the region for the period from 31 March till 06 April.

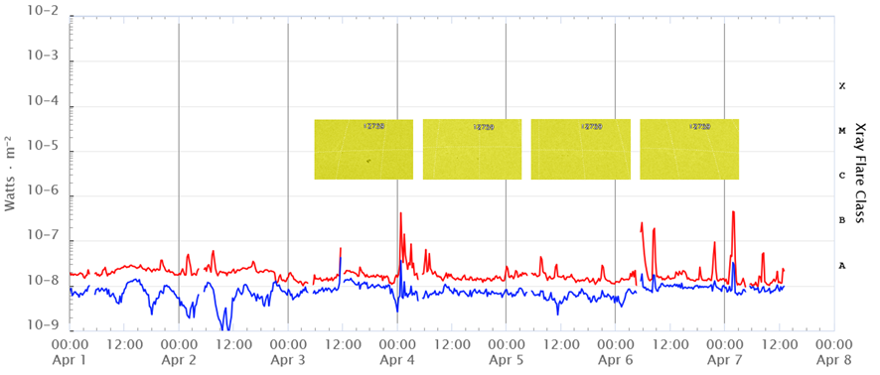
As is normal for such a small and simple group, it did not produce significant flaring. In fact, the group was already decaying when it produced the first two of a total of 5 B-class flares (so far). Overlaid on the GOES x-ray flux (red curve) for the period from 1 till 7 April, are 4 close-ups of NOAA 2759 from 3 till 6 April, each around 18UT. One can clearly see the group decaying on 4 April, and it was basically spotless from 5 April onwards as reported by the SILSO network. It's interesting to note that the last 3 B-class flares, i.e. the ones on 6 and 7 April happened when the sunspot region was already spotless.
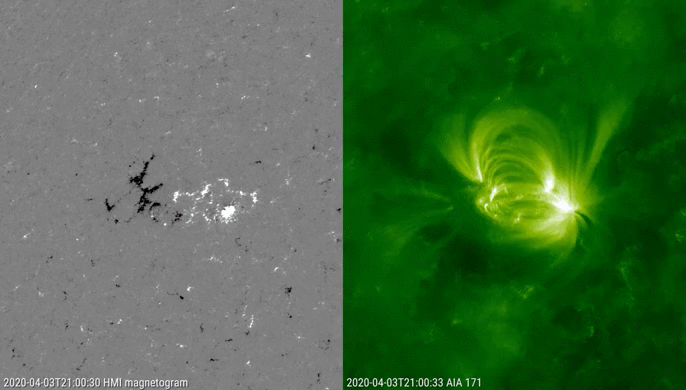
Late on 3 April, a small bipolar region can be seen emerging in the trailing ("left") portion of NOAA 2759. This area of mixed magnetic polarity is the source of 2 B-class flares early on 4 April: A B4.2 peaking at 00:52UT and a B1.4 at 01:38UT. The images underneath combine a magnetogram on the left and an extreme ultraviolet (EUV; SDO/AIA 171 at temperatures around 700.000 degrees) image on the right running from 03/21UT till 04/05UT April.
By 6 April, the region was virtually spotless. Two B-class flares were the result of instabilities in the group filament, that can be seen running along the polarity inversion line (PIL), i.e. the line marking the border between the two main areas of opposite magnetic flux. The images underneath combine a magnetogram on the left and an EUV image (SDO/AIA 193 at temperatures around 1.250.000 degrees) on the right running from 06/03UT till 06/11UT April. The flares peaked at 05:48UT (B2.5) and at 08:31UT (B1.8). The filament was not ejected, as no coronal mass ejections observed in SOHO and STEREO-A coronagraphic imagery.

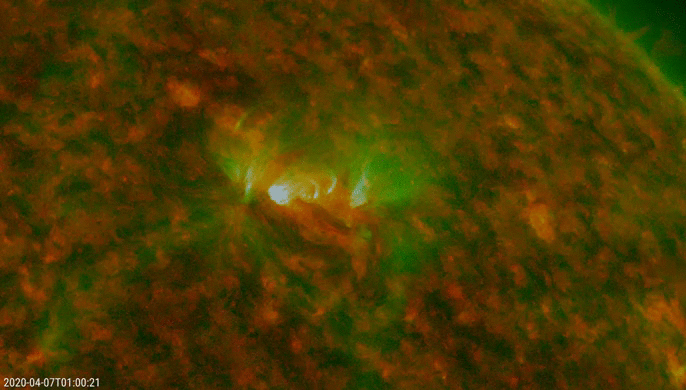
One day later, the strongest of the 5 B-class flares took place, i.e. a B4.5 peaking at 01:59UT. The images underneath combine a magnetogram on the left and an EUV image (SDO/AIA 304 at temperatures around 80.000 degrees) on the right running from 06/22UT till 07/06UT April. Again the eruption took place along the PIL, and also here no CME was observed. The last clip is a combination of SDO/AIA 304 (red channel) and SDO/AIA 171 (green and blue channel) over the same timespan, highlighting the dynamics along the PIL during the eruption as well as the post-flare coronal loops about an hour after the flare peak.

For this article, data and imagery were taken from SDO , SWPC/GOES , Solar Monitor , SILSO , SOHO , STEREO-A , and CACTus. The movies were created with JHelioviewer.
