
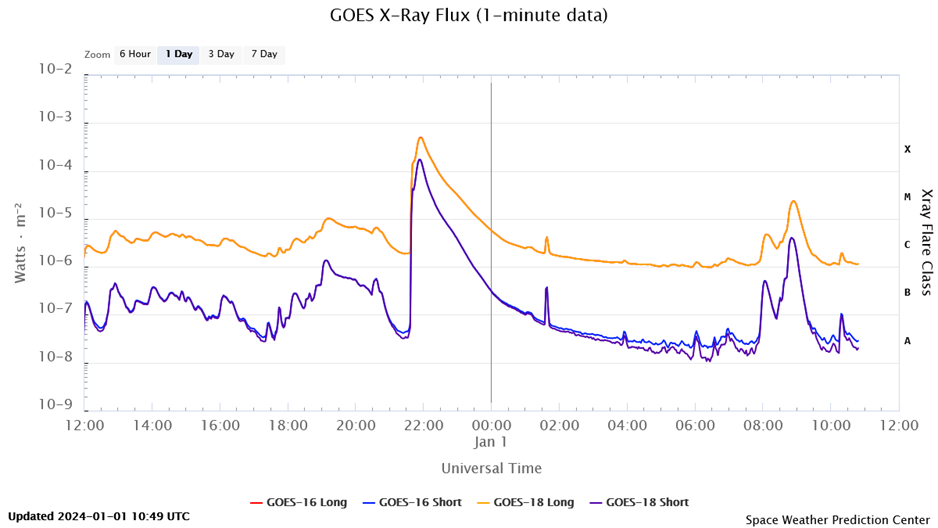
The X5 flare that took place on 31 December has been discussed earlier in this newsflash. The graph underneath shows the evolution in soft x-rays of the event (GOES). This is the strongest solar flare so far this solar cycle, and the strongest since the X8.2 event (rescaled X11) on 10 September 2017 and the X9.3 flare (rescaled: X13) from 6 September 2017.
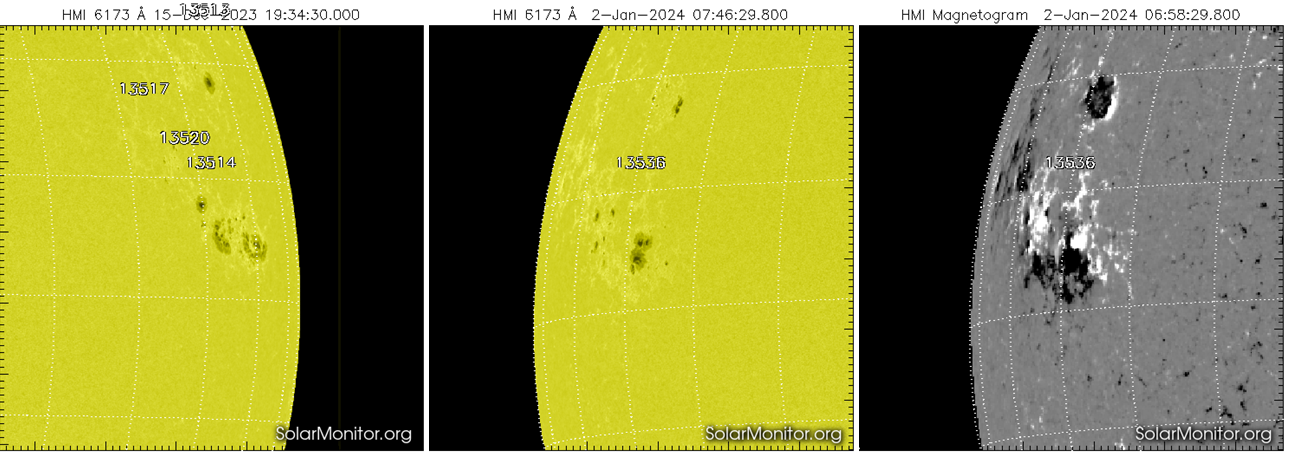
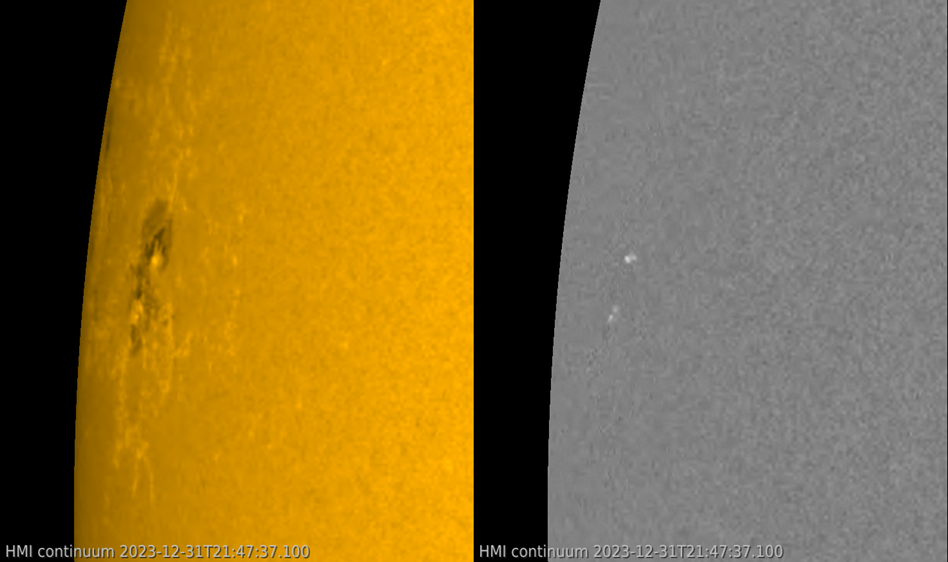
The source of the event was active region NOAA 3536, which is situated approximately at the same location as that of NOAA 3514, the sunspot group responsible for the previous record of strongest flares in this solar cycle (SC25), producing an X2.8 flare on 14 December (see this newsitem). It is unclear if NOAA 3536 is the further development of old NOAA 3514, or a new region that has developed near the same location. H-alpha images indicate that the X5 flare was produced by the main leading spot of NOAA 3536. This sunspot contained a magnetic delta, i.e. sunspots of opposite magnetic polarity within the same penumbra. This delta structure now seems to be gradually dissolving, i.e. the sunspots of opposite polarity are now in separate penumbra, but they remain close enough to each other that there's still a chance on further significant flaring from this region. The SDO images underneath show the active regions on 15 December and 2 January in white light, with a magnetogram showing NOAA 3536's delta configuration early on 2 January to the right.
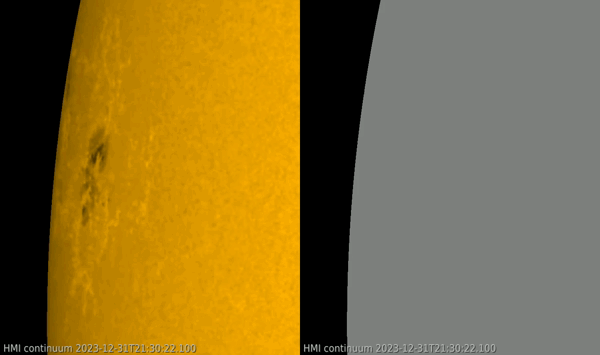
SDO white light imagery also shows that the flare was visible in white light. Such a "White Light Flare" (WLF) is a rare event indeed (discounting satellite observations), reserved only to very strong flares such as the Carrington event in 1859 or the Halloween flares in 2003. Compared to those events, the 31 December WLF was only a faint one. Also, satellites are located far above the Earth's atmosphere, and as such have of course a much crisper view than observers on the ground. Moreover, the flare occurred during daylight over the Pacific Ocean, where there are not many observers to watch the brief event. The SDO images underneath show the WLF in white light (left) and difference images -one image subtracted from the next- are on the right.
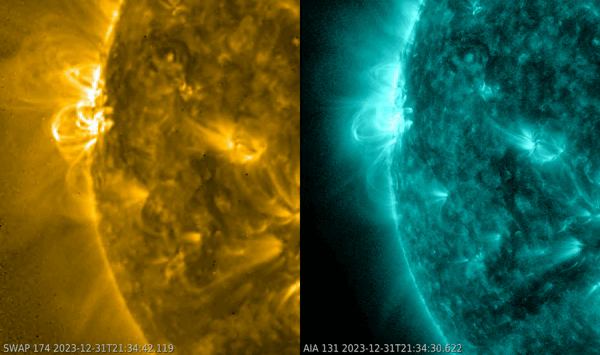
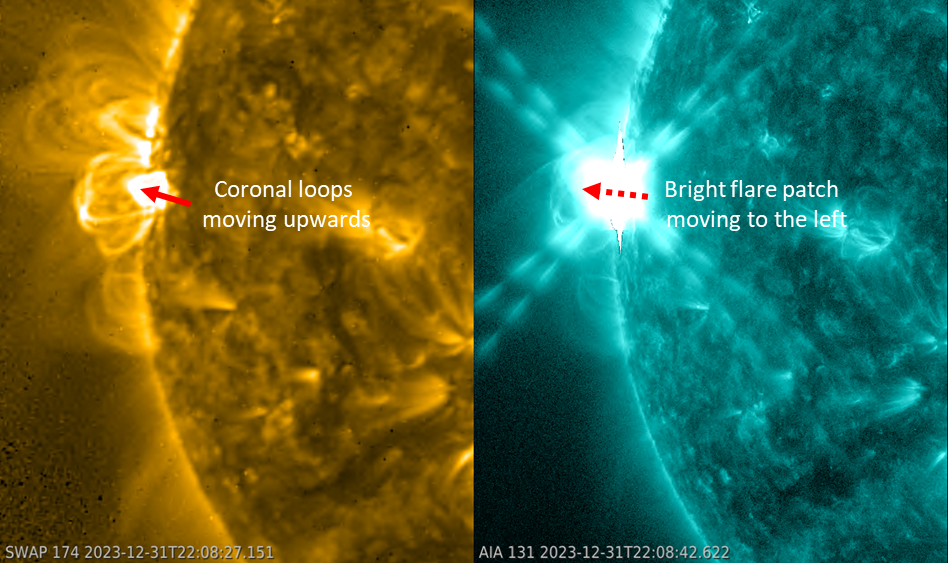
Many of the SDO images show "streaks" around the flaring site at the time of flare maximum brightness. These blooming and diffraction patterns are image (camera) artefacts, and are not related to the flare itself. One can also see the bright patch of the flare moving very gently to the left. This is mostly due to the oblique angle from which the flare is seen from Earth, and at the same time the expanding (both in altitude as away from the magnetic neutral line) post eruption coronal loops (PROBA2/SWAP image on the left). The brightest/hottest portions of the flare are indeed at the top of these loops (closest to the point of magnetic reconnection which is moving upward - sketch) and at the footpoints of the coronal loops where the accelerated particles crash into the lower solar atmosphere (see e.g. Oka et al. 2018 - Figure 5). The latter phenomenon is actually responsible for the white light emission that could be seen during this flaring event.
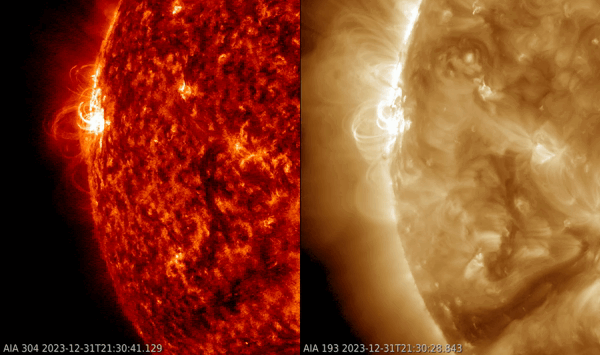
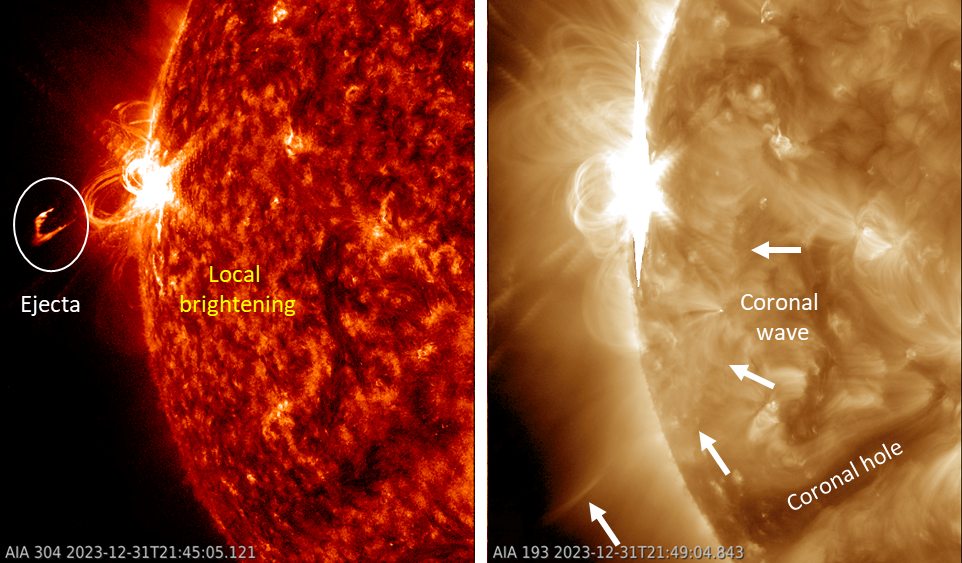
Images in extreme ultraviolet (EUV) show the ejection of material during the flare, as shown in the annotated image underneath. Other passbands show a disturbance moving away from the blast site. This is called a coronal wave (or EIT wave), and is associated with coronal mass ejections (CMEs). The images underneath are from AIA 304 (at temperatures of 80.000 degrees) on the left, and -4 minutes later- from AIA 193 (temperatures of around 1.25 million degrees) on the right. Note how some regions in the solar corona brighten as the coronal wave passes by (maybe a result from induced local magnetic reconnection), and its crashing into the magnetic wall formed by the open magnetic field lines from a coronal hole (annotated image).
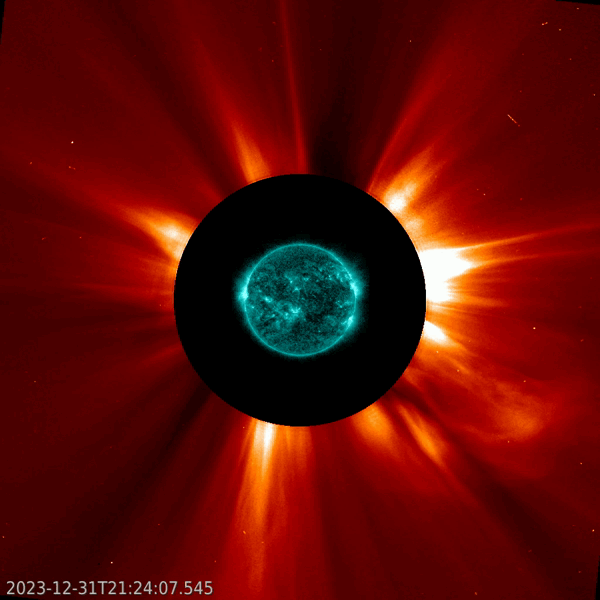
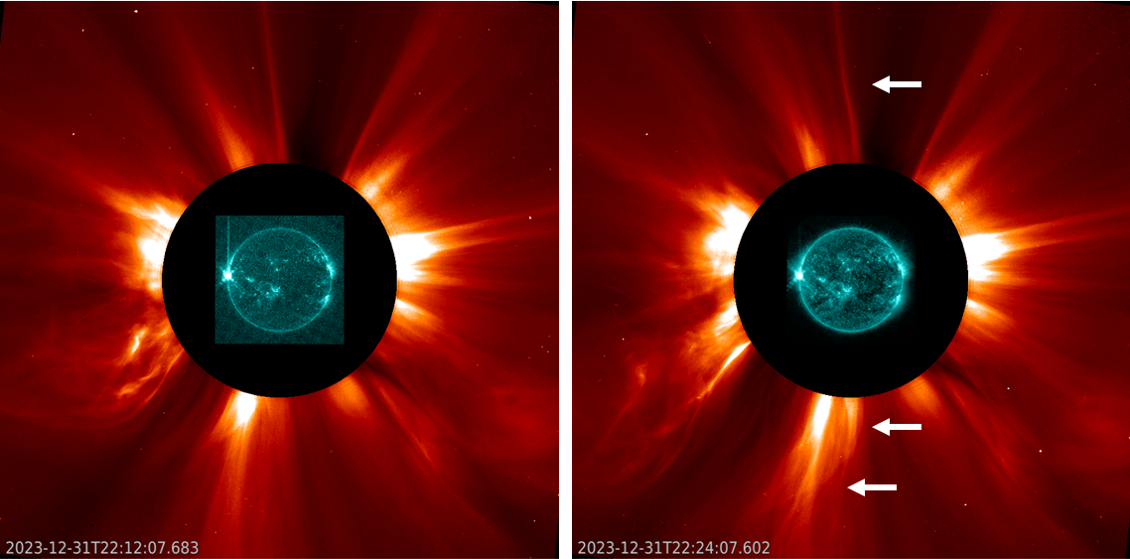
The associated CME was a partial halo CME with a width of around 200 degrees, affecting coronal streamers at both the Sun's north and south pole as indicated on the SOHO/LASCO C2 image - see the clip underneath. Its speed was calculated to be around 2400 km/s. On the SCORE scale (Evans et al. - 2013), this would classify as a "Rare" event, meaning CMEs with such a speed are seen on the average only once every year. Note that the "E" in SCORE stands for extremely rare, for CME speeds of 3000 or more km/s. Such CMEs are seen on average less than once in a solar cycle. The bulk of the CME was directed away from Earth, but the CME was thought to have an earth-directed component. A weak shock in the solar wind was observed on 3 January at 04:51UTC, with wind speed jumping from 410 to 450 km/s. This shock was most likely the expected glancing blow from the 31 December CME, though there are other CME candidates. If this is indeed the CME associated with the X5 event, its arrival was later than expected and probably due to a denser and more slowly moving solar wind than expected in front of it. Geomagnetic activity remained well below storm levels.
