With another strong geomagnetic storm that has occurred just a week ago, one might wonder how unusual geomagnetic activity has been so far this solar cycle (SC25). To properly evaluate this, we can take a look at the most often used geomagnetic parameter, i.e. the Kp index. The Kp index ("planetarische Kennziffer") is a 3-hourly geomagnetic range index averaged from the *standardized* local K indices of 13 contributing subauroral geomagnetic observatories worldwide (list at ISGI). It was introduced by Bartels in 1949 (The standardized index Ks and the planetary index Kp, IATME Bulletin 12b, 97), and extended further back in time to 1932. The final 3-hourly and daily Kp indices are compiled by GFZ Potsdam and expressed in thirds, from 0o, 0+, 1-, ... to 9-, 9o. The scale has an upper-boundary, i.e. no matter how large the geomagnetic variation is, Kp will never exceed 9o. The values are archived at the World Data Center for Geomagnetism at Kyoto (WDC Kyoto).
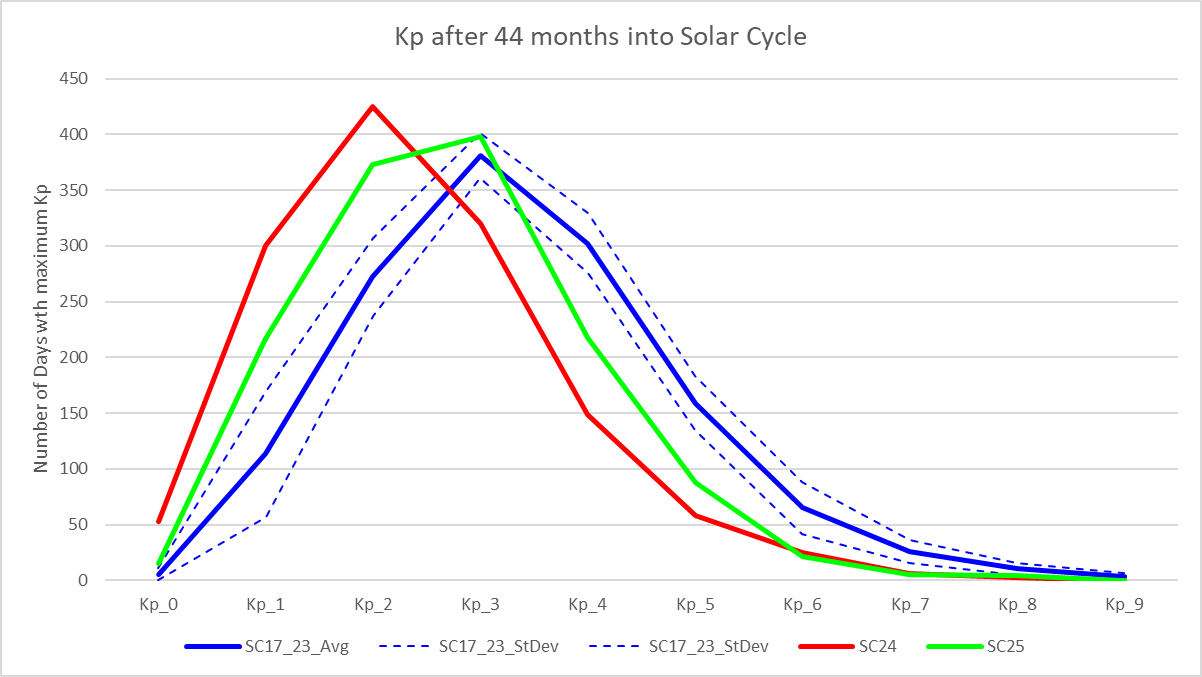
From October 1933, the onset of solar cycle 17, to the last full month of data (August 2023), the maximum 3-hourly Kp index was determined for each day from the WDC Kyoto data. As SC25 was 44 months "old" last August, the days were then summed and binned per Kp value (0o, 0+, 1-, ... to 9-, 9o) and this for the first 44 months of each solar cycle. Then, these totals were combined to integer Kp values, e.g. Kp = 0 is the sum of the values for Kp = 0o and Kp = 0+. For SC17 to SC23, these values were then averaged and a standard deviation calculated. These are respectively the thick and dashed blue lines in the graph underneath. The values for the previous SC24 (in red) and ongoing SC25 (in green) are shown separately. It now becomes clear how weak the previous solar cycle was in terms of geomagnetic activity, with a peak at Kp = 3 instead of the long-term average peak near Kp = 4. SC25 is geomagnetically stronger than SC24, with the peak now back at Kp = 4. It is nonetheless clear that there's still an abundance of weak geomagnetic days (Kp = 1, 2 or 3) compared to the long-term average, as the green line is well above the long-term average, even including the standard deviations. It is an underachiever when it comes to active conditions (Kp = 4) and geomagnetic storming (Kp values of 5 and higher), as the green line is well below the long-term average (blue). For moderate to extremely severe geomagnetic storming, SC24 and SC25 are almost each other's twin. The general conclusion is that SC25 has been geomagnetically stronger than SC24 so far, but is still well below the average geomagnetic activity produced during SC17-23.
That being said, let's take a look at the intensity of the geomagnetic storms, as the maximum Kp has an upper-boundary of 9o. For this, we can use the Disturbance storm-time index Dst (Sugiura, 1964). This geomagnetic parameter is designed to measure the magnetic signature of magnetospheric currents, in particular -but not restricted to- the ring current. Dst is computed using 1-hour values of the horizontal H-component by four low latitude observatories (list at ISGI) sufficiently distant from the auroral and equatorial electrojets to inhibit noise from these two sources. The values are expressed in nT and mostly negative in case of a strong geomagnetic disturbance, as the enhanced ring current tends to counteract (weaken) the Earth's magnetic field. The Dst index is available from 1957 onwards and is derived and maintained by the World Data Center for Geomagnetism at Kyoto, Japan (WDC Kyoto).
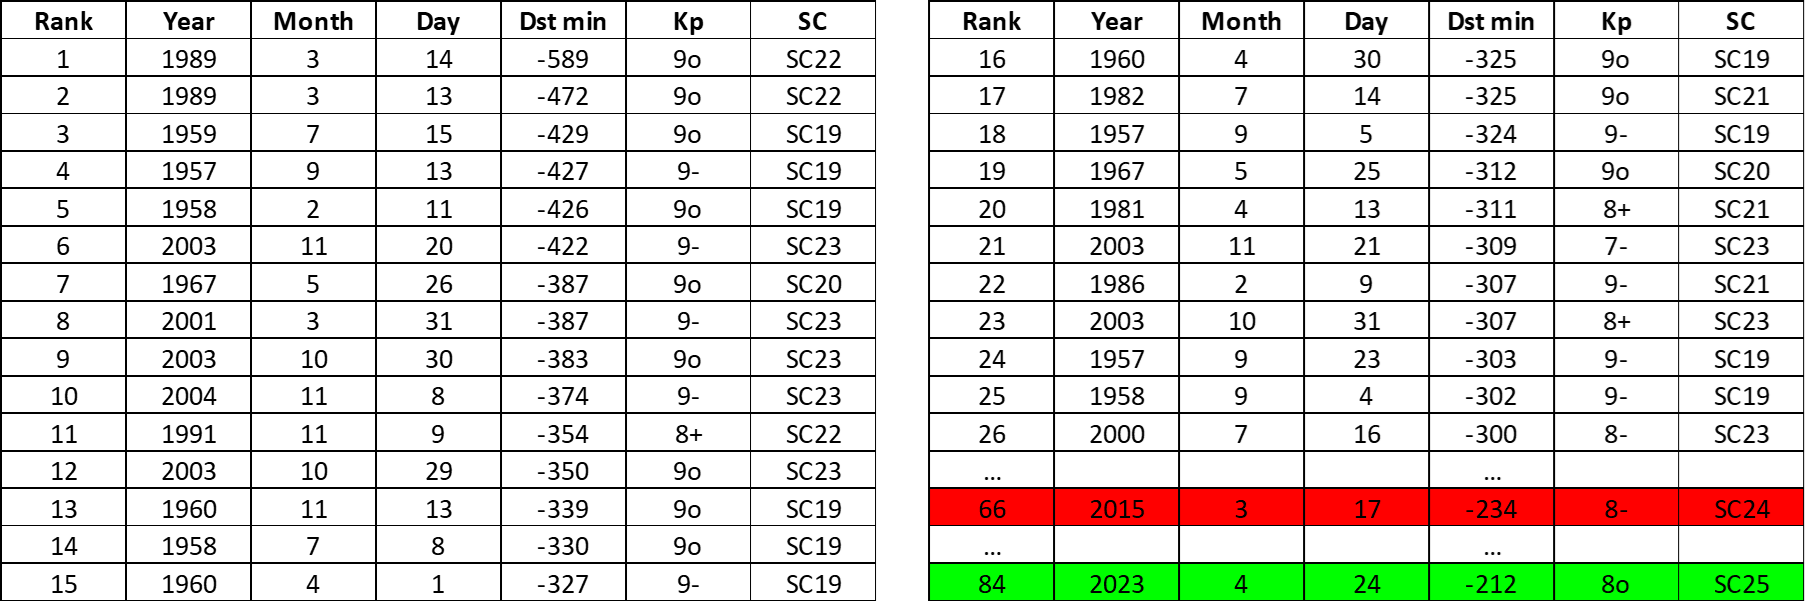
The table above gives all days with a minimum Dst of less than -300 nT, ranked by their intensity, and this since the records began early 1957. The value of -300 nT was chosen simply to avoid too large a table. Also the maximum Kp for that day has been added. There are no surprizes, with the famous March 1989 geomagnetic storm being the strongest of the last 65 years. Of the 26 days with a Dst equal to or less than -300 nT, 12 had an associated Kp of 9o, and 9 had a Kp of 9-. From the Kp point of view, there were 19 days with a Kp = 9o, 12 of which had an associated Dst of less than -300 nT and another 5 with a Dst between -250 and -300 nT. So, there's in general a good agreement between days with the strongest Kp (9o) and the strongest, most negative Dst (-300 nT or less). Some of the differences result from the interplanetary coronal mass ejection arriving by the end of a day, with Kp measuring immediate changes in the geomagnetic field, whereas the Dst index is influenced by the response from the ring current, reaching its minimum usually a few hours later. This may then be the next day, thus resulting in some day-to-day differences. Important also is that Dst and Kp are measuring influences from different geophysical sources. For example, the geomagnetic storm associated with the famous Apollo event in August 1972 reached a Kp of 9o, but a Dst of only -118 nT. In the table, the dominating presence of SC19 is noteworthy, representing about 36% in both listings. SC24 and SC25 are far behind. The highest entry for SC24 ranks only 66th in the Dst list and concerns the St-Patrick's day storm of 17 March 2015. SC25 has -so far- its highest entry ranked 84th, but of course it still has to go through most of its maximum and the whole declining phase, so there's a good chance it may produce stronger geomagnetic storms in the coming years.