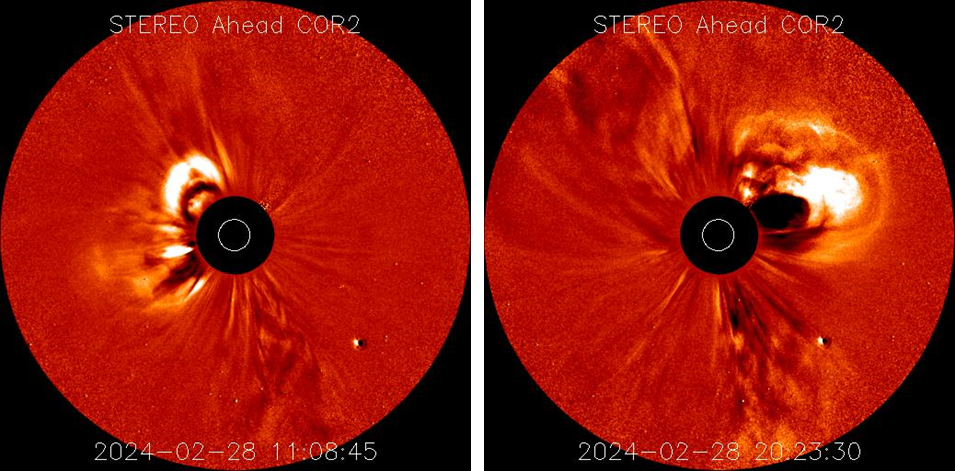
Despite the strong solar activity over the last few weeks, the geomagnetic activity did not follow suit. In contrast to all the X-class flaring and high sunspot numbers, the level of geomagnetic activity stayed at or below active conditions (Kp at or less than 4; see the STCE SWx classification page). This changed when some run-of-the-mill solar eruptions were observed on 28 February. The resulting coronal mass ejections (CMEs), one to the southeast and one to the northwest, are shown in the coronagraphic imagery underneath (STEREO-A). With speeds of 500 to 700 km/s (CACTus), they were certainly not excessively fast, but their location and associated width made forecasters (SIDC) believe that one or maybe both had an earth-directed component, due to deliver a glancing blow to the earth environment around 3 March.
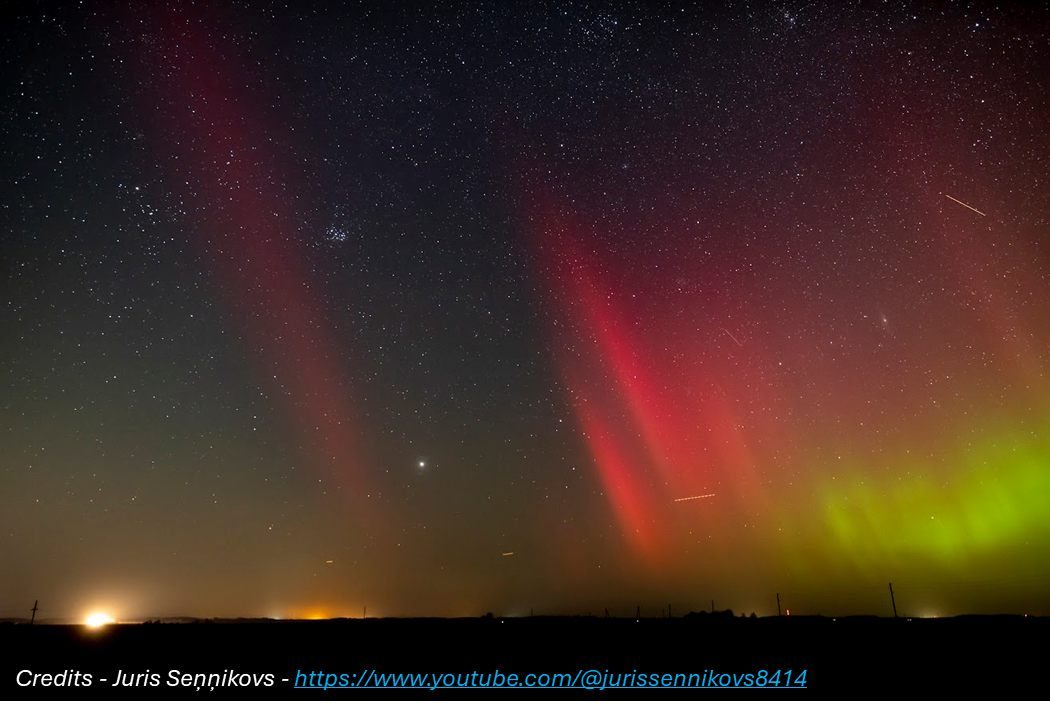
That forecast was spot on, with the arrival of the CME observed around 08:45 UTC on 3 March by DSCOVR. The resulting geomagnetic storm reached moderate levels (Kp = 6-) during the 18-21 UTC interval, and the preliminary Dst index (Disturbance storm-time) was at -115 nT. We have to go back all the way to early December last year to find a geomagnetic storm of comparable strength. Polar lights were photographed as far south as Buxton (Peak District, United Kingdom) and Lower Saxony in Germany (Spaceweather.com). The amazing picture underneath was taken by Juris Seņņikovs from Latvia, showing a Stable Auroral Red arc (SAR arc - see this STCE Newsitem) and the polar lights in their full glory late on 3 March. There's also an associated clip on Juris' YouTube channel showing the spectacular evolution of the aurora.
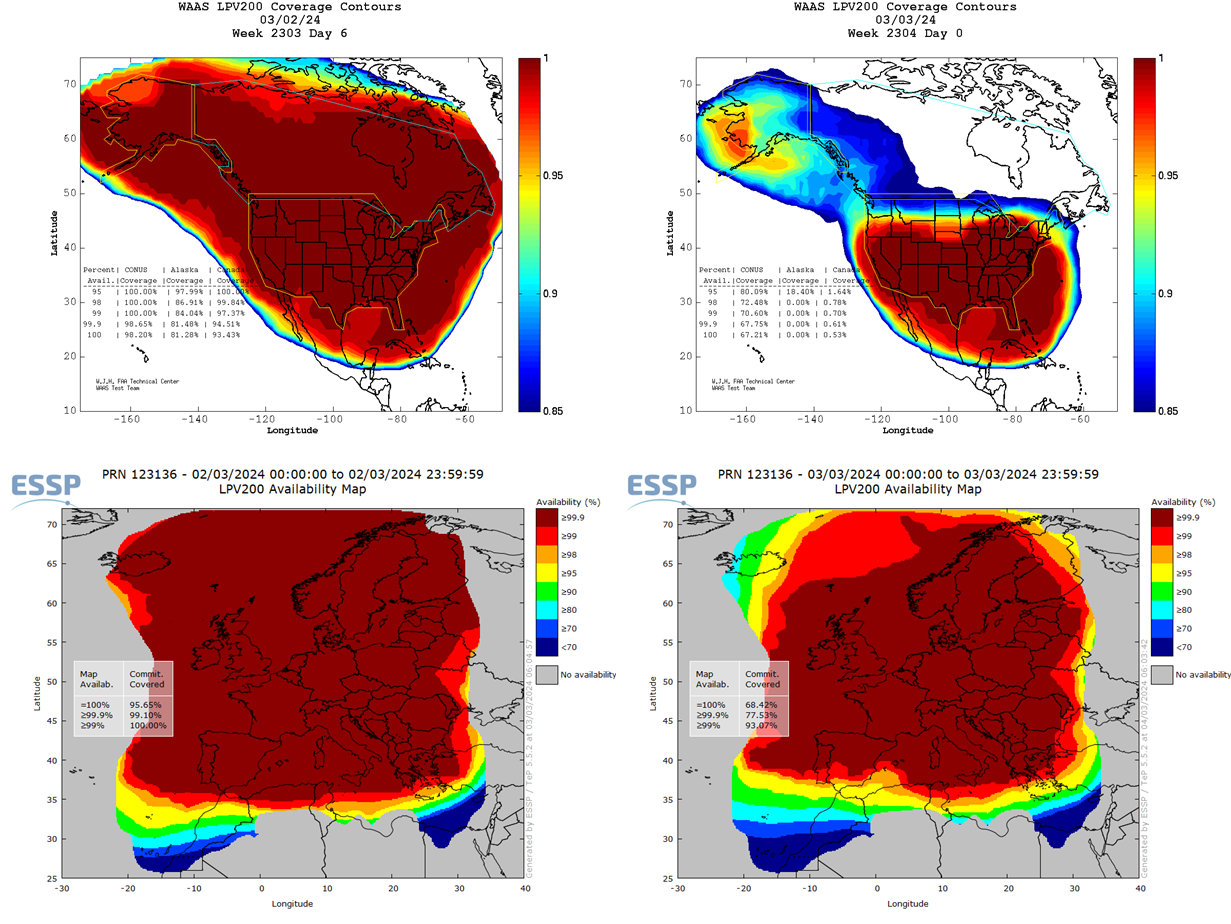
Other impacts from this moderate geomagnetic storm were limited. Geomagnetically induced currents (GICs) were recorded in e.g. Canada (NRCan) and along the Finnish-Russian border (EURISGIC). However, the recorded values were on the average a factor 5 to 10 smaller than those observed during the 23-24 April 2023 storm, which was the strongest so far this solar cycle. The geomagnetic storm disturbed the Earth's ionosphere and as such also affected High Frequency communications (HF Com ; 3-30 MHz) and satellite signals (PECASUS/Civil aviation). There was a so-called "Post-Storm Depression" of the HF frequencies, meaning that the availability of the upper frequencies of the HF band were significantly reduced during the last few days. The disturbed ionosphere also affected Global Navigation Satellite Systems (GNSS) based applications for the civil aviation. As can be gauged from the imagery underneath covering 2 and 3 March, some of these applications did not reach their typical availability over Europe (EGNOS) and North-America (WAAS) while the 3 March geomagnetic storm was ongoing. Red/brown colours mean good availability, blue means significantly degraded availability. LPV-200 (Localizer Performance with Vertical guidance) delivers accurate information on an aircraft's approach to a runway with the use of GNSS positioning technology. The result is lateral and angular vertical guidance without the need for visual contact with the ground until an aircraft is 200 feet (60 meters) above the runway (see EUSPA). Clearly, this GNSS application was significantly reduced over Iceland, Canada and Alaska on 3 March.