- Table of Content
- 1.Ten years of J...
- 2.Sun, satellite...
- 3.Review of sola...
- 4.PROBA2 Observa...
- 5.The Internatio...
- 6.Review of geom...
- 7.Geomagnetic Ob...
- 8.The SIDC Space...
- 9.Review of iono...
2. Sun, satellites and planes
3. Review of solar activity
4. PROBA2 Observations (5 Oct 2020 - 11 Oct 2020)
5. The International Sunspot Number by Silso
6. Review of geomagnetic activity
7. Geomagnetic Observations at Dourbes (5 Oct 2020 - 11 Oct 2020)
8. The SIDC Space Weather Briefing
9. Review of ionospheric activity (5 Oct 2020 - 11 Oct 2020)
Ten years of JSWSC
The Journal of Space Weather and Space Climate (JSWSC - https://www.swsc-journal.org/ ) was established as an open access journal at the end of 2010 and is celebrating a successful first decade. The journal has come a long way since its inception, and holds a special place at the heart of the space weather community. Indeed, JSWSC emerged from a European space weather community effort, and the Editorial Board was soon expanded to include experts also from other continents. It consists, currently, of 24 Associate Editors whose expertise covers all aspects of the discipline. It is published by EDP Sciences (http://www.edpsciences.org/ ) in an electronic online version only. It benefits from strong support by the Solar-Terrestrial Centre of Excellence (STCE - http://www.stce.be/ ) in Brussels, Belgium. The impact factor has been rising almost continuously, reaching a 2019 2-year IF of 3.095 and a 5-year IF of 2.981 (Clarivate Analytics JCR). With recent innovative accomplishments such as the creation of the AGORA section, the journal can confidently engage its 2nd decade.
More information on JSWSC, highlighting some relevant papers, space weather domains, and completed milestones, can be found in a dedicated webpage at https://www.swsc-journal.org/news/310-from-solar-flares-to-the-little-ice-age-and-the-role-of-jswsc
Sun, satellites and planes
What have Sun, satellites and planes in common? Weather in space. The sun makes the weather in space, satellites keep an eye on the weather in space and planes better watch out for weather in space.
A new scientific term is being introduced: marble plasma.
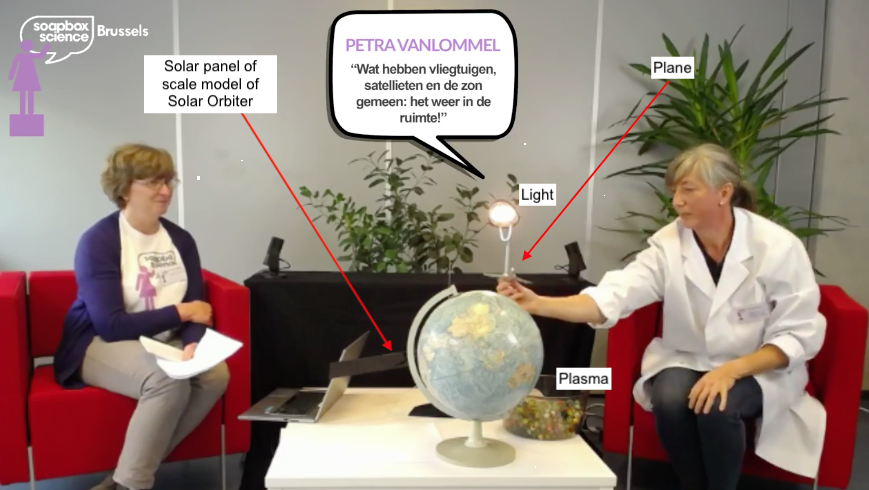
Check it out in the Soapbox science talk (at 50:15):https://www.facebook.com/SoapboxScienceBrussels/videos/352726112831416/
In Dutch, sorry
Review of solar activity
Solar X-ray flux remained below B level. Two active regions emerged in the Southern hemisphere but remained quiet. Catania group 44 (NOAA region 2775) developed into a simple stable bipolar group (Cro, Beta) while Catania group 43 (NOAA region 2774) was mostly unipolar (Axx, Alpha) and in decay by the end of the week.
No Earth directed Coronal Mass Ejections (CME's) have been observed in coronagraph data.
The greater than 10 MeV proton flux were at nominal levels.
The greater than 2 MeV electron flux was initially permanently above the 10^3 pfu event threshold, following last weeks high speed solar wind conditions. It dipped below the event threshold late October 5 but remained at enhanced levels reaching some days to just above the 10^3 pfu event threshold at its diurnal maximum.
PROBA2 Observations (5 Oct 2020 - 11 Oct 2020)
Solar Activity
Solar flare activity was very low during the week.
In order to view the activity of this week in more detail, we suggest to go to the following website from which all the daily (normal and difference) movies can be accessed: https://proba2.oma.be/ssa
This page also lists the recorded flaring events.
A weekly overview movie can be found here (SWAP week 550): https://proba2.sidc.be/swap/data/mpg/movies/weekly_movies/weekly_movie_2020_10_05.mp4
Details about some of this week's events can be found further below.
If any of the linked movies are unavailable they can be found in the P2SC movie repository here: https://proba2.oma.be/swap/data/mpg/movies/
Sunday Oct 11
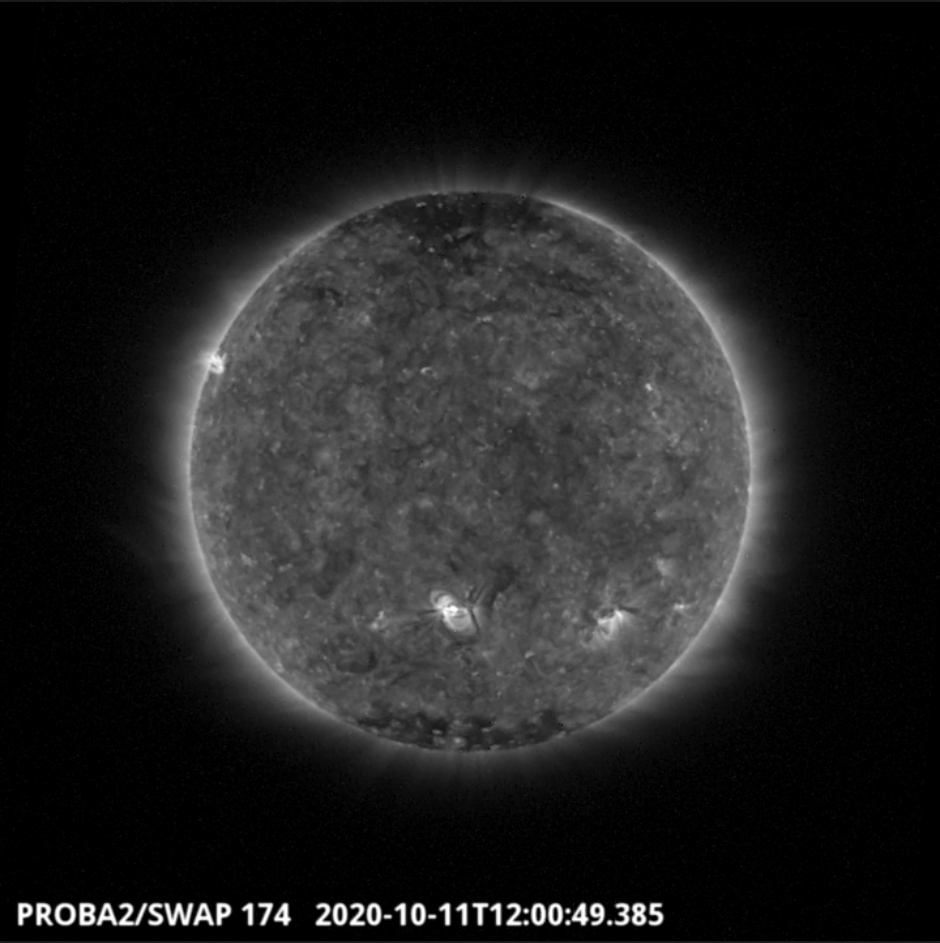
Two new active regions emerged in the southern hemisphere during the week (NOAA ARs 2774 and 2775), although they did not produce any significant flaring activity. The active regions are visible in the SWAP image above taken at 12:00 UTC on 2020-Oct-11.
Find a movie of the day here (SWAP movie): http://proba2.oma.be/swap/data/mpg/movies/20201011_swap_movie.mp4
The International Sunspot Number by Silso
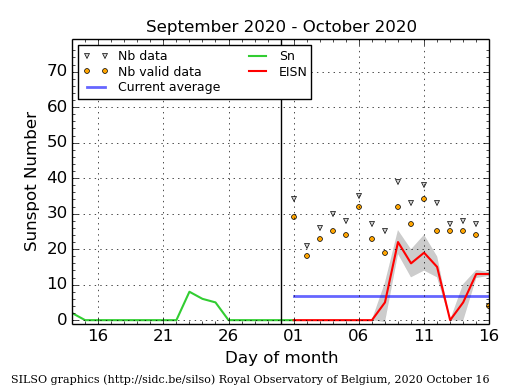
The daily Estimated International Sunspot Number (EISN, red curve with shaded error) derived by a simplified method from real-time data from the worldwide SILSO network. It extends the official Sunspot Number from the full processing of the preceding month (green line). The plot shows the last 30 days (about one solar rotation). The horizontal blue line shows the current monthly average. The yellow dots gives the number of stations that provided valid data. Valid data are used to calculate the EISN. The triangle gives the number of stations providing data. When a triangle and a yellow dot coincide, it means that all the data is used to calculate the EISN of that day.
Review of geomagnetic activity
The solar wind was essentially in a nominal regime. The solar wind speed decreased from above 400 km/s to below 300km/s during the week. The exception to this downward trend was a slight enhancement on October 7-8 reaching again 400 km/s. Total magnetic field was mostly below 5nT while October 5-6 was marked by the passage of a transient with total magnetic field reaching 11nT and Bz reaching down to -9nT. Total magnetic field also reached briefly to over 10nT again in the compression region ahead of the speed enhancement of October 7-8.
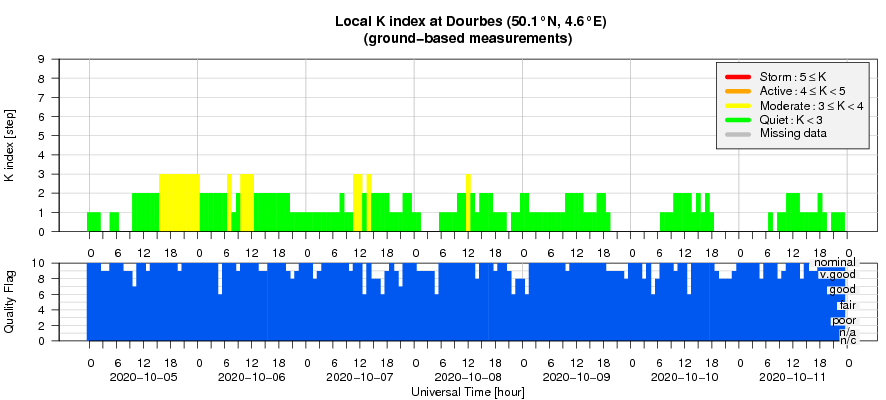
Geomagnetic conditions were mostly quiet with some unsettled to active periods associated with the solar wind transient of October 5-6 (NOAA Kp reaching 4 while local K Dourbes 3) and unsettled conditions (local K Dourbes 3 while NOAA Kp just 2) associated to the solar wind enhancement on October 7-8.
Geomagnetic Observations at Dourbes (5 Oct 2020 - 11 Oct 2020)
The SIDC Space Weather Briefing
The Space Weather Briefing presented by the forecaster on duty from October 4 to 11. It reflects in images and graphs what is written in the Solar and Geomagnetic Activity report.

A pdf-version: http://www.stce.be/briefings/20201012_SWbriefing.pdf
The movie: http://www.stce.be/briefings/20201012_SWbriefing.m4v
Review of ionospheric activity (5 Oct 2020 - 11 Oct 2020)
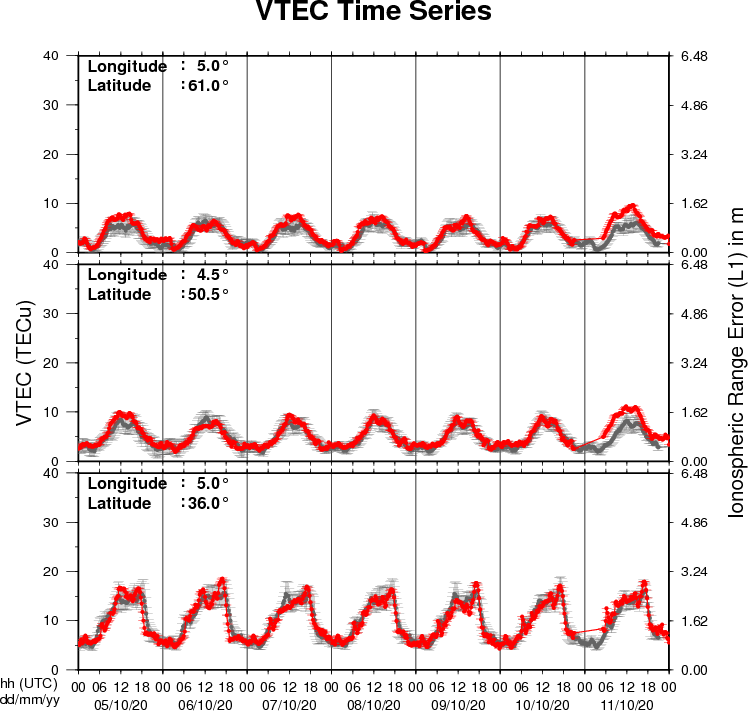
The figure shows the time evolution of the Vertical Total Electron Content (VTEC) (in red) during the last week at three locations:
a) in the northern part of Europe(N61°, 5°E)
b) above Brussels(N50.5°, 4.5°E)
c) in the southern part of Europe(N36°, 5°E)
This figure also shows (in grey) the normal ionospheric behaviour expected based on the median VTEC from the 15 previous days.
The VTEC is expressed in TECu (with TECu=10^16 electrons per square meter) and is directly related to the signal propagation delay due to the ionosphere (in figure: delay on GPS L1 frequency).
The Sun's radiation ionizes the Earth's upper atmosphere, the ionosphere, located from about 60km to 1000km above the Earth's surface.The ionization process in the ionosphere produces ions and free electrons. These electrons perturb the propagation of the GNSS (Global Navigation Satellite System) signals by inducing a so-called ionospheric delay.
See http://stce.be/newsletter/GNSS_final.pdf for some more explanations ; for detailed information, see http://gnss.be/ionosphere_tutorial.php