- Table of Content
- 1.Medical check ...
- 2.Five newly for...
- 3.Review of sola...
- 4.Review of geom...
- 5.The Internatio...
- 6.PROBA2 Observa...
- 7.Noticeable Sol...
- 8.Geomagnetic Ob...
- 9.The SIDC Space...
- 10.Review of iono...
- 11.Action! (14 Fe...
2. Five newly formed SWx experts
3. Review of solar activity
4. Review of geomagnetic activity
5. The International Sunspot Number by Silso
6. PROBA2 Observations (14 Feb 2022 - 20 Feb 2022)
7. Noticeable Solar Events (14 Feb 2022 - 20 Feb 2022)
8. Geomagnetic Observations in Belgium (14 Feb 2022 - 20 Feb 2022)
9. The SIDC Space Weather Briefing
10. Review of ionospheric activity (14 Feb 2022 - 20 Feb 2022)
11. Action! (14 Feb 2022 - 20 Feb 2022)
Medical check for SC25
The STCE's SC25 Tracking page (https://www.stce.be/content/sc25-tracking ) has been updated to reflect the latest evolution in some critical space weather parameters for the ongoing solar cycle 25 (SC25), from sunspot number all the way to cosmic rays. The multiple graphs allow for a comparison with previous solar cycles at similar stages in their evolution.
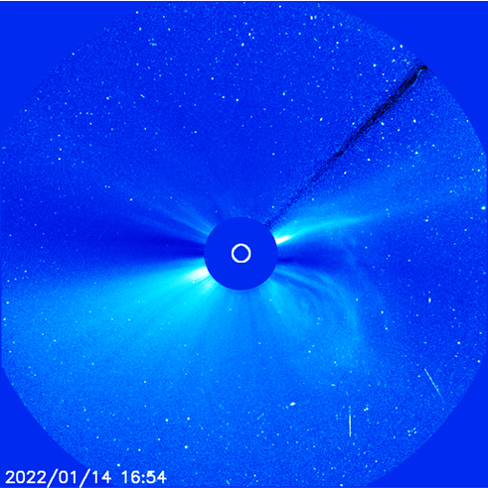
Over the last 4 months, a second X-class solar flare was recorded, as well as the first Ground Level Enhancement (GLE) of SC25, and the first geomagnetic storm of which the Dst-index reached -100 nT. Also the number of coronal mass ejections is on the rise, an example of which is shown in the SOHO/LASCO C3 image underneath taken 14 January 2022 (https://sohowww.nascom.nasa.gov/ ).
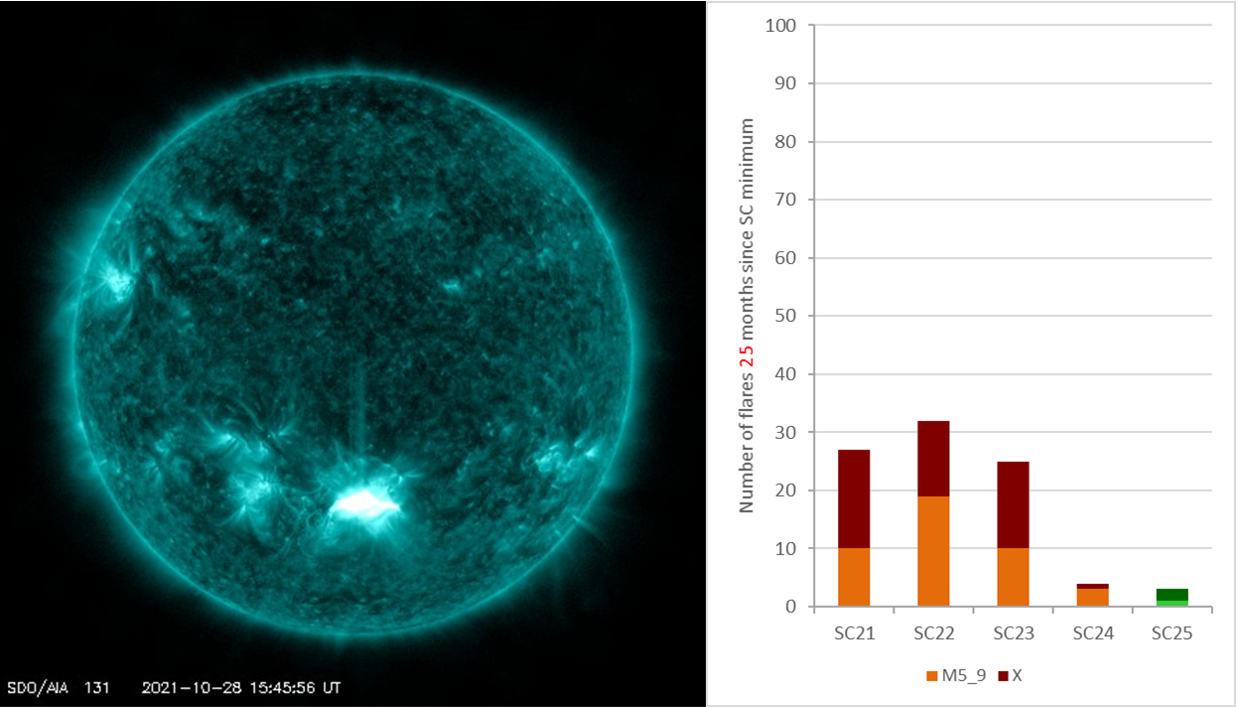
Sunspot activity has also significantly increased. The smoothed monthly sunspot number is currently about 20-25% higher than the values predicted by the international SC25 panel, with the southern solar hemisphere slightly dominating. This may indicate a higher maximum than initially thought (so higher than 115 +/-10), IF this trend continues. Solar flaring activity has been quite similar to the previous solar cycle SC24, and well below that recorded during the 3 preceding solar cycles. This can be seen in the graph underneath (lower right), showing the number of flares with peak strength M5 to M9 and X-class flares. On the lower left is an image in extreme ultraviolet of the 2nd X-class flare of SC25, as recorded by SDO/AIA 131 (https://sdo.gsfc.nasa.gov/data/aiahmi/ ) on 28 October last year.
Five newly formed SWx experts
At this very moment, five participants of the February Space Weather Introductory Course of the STCE are doing the test to get a certificate.
This is before the test
More courses will be planned. Check https://events.spacepole.be/category/4/
Review of solar activity
Solar activity was at moderate levels on Feb 14 and 15 and decreased to low levels for majority of the rest of the week. There were eleven Active Regions (ARs) on the disk. Most of these were magnetically simple, short lived and produced only B-class flares. At the start of the week, there were two low level M-class flares (M1 and M1.3) from NOAA AR2941 and multiple C class flares. Between Feb 16 and 19 there was some low level C-class flares, primarily associated with NOAR 2950. Towards the end of the week, the flaring activity increased, including a C5.1 flare from beyond the limb, probably associated with NOAA AR 2954. By the end of the week, there were four numbered ARs on the solar disk.
Multiple filaments were observed on disk but there were no Earth-directed Coronal Mass Ejections (CMEs) detected in the available coronagraph imagery. A large halo CME detected on Feb 15 in coronagraph data was determined to be back-sided and hence would not impact Earth.
The greater than 10 MeV proton flux was slightly enhanced from Feb 16, reaching 1pfu, but remained far below the 10pfu threshold. The greater than 2 MeV electron flux exceeded the 1000 pfu alert threshold between Feb 13 and Feb 18, returning to nominal levels from Feb 19. The 24h electron fluence was at moderate levels for much of the week, returning to nominal levels from Feb 19.
Review of geomagnetic activity
At the start of the week, the Earth was under the waning influence of a High Speed Stream (HSS). The solar wind speed was over 500 km/s. The solar wind parameters then gradually decreased and reflected a slow solar wind regime for most of the week. On Feb 20, a HSS arrived. This was probably associated with the positive polarity Coronal Hole (CH), which began to cross the central meridian on Feb 17. The total magnetic field reached a maximum value of 12 nT, with a minimum Bz of -11 nT on Feb 20. The solar wind speed gradually increased and reached a maximum value of around 570 km/s on Feb 20.
Geomagnetic conditions were unsettled to active on Feb 13, with quiet to unsettled conditions prevailing between Feb 14 and Feb 19. Active conditions and a short period of minor storm conditions (NOAA Kp=5) were observed in response to the enhanced magnetic field and strong negative Bz associated with the arrival of the HSS on Feb 20.
The International Sunspot Number by Silso
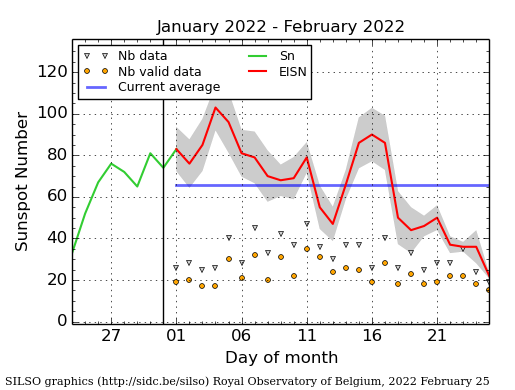
The daily Estimated International Sunspot Number (EISN, red curve with shaded error) derived by a simplified method from real-time data from the worldwide SILSO network. It extends the official Sunspot Number from the full processing of the preceding month (green line), a few days more than one solar rotation. The horizontal blue line shows the current monthly average. The yellow dots give the number of stations that provided valid data. Valid data are used to calculate the EISN. The triangle gives the number of stations providing data. When a triangle and a yellow dot coincide, it means that all the data is used to calculate the EISN of that day.
PROBA2 Observations (14 Feb 2022 - 20 Feb 2022)
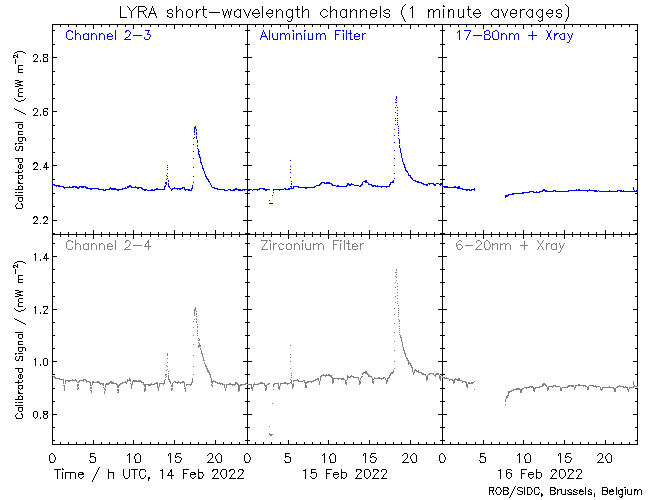
Solar Activity
Solar flare activity fluctuated between very low to moderate during the week.
In order to view the activity of this week in more detail, we suggest to go to the following website from which all the daily (normal and difference) movies can be accessed: https://proba2.oma.be/ssa
This page also lists the recorded flaring events.
A weekly overview movie can be found here (SWAP week 621): https://proba2.sidc.be/swap/data/mpg/movies/weekly_movies/weekly_movie_2022_02_14.mp4
Details about some of this week's events can be found further below.
If any of the linked movies are unavailable they can be found in the P2SC movie repository here: https://proba2.oma.be/swap/data/mpg/movies/
Tuesday Feb 15
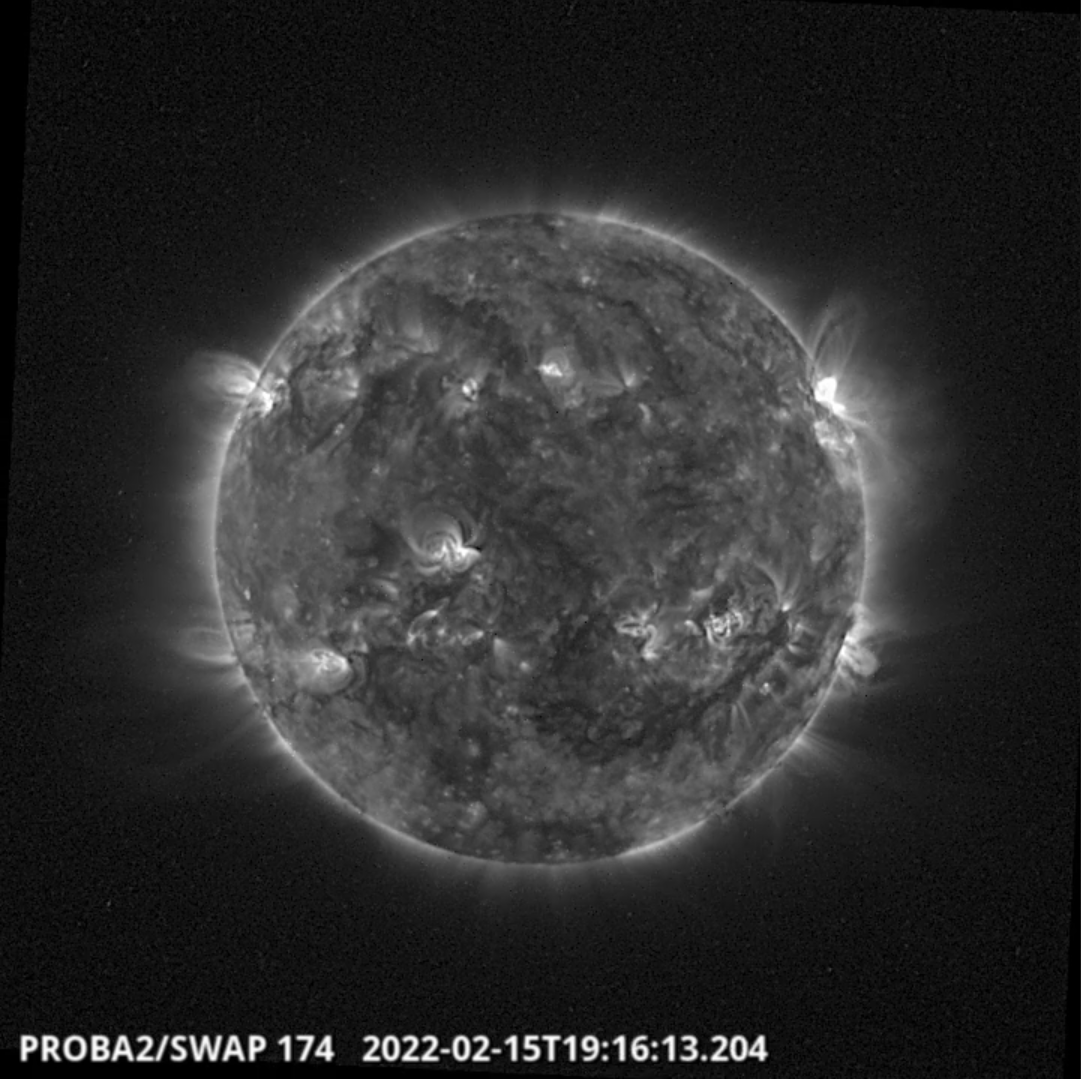
The largest flare of the week, an M1.3 flare, was observed by SWAP and LYRA. The flare is visible near the east limb on 2022-Feb-15, as shown in the SWAP image above taken at 18:16 UT.
Find a movie of the event here (SWAP movie): https://proba2.sidc.be/swap/movies/20220215_swap_movie.mp4
Noticeable Solar Events (14 Feb 2022 - 20 Feb 2022)
| DAY | BEGIN | MAX | END | LOC | XRAY | OP | 10CM | TYPE | Cat | NOAA |
| 14 | 1702 | 1731 | 1751 | N26W62 | M1.0 | SF | 26 | 2941 | ||
| 15 | 1754 | 1815 | 1831 | N26W73 | M1.3 | SF | III/1VI/1 | 26 | 2941 |
| LOC: approximate heliographic location | TYPE: radio burst type |
| XRAY: X-ray flare class | Cat: Catania sunspot group number |
| OP: optical flare class | NOAA: NOAA active region number |
| 10CM: peak 10 cm radio flux |
Geomagnetic Observations in Belgium (14 Feb 2022 - 20 Feb 2022)
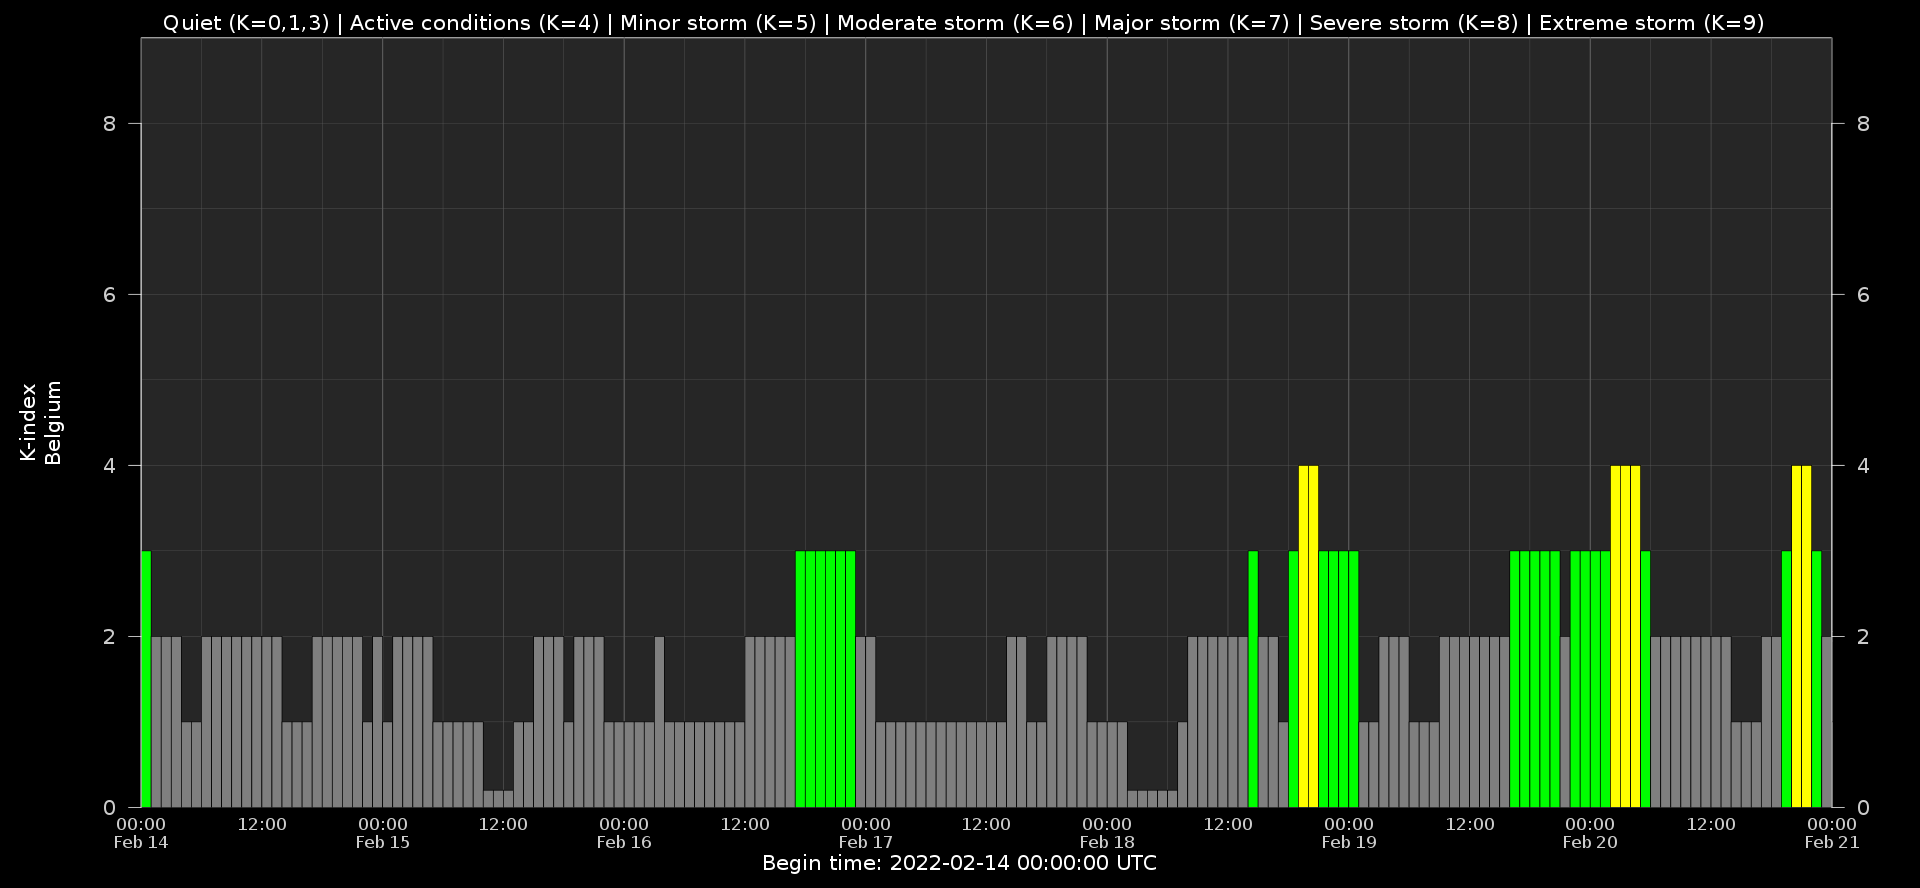
Local K-type magnetic activity index for Belgium based on data from Dourbes (DOU) and Manhay (MAB). Comparing the data from both measurement stations allows to reliably remove outliers from the magnetic data. At the same time the operational service availability is improved: whenever data from one observatory is not available, the single-station index obtained from the other can be used as a fallback system.
Both the two-station index and the single station indices are available here: http://ionosphere.meteo.be/geomagnetism/K_BEL/
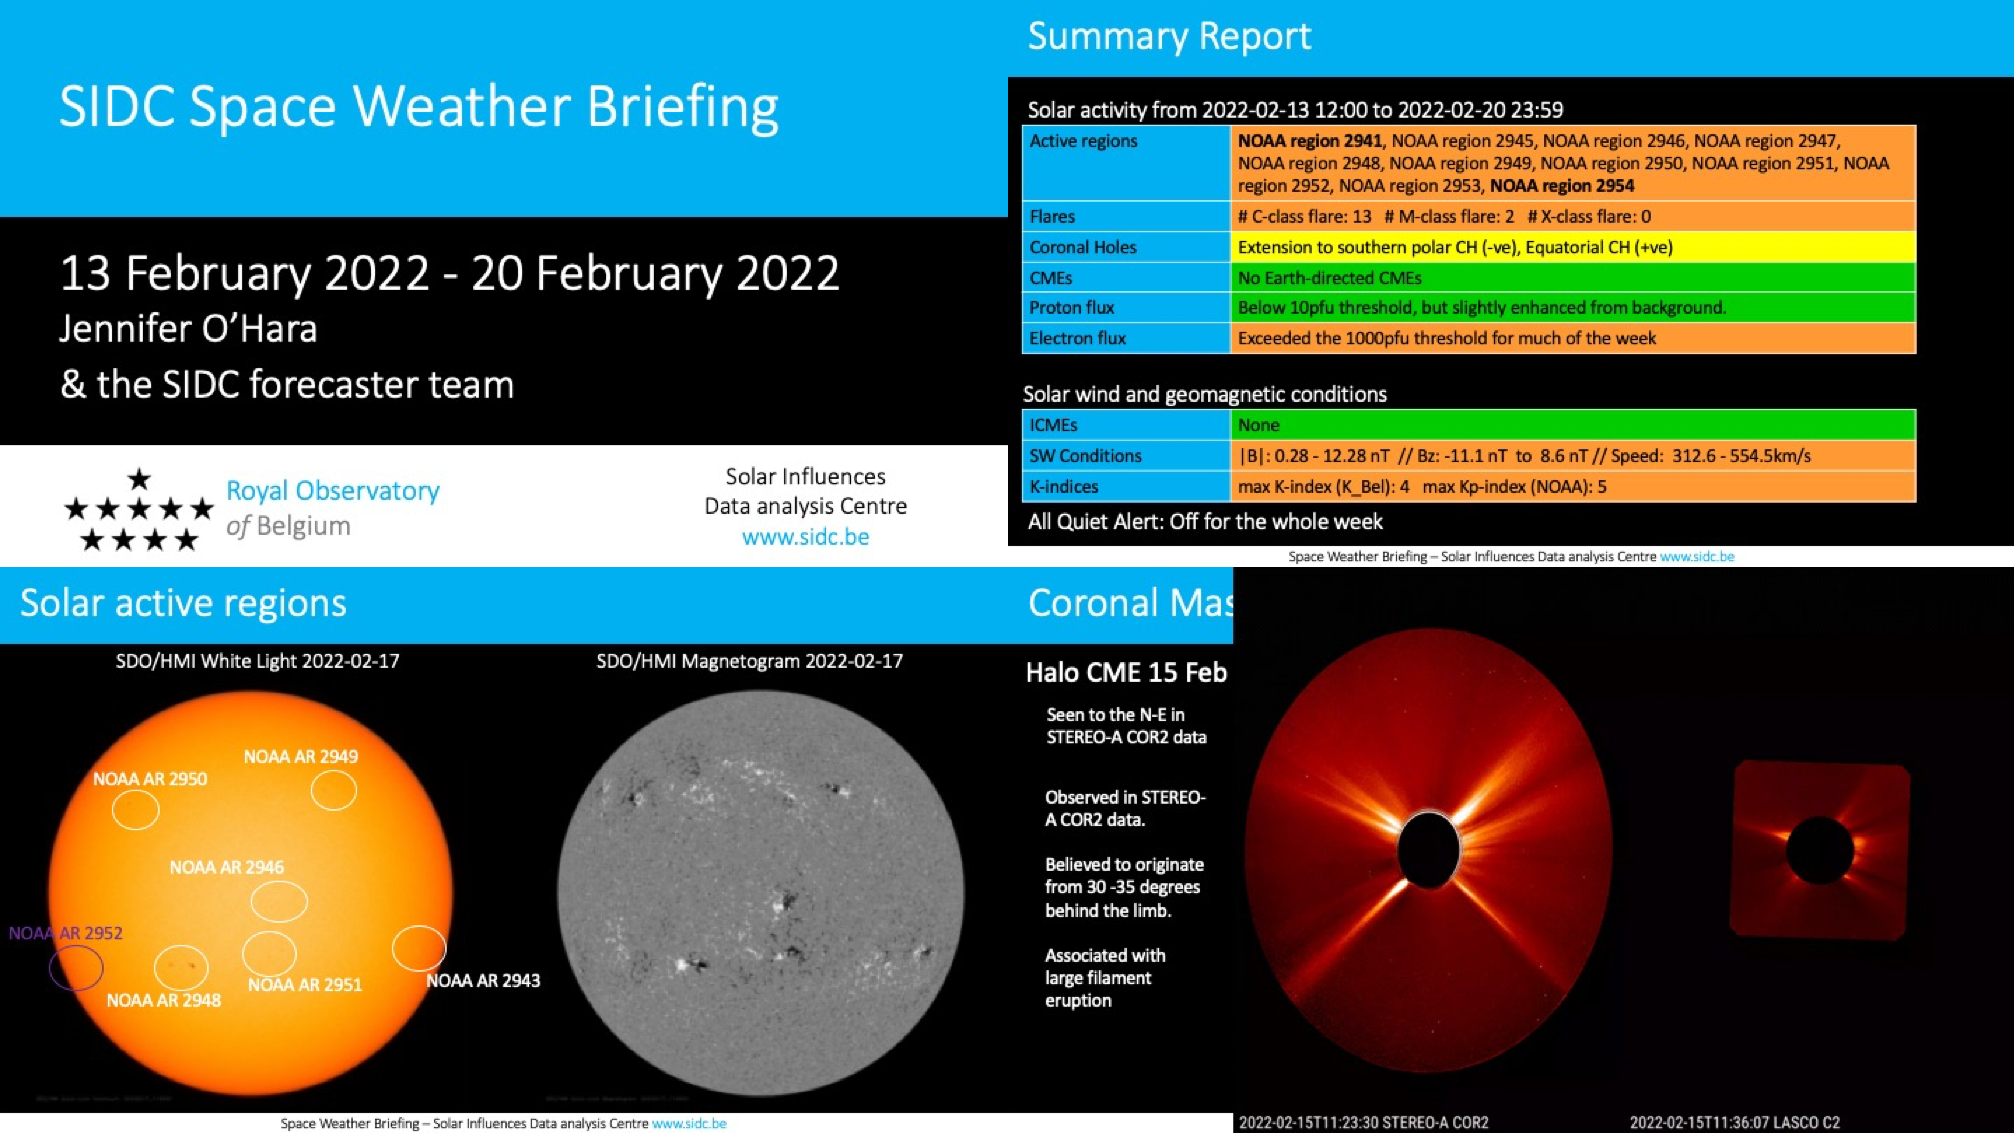
The SIDC Space Weather Briefing
The Space Weather Briefing presented by the forecaster on duty from Feb 13 to 20. It reflects in images and graphs what is written in the Solar and Geomagnetic Activity report: https://www.stce.be/briefings/20220221_SWbriefing.pdf
If you need to access the movies, contact us: stce_coordination at stce.be
Review of ionospheric activity (14 Feb 2022 - 20 Feb 2022)
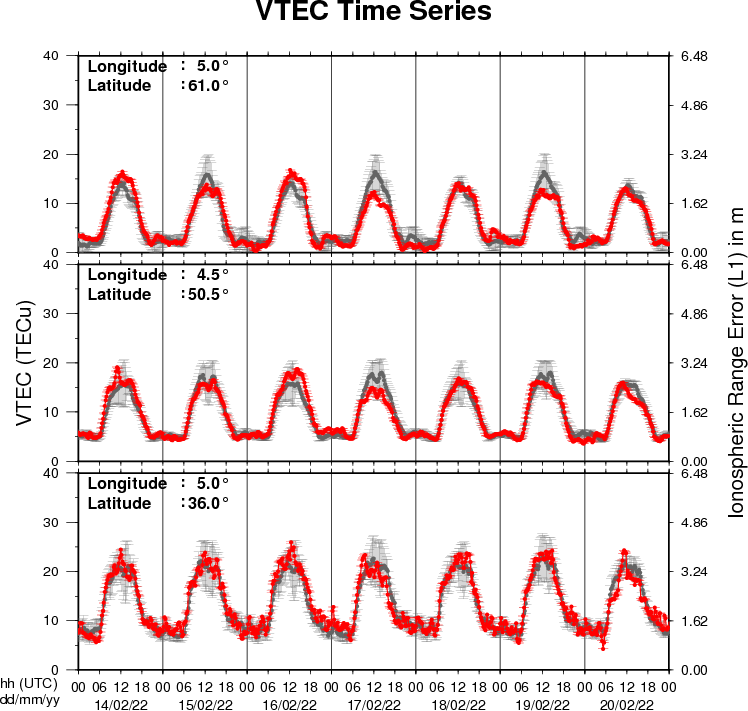
The figure shows the time evolution of the Vertical Total Electron Content (VTEC) (in red) during the last week at three locations:
a) in the northern part of Europe(N 61deg E 5deg)
b) above Brussels(N 50.5deg, E 4.5 deg)
c) in the southern part of Europe(N 36 deg, E 5deg)
This figure also shows (in grey) the normal ionospheric behaviour expected based on the median VTEC from the 15 previous days.
The VTEC is expressed in TECu (with TECu=10^16 electrons per square meter) and is directly related to the signal propagation delay due to the ionosphere (in figure: delay on GPS L1 frequency).
The Sun's radiation ionizes the Earth's upper atmosphere, the ionosphere, located from about 60km to 1000km above the Earth's surface.The ionization process in the ionosphere produces ions and free electrons. These electrons perturb the propagation of the GNSS (Global Navigation Satellite System) signals by inducing a so-called ionospheric delay.
See http://stce.be/newsletter/GNSS_final.pdf for some more explanations ; for detailed information, see http://gnss.be/ionosphere_tutorial.php
Action! (14 Feb 2022 - 20 Feb 2022)
Check out our activity calendar: activities and encounters with the Sun-Space-Earth system and Space Weather as the main theme. We provide occasions to get submerged in our world through educational, informative and instructive activities.
If you want your event in our calendar, contact us: stce_coordination at stce.be
* February 26, Public Lecture on Space Weather, Satellites and Aviation (Dutch), UGent Volkssterrenwacht Armand Pien, Gent, Belgium
* March 14-16, onsite (!) Space Weather Introductory Course by SWEC, Space Weather Education Center - registrations are open
* March 22, Wetenschapsbattle
* March 25-26, Space Days in Leuven
* April 5-17, SUN exhibit at the Africa Museum
* April 26, Public Lecture on the Solar Corona in EUV (Dutch), Urania, Hove, Belgium
* April 28, Public Lecture on SolO/EUI, Astropolis, Oostende, Belgium
* July 3, Public Lecture 'missions to space' at the 'Sun watch day' event, Cosmodrome, Genk, Belgium
* August 25, Public Lecture on Space Weather and Aviation, Astropolis, Oostende, Belgium
* October 24-28, 18th European Space Weather Week, Zagreb, Croatia
Check: https://www.stce.be/calendar