- Table of Content
- 1.Storm alarm - ...
- 2.Close encounte...
- 3.EUI observes e...
- 4.First eclipse ...
- 5.Review of sola...
- 6.Review of geom...
- 7.PROBA2 Observa...
- 8.International ...
- 9.Noticeable Sol...
- 10.Geomagnetic Ob...
- 11.The SIDC Space...
- 12.Review of iono...
- 13.Agenda
2. Close encounters of the aurora kind
3. EUI observes elephants and mice?
4. First eclipse of the year observed by PROBA2
5. Review of solar activity
6. Review of geomagnetic activity
7. PROBA2 Observations (17 Apr 2023 - 23 Apr 2023)
8. International Sunspot Number by SILSO
9. Noticeable Solar Events
10. Geomagnetic Observations in Belgium
11. The SIDC Space Weather Briefing
12. Review of ionospheric activity
13. Agenda
Storm alarm - fast news
On April 23, 17:00 Universal Time, a magnetic cloud coming from the sun reached the earth. The STCE alert system started ringing the entire night and longer.
For our PECASUS services for civil aviation, scientists and operators in Belgium and Finland were continuously in contact to give a correct interpretation of the data which was coming in.
Models as a first estimate of arrival
The picture below is the output of a simulation by EUHFORIA of the cloud propagation in the heliosphere. Left is a 'top' view of the sun (white dot) and the earth (blue dot). The black structure is the front of the magnetic cloud (purple) that reaches the earth. On the right is a side view of space. At the bottom, you see that the curve goes through the roof at the arrival.
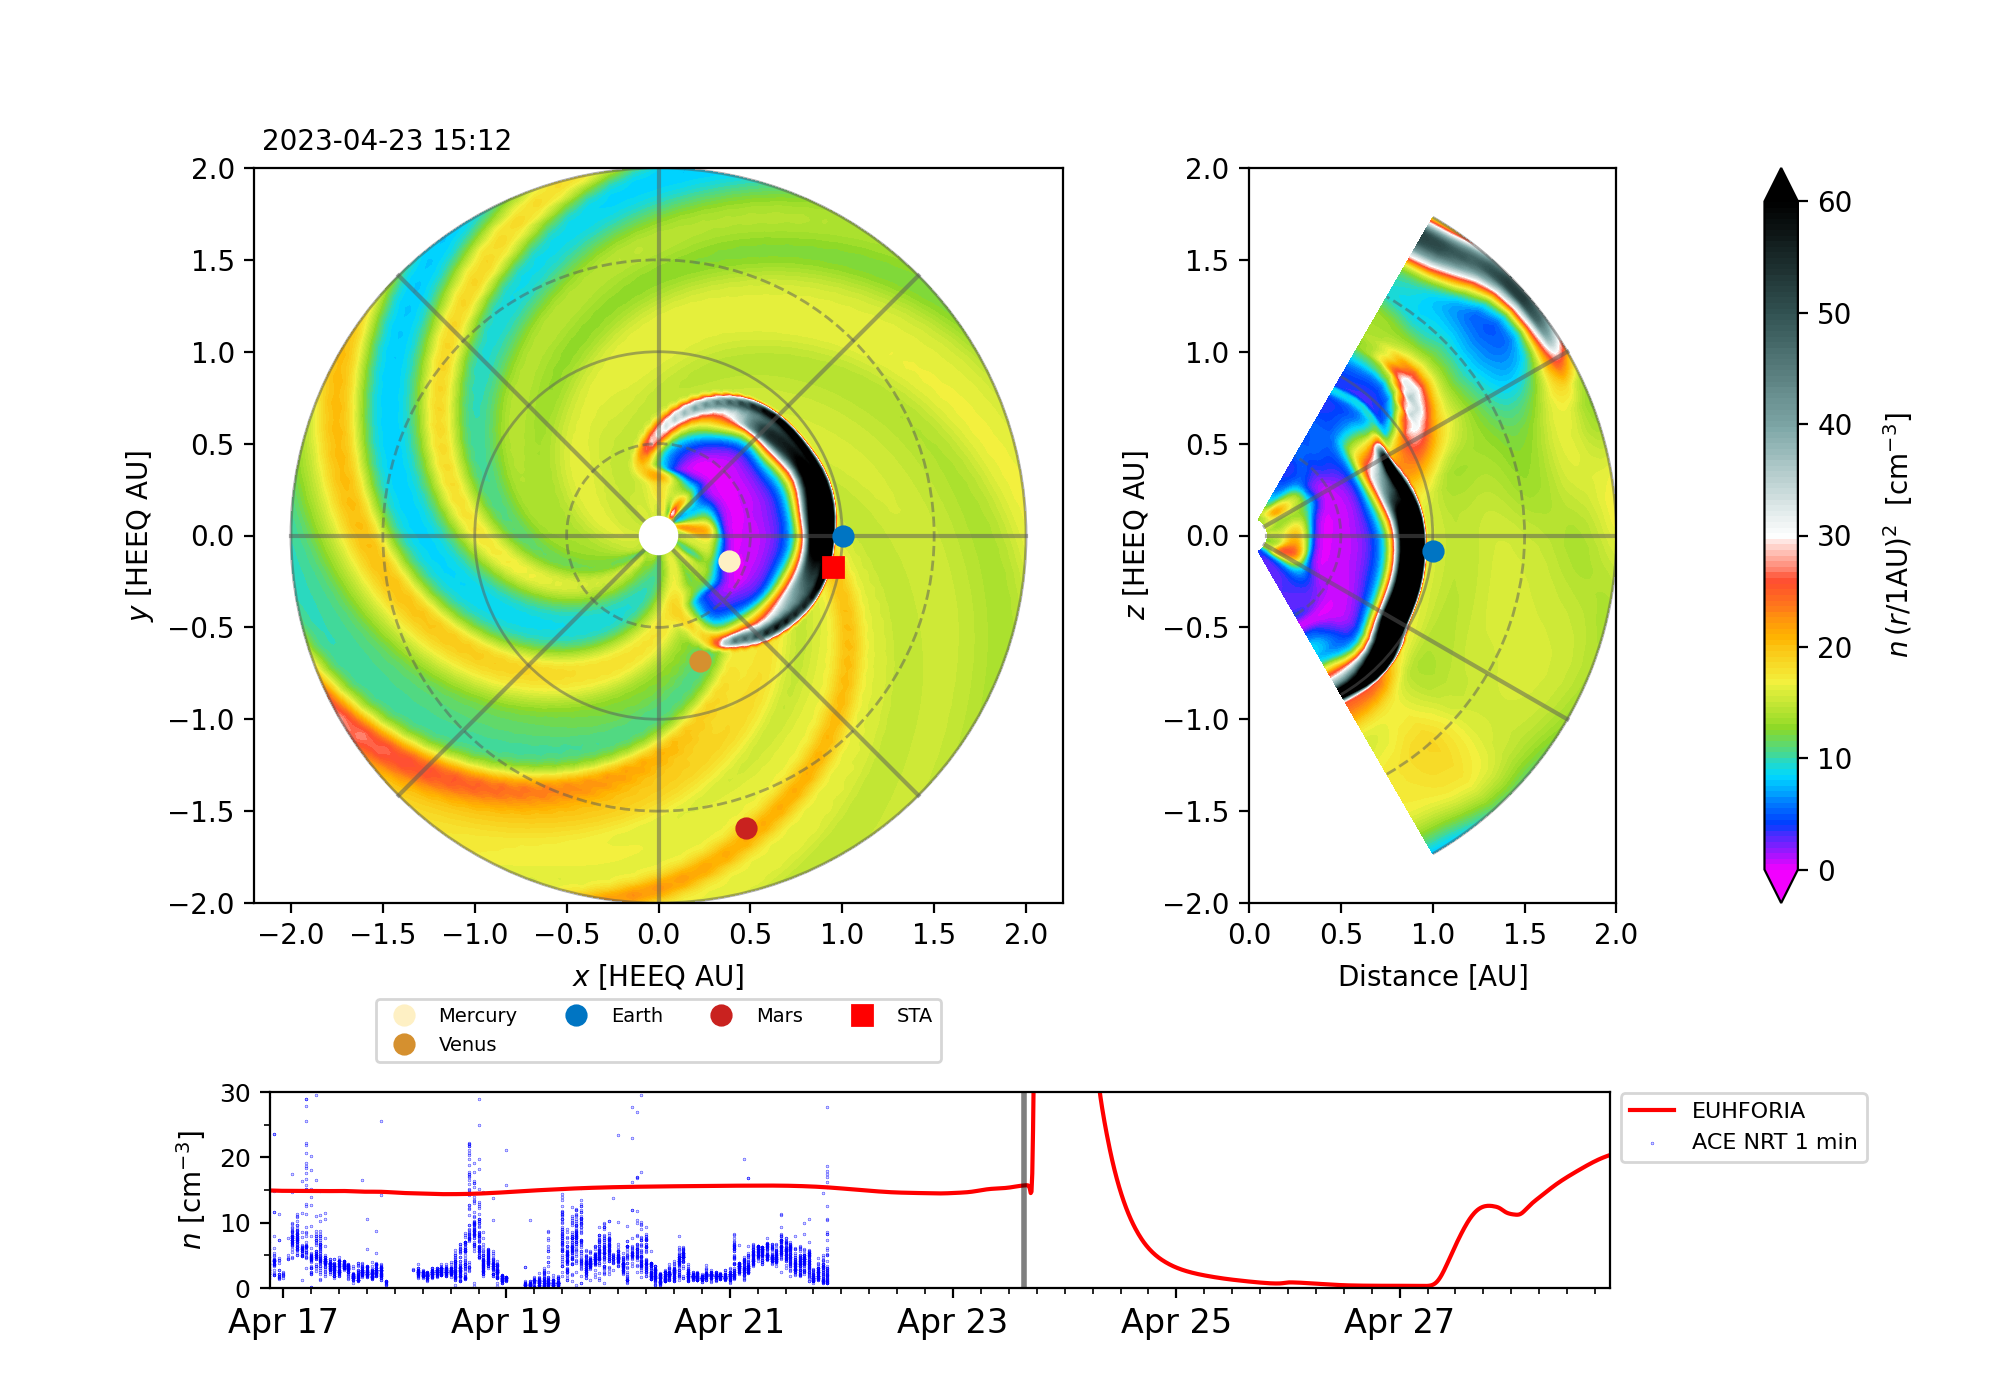
It did arrive!
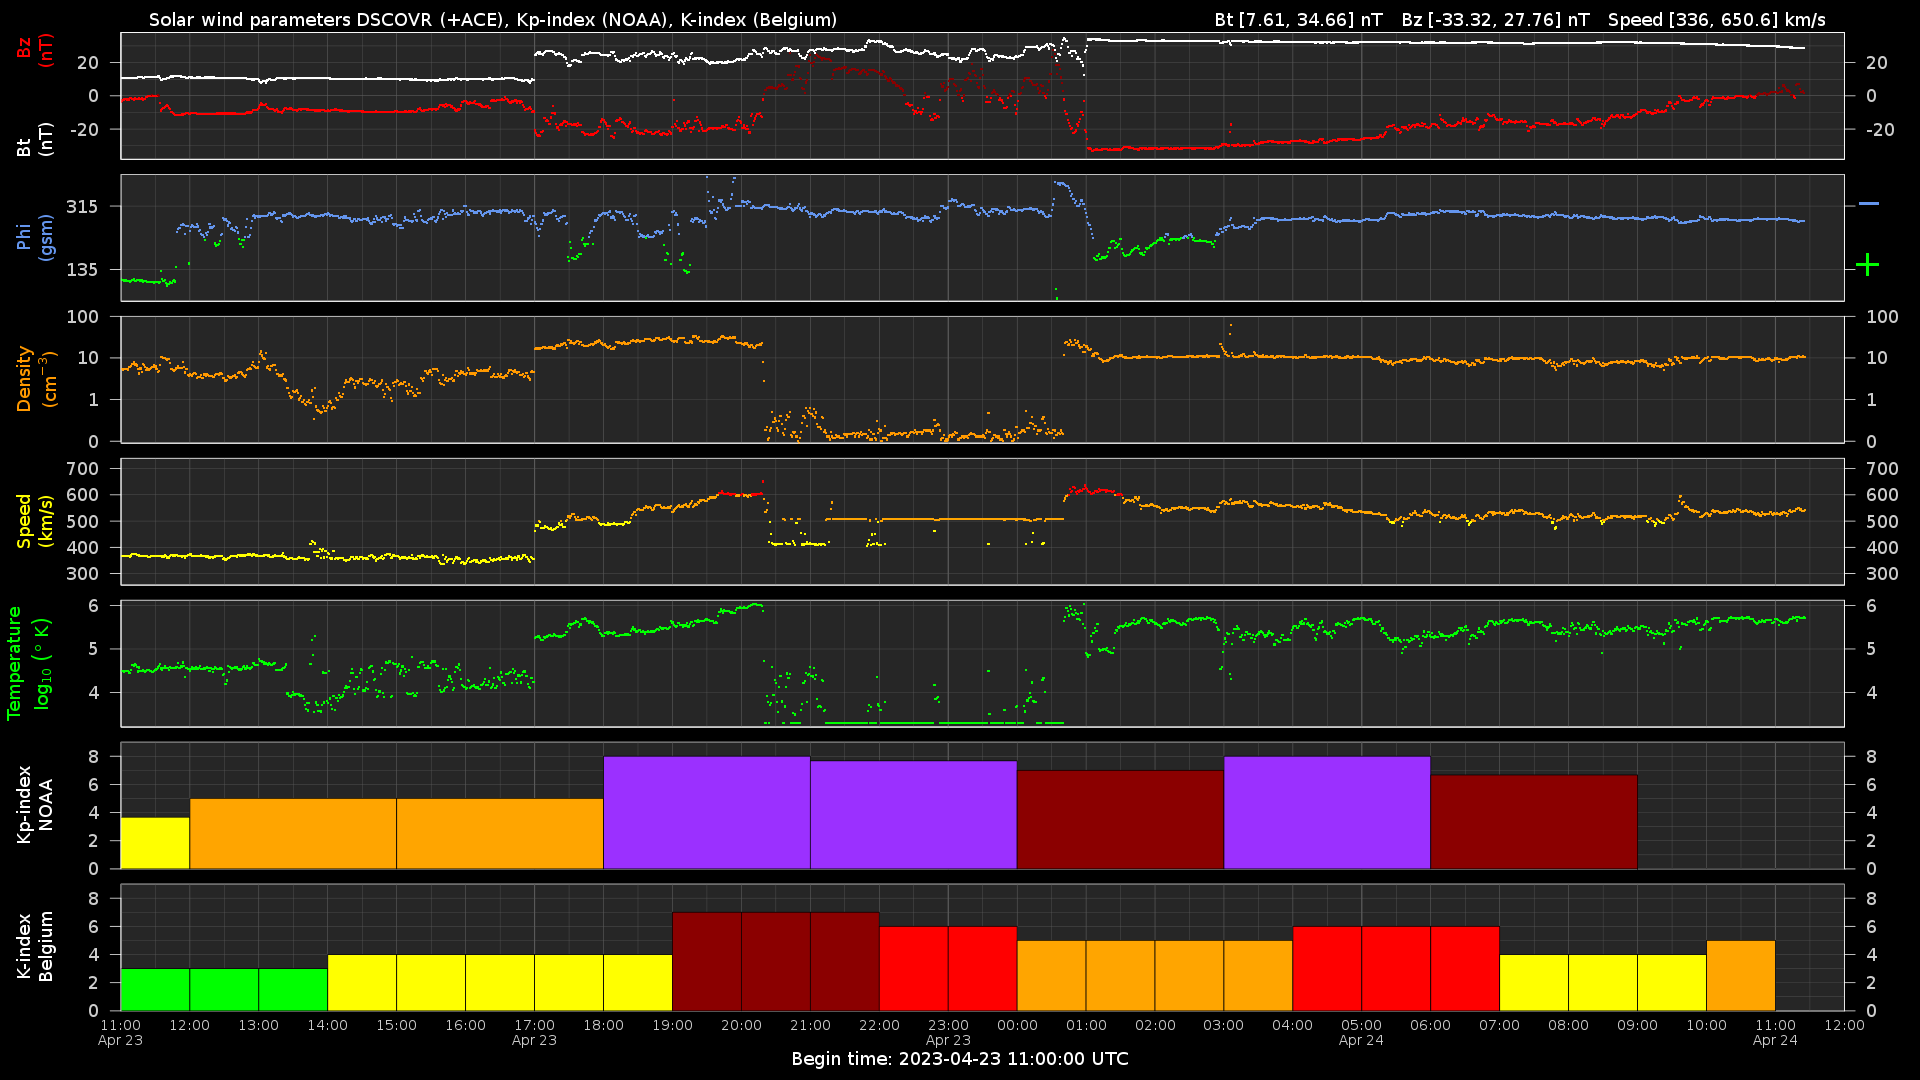
The satellite DSCOVR in a point 1 hour upstream of the earth, which means that it takes the solar wind 1 hour to reach the Earth, 'saw' the cloud passing and measured a jump on April 23, 17UT as seen in the top panel of the graph below. The cloud induced a severe geomagnetic storm on the planetary level (purple rectangles in the 6th panel)) and a moderate geomagnetic storm locally in Belgium (dark red rectangles in the 7th panel).
Impact on High Frequency Radio Communication
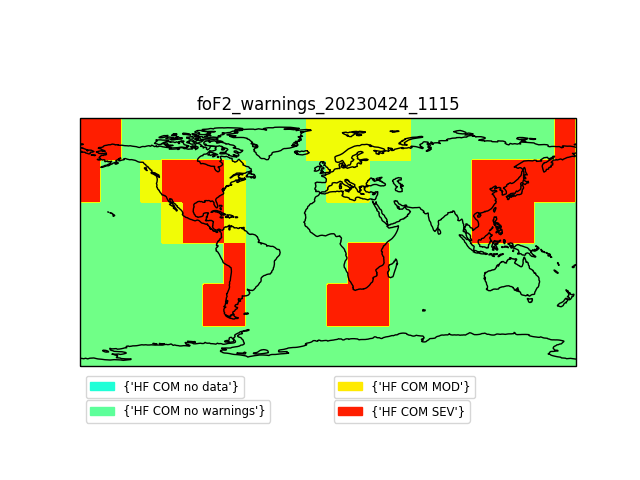
High Frequency (HF) radio waves used for radio communication were being absorbed in the polar region because of solar protons and precipitating electrons bombarding the Earth's atmosphere. The precipitating electrons enter the atmosphere in the auroral oval which expanded during this storm up to 60° latitude in the Northern hemisphere and up to 40° latitude in the Southern Hemisphere.
On top of this, a post storm depression was measured on the entire globe as can be seen in the picture below where several parts of the globe colour red. During a post storm depression, less frequencies of radio waves can be used to set up long distance HF radio contact.
Impact on Global Navigation Satellite Systems, GNSS
Simultaneously, global navigation satellite systems were also impacted. The signals sent out by the satellites were not well received anymore.
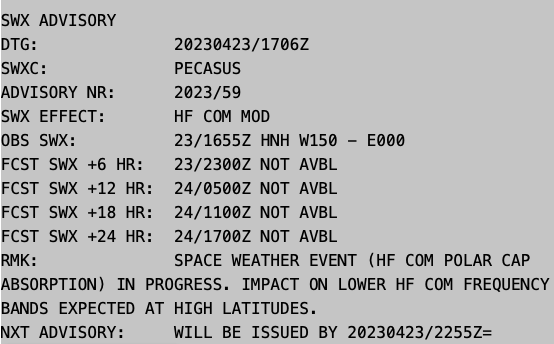
Advisories for civil aviation
The first advisory on HF COM was sent at 17:06UT. It was the first of many.
Close encounters of the aurora kind
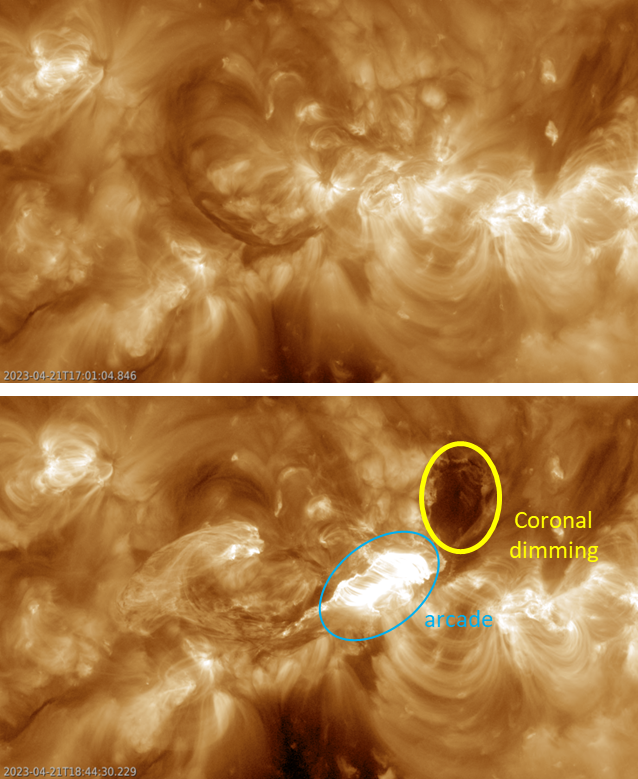
A violent eruption took place on the Sun on 21 April. The M1.7 flare was a long duration event (LDE) lasting an hour according to the GOES data (https://www.swpc.noaa.gov/products/goes-x-ray-flux ) and peaking at 18:12UTC. It originated from decaying active region NOAA 3283, consisting only of a few small sunspots at the time. More specifically, the eruption was a result of the interaction between the group filament and a much larger but quiescent filament to the east of this region. Solar filaments are clouds of charged particles ("plasma") above the solar surface squeezed between magnetic regions of opposite polarity. Being cooler and denser than the plasma underneath and their surroundings, they appear as dark lines when seen on the solar disk in suitable filters. The imagery underneath is from SDO/AIA 193 (http://sdo.gsfc.nasa.gov/data/aiahmi/ ) showing the filament eruption, as well as post-eruption coronal loops ("arcade"; mainly over NOAA 3283) and coronal dimming to the northwest of NOAA 3283. A clip is available in the online version of this newsitem at https://www.stce.be/news/642/welcome.html Of note is that the quiescent filament recomposed itself after the eruptive event. The arcade and the coronal dimming were 2 indications that a coronal mass ejection (CME) was associated with this solar flare. A full halo CME was indeed observed by coronagraphs such as SOHO/LASCO, starting at 18:12UTC (https://soho.nascom.nasa.gov/ ). The CME had a speed in excess of 1100 km/s and was squarely directed to Earth. The event was also associated with an enhancement of the greater than 10 MeV proton flux (GOES - https://www.swpc.noaa.gov/products/goes-proton-flux ).
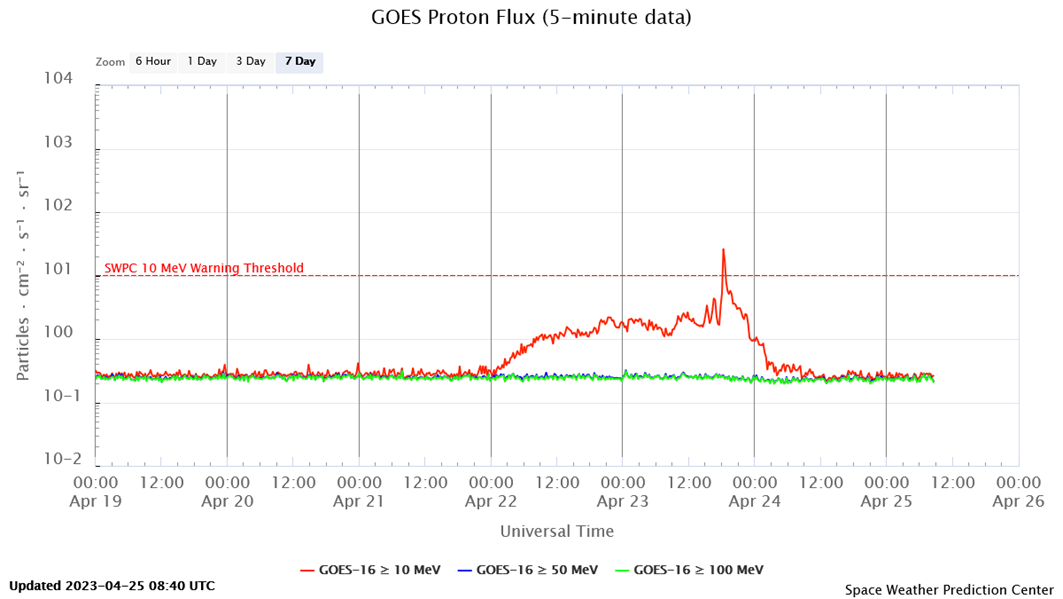
A shock was recorded in the solar wind parameters on 23 April at 17:00UTC (DSCOVR - https://www.swpc.noaa.gov/products/real-time-solar-wind ). It marked the somewhat (a few hours) earlier-than-expected arrival of the interplanetary coronal mass ejection (ICME). The passage of the shock briefly drove the already enhanced greater than 10 MeV proton flux finally above the proton event threshold (10 pfu - https://www.stce.be/educational/acronym#P ), with a maximum of 26 pfu recorded at 18:20UTC (graph underneath). This is called an Energetic Storm Particles event (ESP), and originates from the acceleration of charged particles by a fast, usually ICME-driven shock in interplanetary space (e.g. Ameri et al. 2023 - https://doi.org/10.1016/j.asr.2022.12.014 ). The proton flux drops sharply after the shock passage, as was the case here. Solar wind speed jumped from 360 to 475 km/s, then gradually further increased to values near 700 km/s by 21:00UTC. Bz, the north-south component of the interplanetary magnetic field, showed 2 prolonged periods of negative values: during the 17-20UTC interval, when its value was at a fairly stable -24 nT, and again on 24 April during the 01-09UTC interval when Bz evolved from -33 nT to -9 nT. The Bz value of -33 nT was the lowest since the 7 September 2017 storm (also -33 nT). For even more negative Bz, we have to go back all the way to the Solstice storm of 22 June 2015 when it reached values of -39 nT.
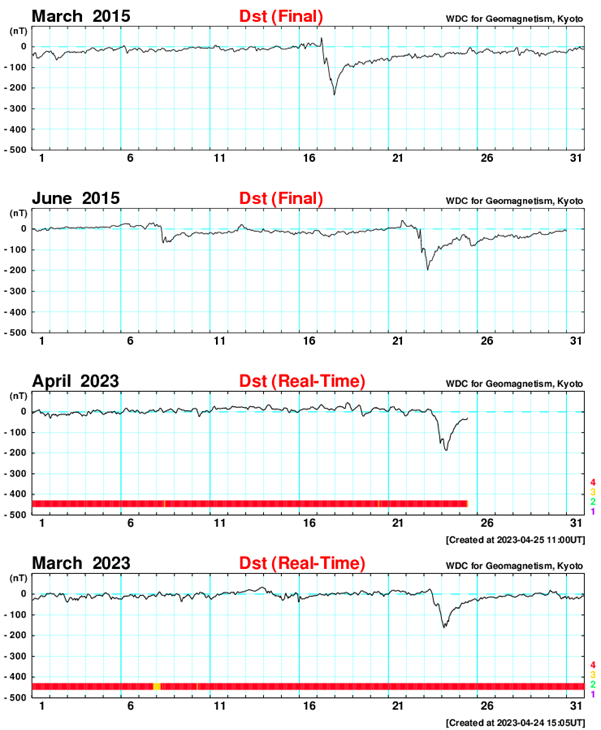
The passage of this strong ICME obviously resulted in a severe geomagnetic storm, the second in a month (see the STCE newsitem at https://www.stce.be/news/638/welcome.html). The estimated Kp index (https://www.swpc.noaa.gov/products/planetary-k-index ) reached 8 on 23 April during the 18-21UTC interval and again on 24 April during the 03-06UTC interval, whereas the local K_BEL index (http://ionosphere.meteo.be/geomagnetism/K_BEL/index.php ) topped at 7 during the 20-23UTC period. The (provisional) Disturbance storm-time index (Dst - see the STCE SWx classification page at https://www.stce.be/educational/classification#geomag ) dropped all the way to -187 nT, well below its value during the severe 24 March geomagnetic storm (-163 nT), thus making it the strongest storm so far this solar cycle. We have to go back all the way to 2015 to find even more negative values: the St-Patrick's Day storm resulted in a Dst of -234 nT on 17 March 2015, and during the already mentioned Solstice storm the Dst index reached -198 nT. The stack of graphs underneath shows the Dst evolution for the aforementioned geomagnetic storms. Note only the Dst values for the 2015 storms are final (Kyoto WDC for Geomagnetism - https://wdc.kugi.kyoto-u.ac.jp/ ).
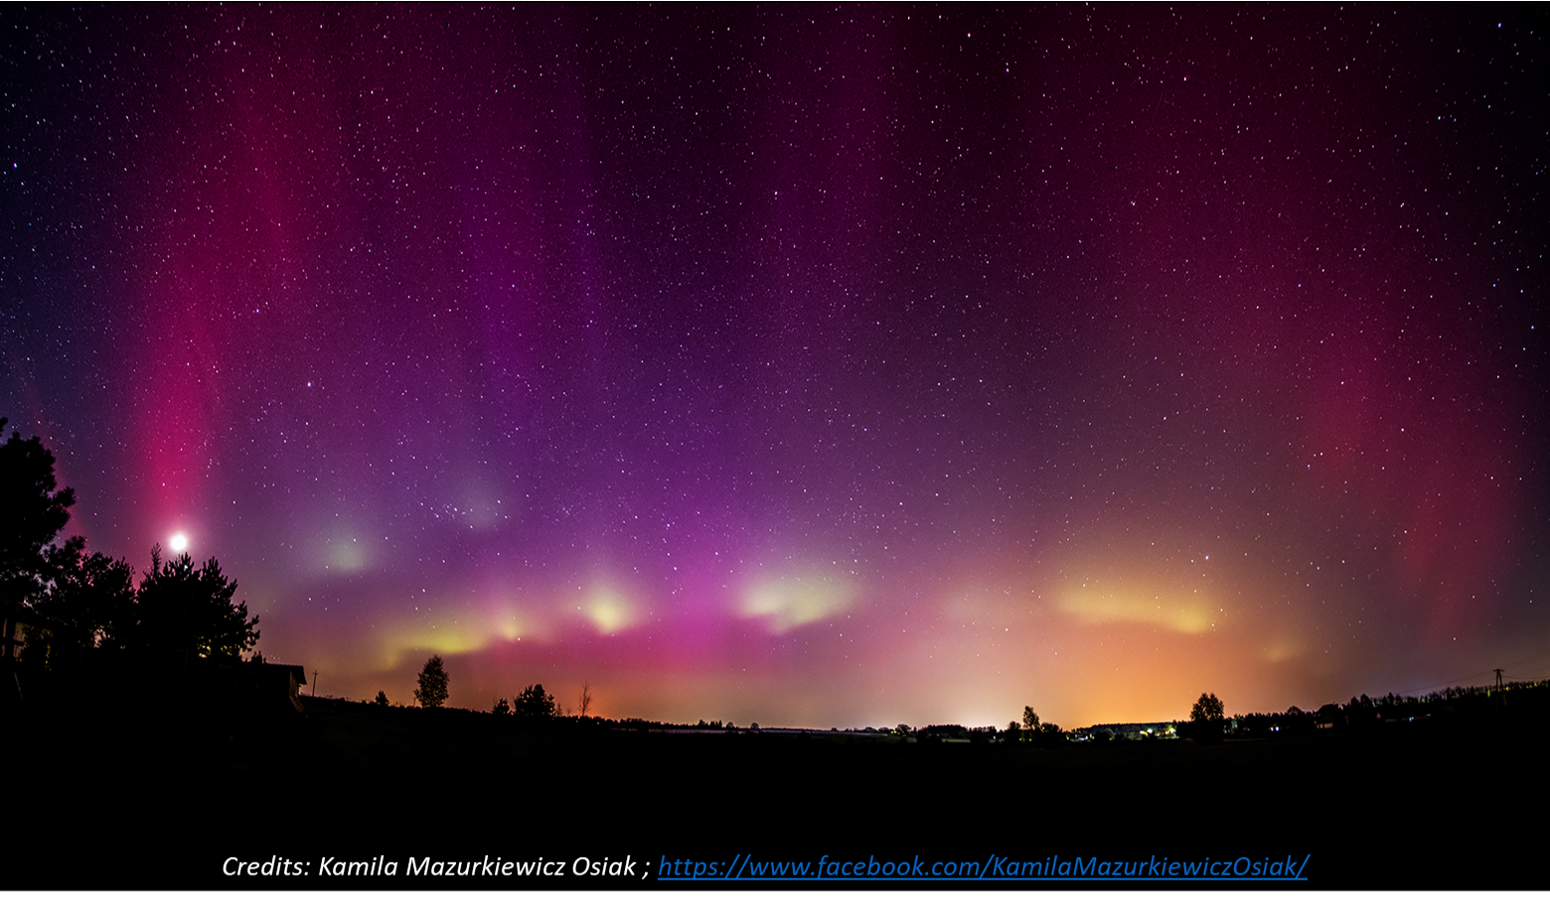
The geomagnetic storm resulted in quite spectacular polar lights that were observed and photographed from locations far away from the aurora's usual visibility zone. Reports from Spaceweather.com (https://www.spaceweather.com/ ) indicated that the aurora were photographed as far south as Texas and California in the United States, and from Slovenia and Southern Spain in Europe (see the online version of this article for the related map). The breathtaking picture underneath was taken by Kamila Mazurkiewicz Osiak (https://www.facebook.com/KamilaMazurkiewiczOsiak/ ) near Pulawy, Poland on 23-24 April. It captures the amazing, out-of-this-world auroral colours as well as the isolated, green auroral patches, as commented on by some observers. Many mid-latitude aurora watchers reported either that it was their first-time observing of green aurora, or that it had been many years since their last observation of these green polar lights. As a reminder: the red hues of the aurora are typically found at higher altitudes (200 km or higher) than the green coloured aurora (between 100 and 200 km) and thus can be seen from further away than the green ones (see BIRA-IASB - https://www.aeronomie.be/en/encyclopedia/aurora-or-polar-lights-secret-colours ).
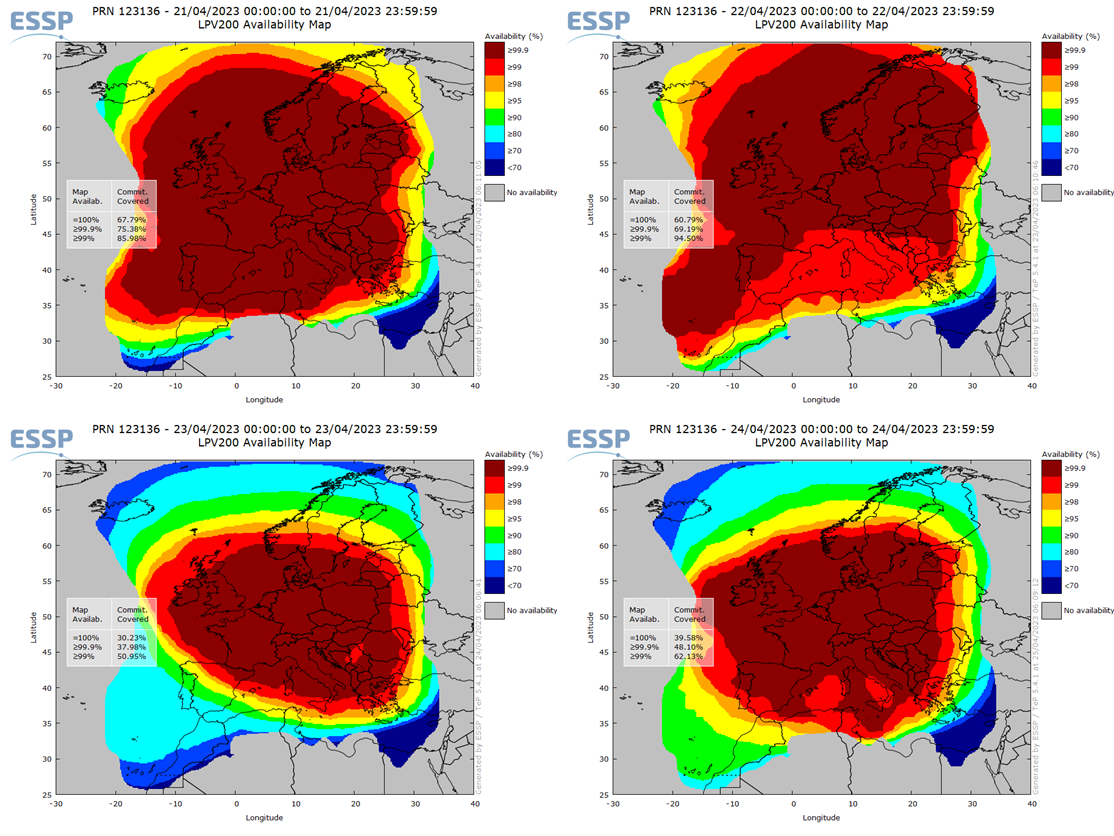
There were plenty of other space weather effects. The solid ICME pushed the magnetopause so far inwards, i.e. to the Earth, that geostationary satellites such as GOES briefly became exposed to the turbulent solar wind during their noon passage (between the Earth and the Sun) on 23 April between 18 and 21UTC (see the online version of this article for the related graph). No problems have been reported so far from these "magnetopause crossings". The minor solar radiation storm (proton event) resulted in some moderate disturbances in the high frequency (HF) radio communication, the so-called Polar Cap Absorption. Civil aviation got quite heavily impacted with PECASUS (https://pecasus.eu/ ) operators sending out as many as 18 advisories for HF Com during the 23-25 April timeframe (see also this STCE newsflash at https://www.stce.be/content/space-storm-alarm-0 ). Most of those (11) were for Post-Storm Depression of the HF frequencies, i.e. that not all frequencies were available during this period. This reflected again a highly disturbed ionosphere, highlighting the strong negative phase of the associated ionospheric storm at high- and mid-latitudes (ROB/GNSS at http://gnss.be/ ; map ; STCE newsitem at https://www.stce.be/news/640/welcome.html ). The disturbed ionosphere also affected Global Navigation Satellite Systems (GNSS) based applications for the civil aviation (another 7 advisories...). As can be gauged from the imagery underneath covering the period 21 to 24 April, some of these applications did not reach their typical availability over Europe (EGNOS - https://egnos-user-support.essp-sas.eu/ ) while the geomagnetic storm was ongoing. Red/brown colours mean good availability, blue means significantly degraded availability. LPV-200 (Localizer Performance with Vertical guidance) delivers accurate information on an aircraft’s approach to a runway with the use of GNSS positioning technology. The result is lateral and angular vertical guidance without the need for visual contact with the ground until an aircraft is 200 feet (60 meters) above the runway (see EUSPA - https://www.euspa.europa.eu/news/egnos-lpv-200-enables-safer-aircraft-landings ).
EUI observes elephants and mice?
EUI observes both the elephants and the mice among solar eruptions
Big explosions on the sun involve eruptions of light or mass, and are called either 'solar flares' or 'coronal mass ejections'. Both types of eruptions are caused by magnetic reconnection, a sort of short circuit between the magnetic loops in the outer solar atmosphere, which is called the corona. In this process, mass is accelerated and light escapes, thereby leaving the magnetic loops in a more stable configuration.
Solar flares and coronal mass ejections are the largest releases of energy in the solar system, they are like the elephants in the zoo of coronal dynamics.
On March 3 2023, the EUI telescope on Solar Orbiter was able to catch the miniature version of such flares and mass ejections. Thanks to sharp and fast imaging of the EUI telescope, researchers could observe magnetic reconnection taking place repeatedly on very small scales.
As compared to the gigantic ‘elephant’ eruptions, the observed mini-explosion is like a mouse in the zoo of coronal dynamics.
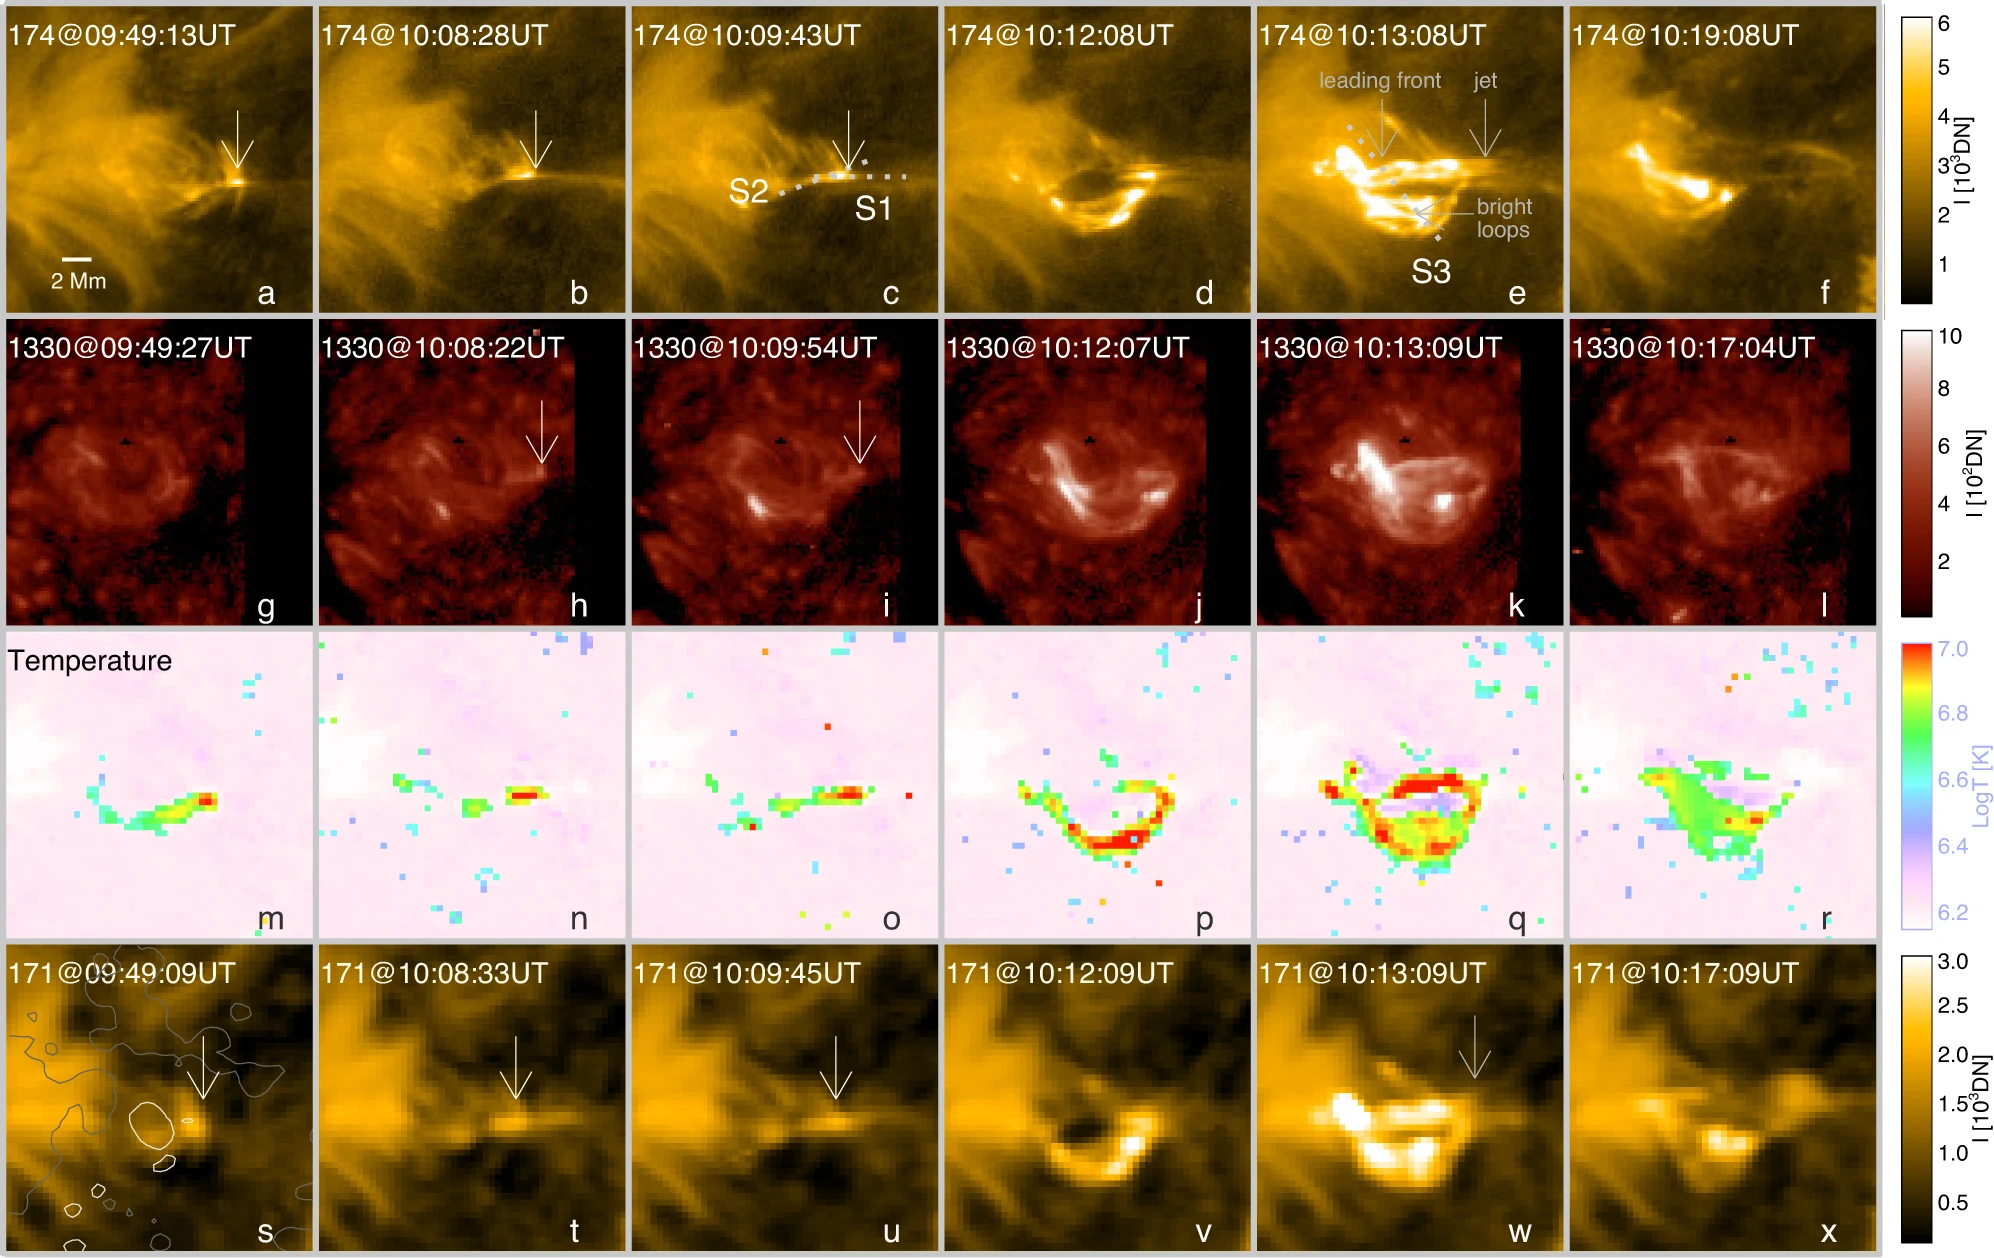
The picture is a time sequence of re-structuring magnetic loops. The spatial scale is very small compared to observations of elephant eruptions.
Scale invariance
The elephants and the mice are a representation of what scientists call ‘scale invariance’: you see the same things whether you are looking at large or small size, be it mammals in the zoo or magnetic reconnection in the solar atmosphere.
We suspect that the tiny mini-explosions continuously pump heat into the solar environment and atmosphere. This scientific insight could help us to understand why the solar corona is at several million degrees, while the solar surface is 'only' at a few thousands degrees.
These observations were published in the prestigious journal Nature Communication: https://www.nature.com/articles/s41467-023-37888-w
More on the ESA website: https://www.esa.int/ESA_Multimedia/Videos/2023/04/Tiny_magnetic_episodes_may_have_large_consequences_on_the_Sun
Gigantic eruption, an elephant: https://www.stce.be/content/press-release-unique-images-solar-cloud
First eclipse of the year observed by PROBA2
In the early hours of April 20 a solar eclipse took place. This was a hybrid solar eclipse, where first there is a total eclipse, which is then followed by an annular eclipse. This rare phenomenon is caused by the curvature of the Earth.
Regions on Earth that saw, at least, a partial eclipse include parts of South/East Asia, Australia, and Antarctica. This meant that only a very small fraction of the world's population was able to witness this event.
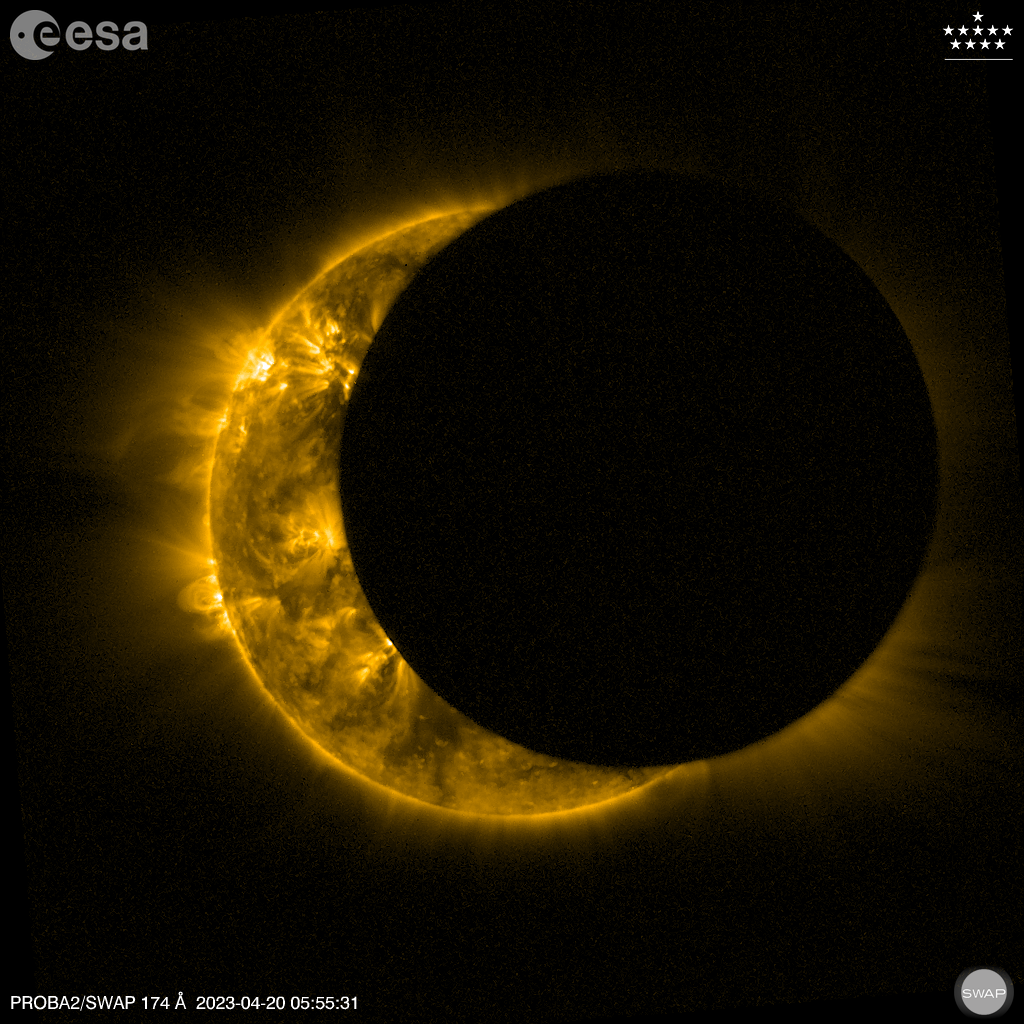
Even if it was a difficult eclipse to observe from the ground, PROBA2 had a front-row seat! Our EUV-telescope SWAP was able to register no less than 5 passages of the Moon in its field-of-view. Of those 5 passages, there were only 3 where the Moon actually moved in front of the solar disk. We then speak of an occultation. These were also closely observed by our LYRA instrument.
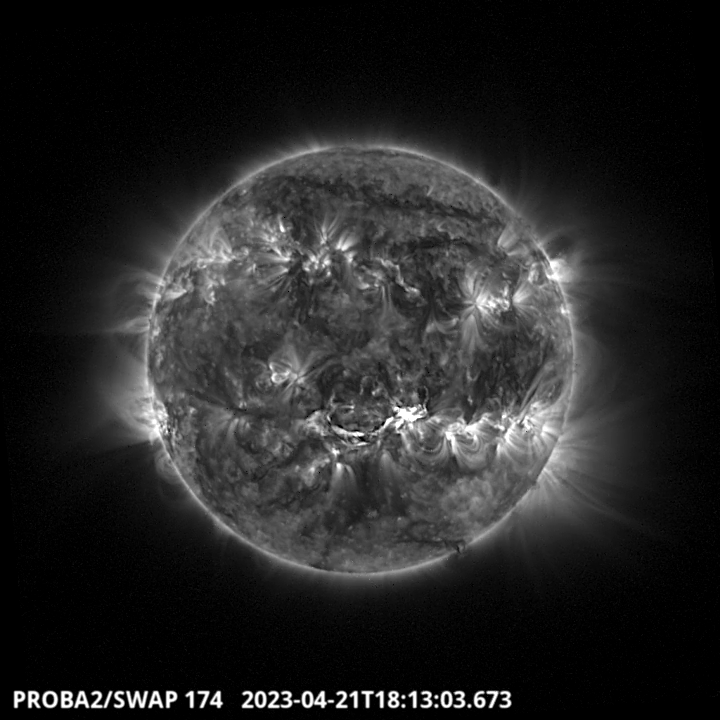
Below is the SWAP image taken when the largest part of the solar disk was covered. Click on this link to see the full SWAP movie for this event: https://proba2.sidc.be/Events//2023-Apr-20-SolarEclipse/movies/swap_eclipse_2023_04_20_logos_lossless.mp4
Review of solar activity
Flares
The solar flaring activity throughout the week was mostly at low levels with moderate levels being briefly reached on April 21st with a single low M-class flare.
There were eleven numbered active regions on the visible solar disc, most of them relatively simple. The largest and most complex region was NOAA 3282 which varied its magnetic complexity between magnetic type beta and beta-gamma. Despite its complexity this active region produced only occasional low C-class flares. The most active region throughout the week was NOAA AR 3283 (beta), which produced the strongest flare, namely a long-lasting M1.7 flare with start time 17:44 UTC, peak time 18:12 UTC, end time 18:37 UTC on April 21st. The flare was triggered by a neighbouring filament eruption. The remaining regions were either quiet and magnetically simpler or produced occasional low levels of flaring activity.
Solar wind disturbances: coronal mass ejections
The solar surface was streaked by filaments and multiple eruptions were observed, most of which did not result in an Earth-directed coronal mass ejection (CME). One filament residing on the central meridian relatively close to the disc centre was anchored in the foot point of NOAA AR 3283 and its eruption triggered the long duration M1.7 flare, which resulted in a full halo CME first seen by LASCO/C2 at 18:12 UTC on April 21st. The estimated projected velocity of the CME was around 1100 km/s and the estimated arrival time was late April 23rd to early April 24th.
Energetic particles near Earth
The greater than 10 MeV GOES proton flux was at nominal levels throughout most of the week. Slightly enhanced levels were observed on April 22nd with and minor radiation storm levels (S1) were exceeded around 18 UTC on April 23rd most probably due to particle acceleration at the shock of the expected ICME. The enhancements gradually declined throughout the night of April 23rd and the greater than 10 MeV GOES proton flux returned back to nominal levels on April 24th.
The greater than 2 MeV electron flux was below the 1000 pfu threshold throughout the entire the week. The corresponding electron fluence was at nominal levels.
Review of geomagnetic activity
Solar wind at L1
The solar wind parameters at the beginning of the week were at background slow solar wind levels until April 18th when they registered a mild ICME arrival, related to one of the two filament eruptions on April 15th giving rise to a partial halo CME, around 11 UTC and after 23 UTC. The interplanetary magnetic field was enhanced to 18.7 nT with a minimum Bz component of - 7.5 nT. The solar wind speed briefly exceeded 600 km/s before UTC midnight on April 18th and declined back to background slow solar wind levels by April 20th.
Mild high speed stream arrivals were expected at the beginning and towards the end of the week, but only a sector boundary crossing was registered on April 21st. The solar wind parameters remained at mostly background levels until the next awaited ICME arrival on April 23rd.
A rather weak shock was registered in the solar wind parameters around 13:20 UTC on April 18th as a precursor of an ICME arrival.
A significant fast forward shock was observed in the solar wind at 17:00 UTC on April 23rd marking the expected arrival of the ICME. The interplanetary magnetic field jumped from 9 nT to 26 nT with Bz reaching -24 nT. The solar wind velocity increased from 360 km/s to 480 km/s and the density jumped from 4.8 ppcc to 16.8 ppcc. The solar wind speed around 17:45 UTC has reached 527 km/s. Later on, as the ICME arrival continued the solar wind velocity exceeded 650 km/s with strong interplanetary magnetic field reaching values up to 35 nT and strong negative Bz dow to -33.3 nT. The solar wind density exceeded 32 ppcc and the temperature went above 1 MK.
Geomagnetic conditions
The geomagnetic conditions varied significantly throughout the week. They started at quiet to unsettled levels until the first ICME arrival on April 18th, when globally active conditions were registered and locally over Belgium a few intervals of minor storm levels were reached. Quiet to active conditions were registered throughout Aril 19th and mostly quiet to unsettled conditions prevailed until the next ICME arrival on April 23rd. Active geomagnetic conditions were detected with the arrival of the first ICME precursor around UTC noon on April 23rd, which quickly escalated to minor storm levels and globally reached severe storm levels with the arrival of the significant ICME shock at 17 UTC. Locally over Belgium only major and moderate storms were observed.
PROBA2 Observations (17 Apr 2023 - 23 Apr 2023)
Solar Activity
Solar flare activity fluctuated from low to moderate during the week.
In order to view the activity of this week in more detail, we suggest to go to the following website from which all the daily (normal and difference) movies can be accessed: https://proba2.oma.be/ssa
This page also lists the recorded flaring events.
A weekly overview movie (SWAP week 682) can be found here: https://proba2.sidc.be/swap/data/mpg/movies/weekly_movies/weekly_movie_2023_04_17.mp4.
Details about some of this week's events can be found further below.
If any of the linked movies are unavailable they can be found in the P2SC movie repository here: https://proba2.oma.be/swap/data/mpg/movies/.
Thursday April 20

On 2023-Apr-20 a total solar eclipse as seen from Earth was observed by SWAP and LYRA as three partial solar eclipses. The SWAP image above was taken during the third partial occultation.
Find a movie of the event here: https://proba2.sidc.be/Events/2023-Apr-20-SolarEclipse/movies/swap_eclipse_2023_04_20_logos_lossless.mp4
Further images are available here: https://proba2.sidc.be/Events/2023-Apr-20-SolarEclipse/
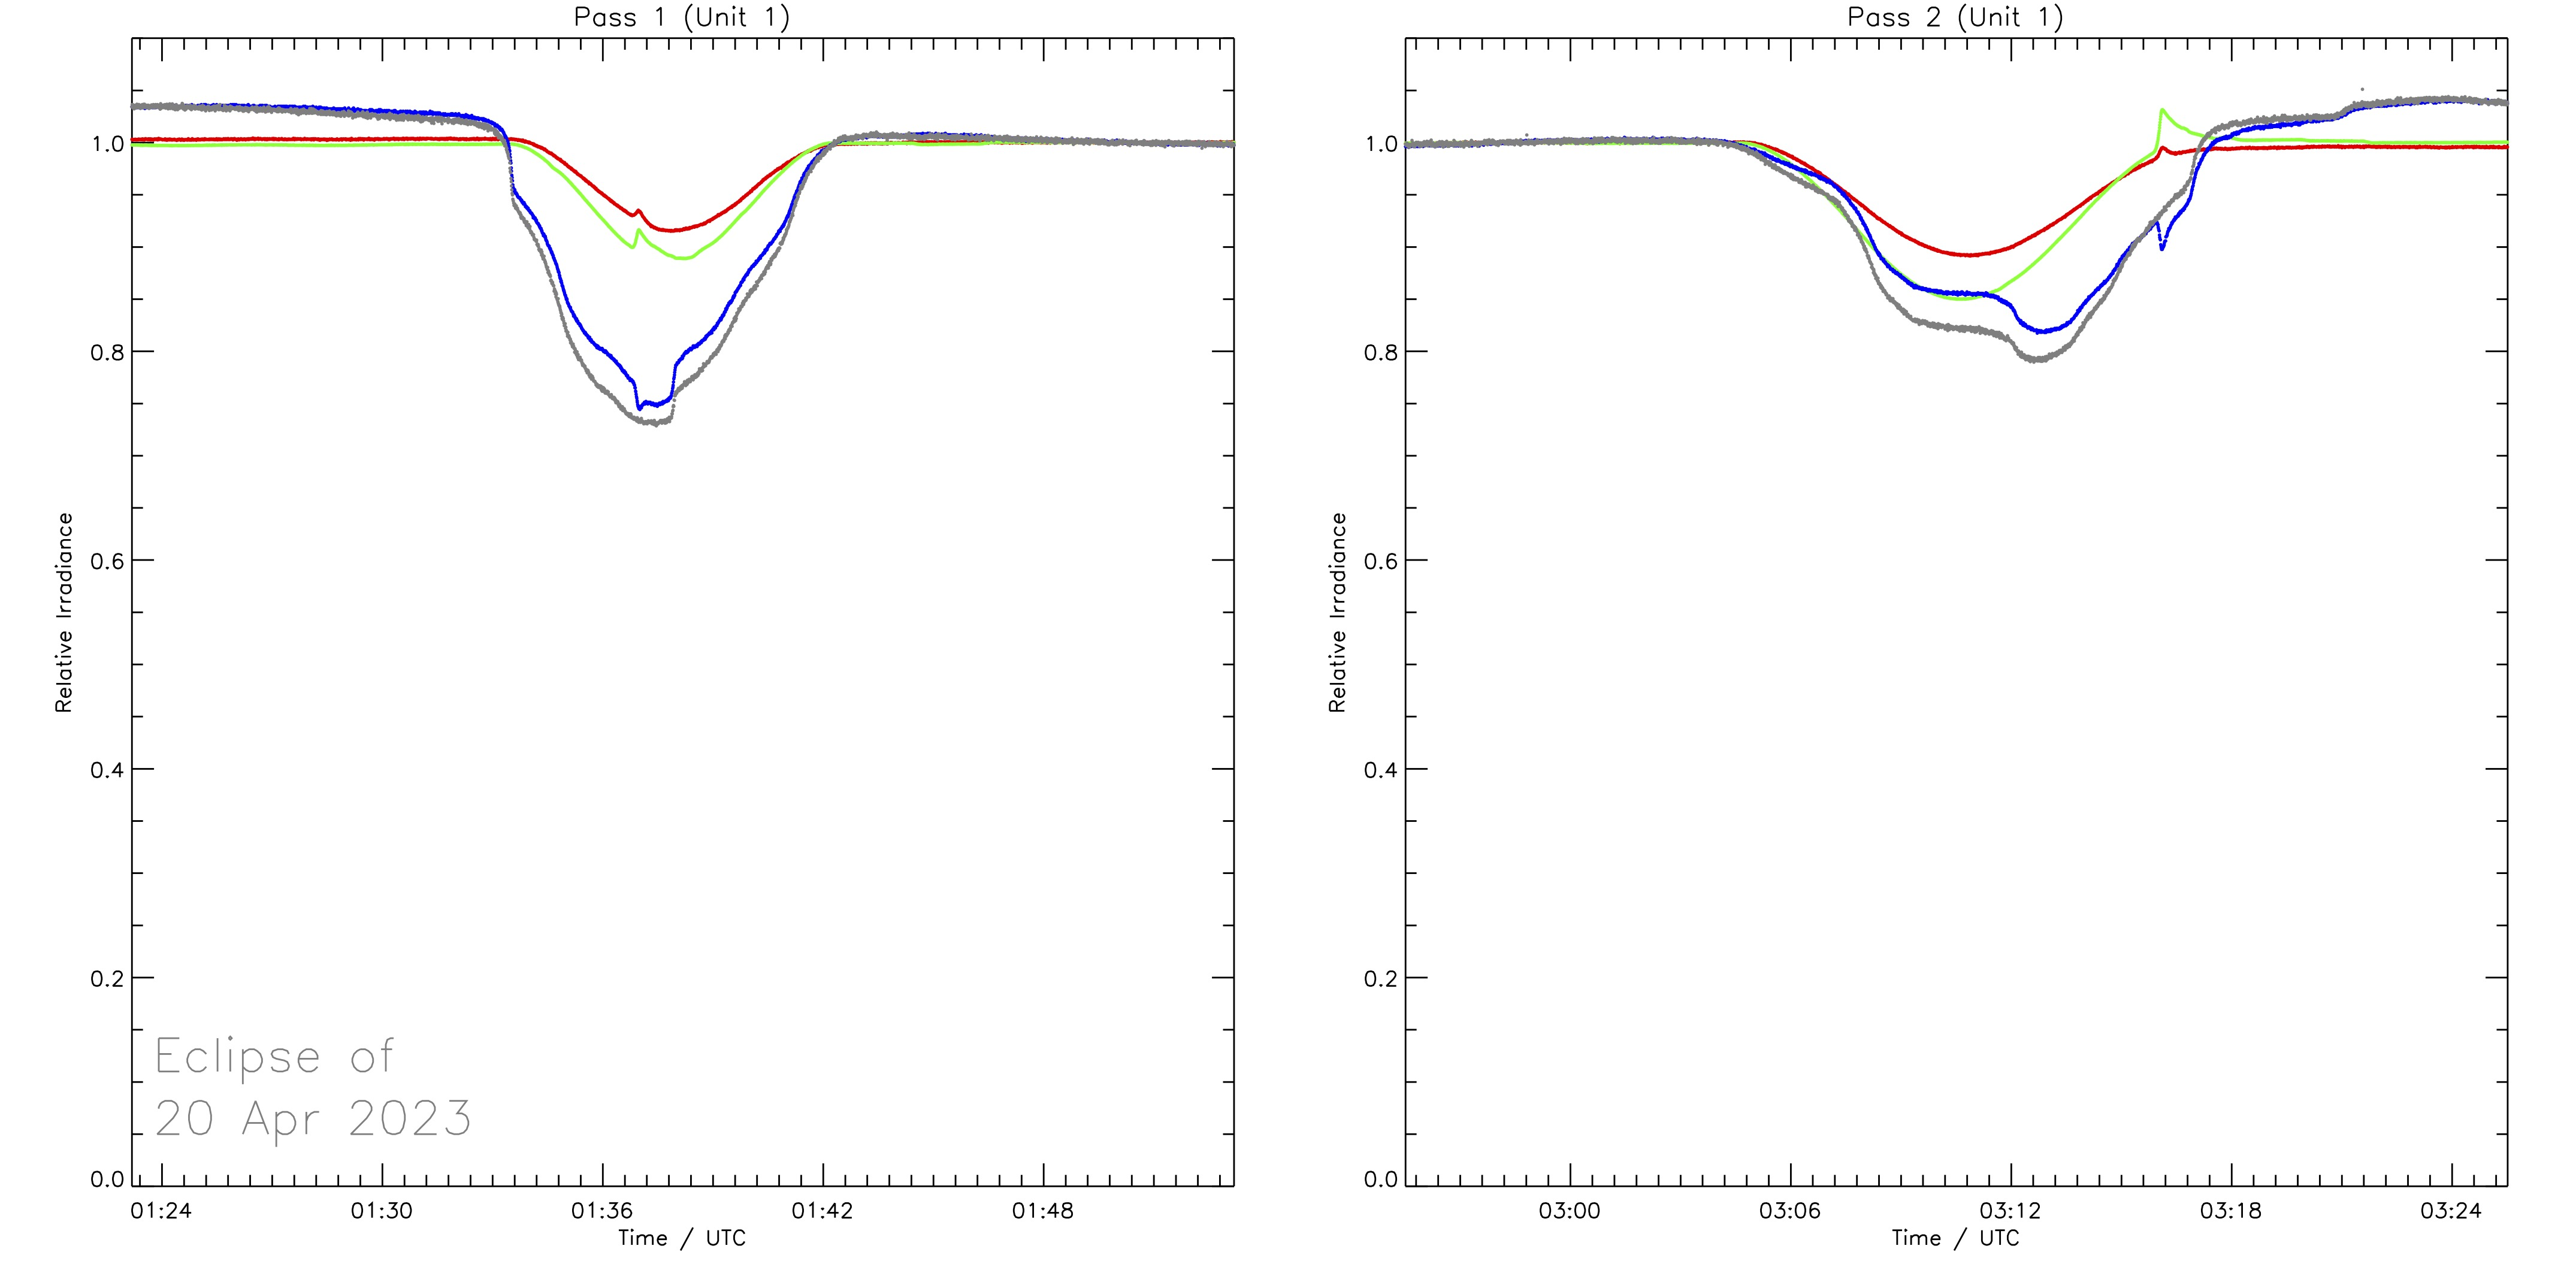
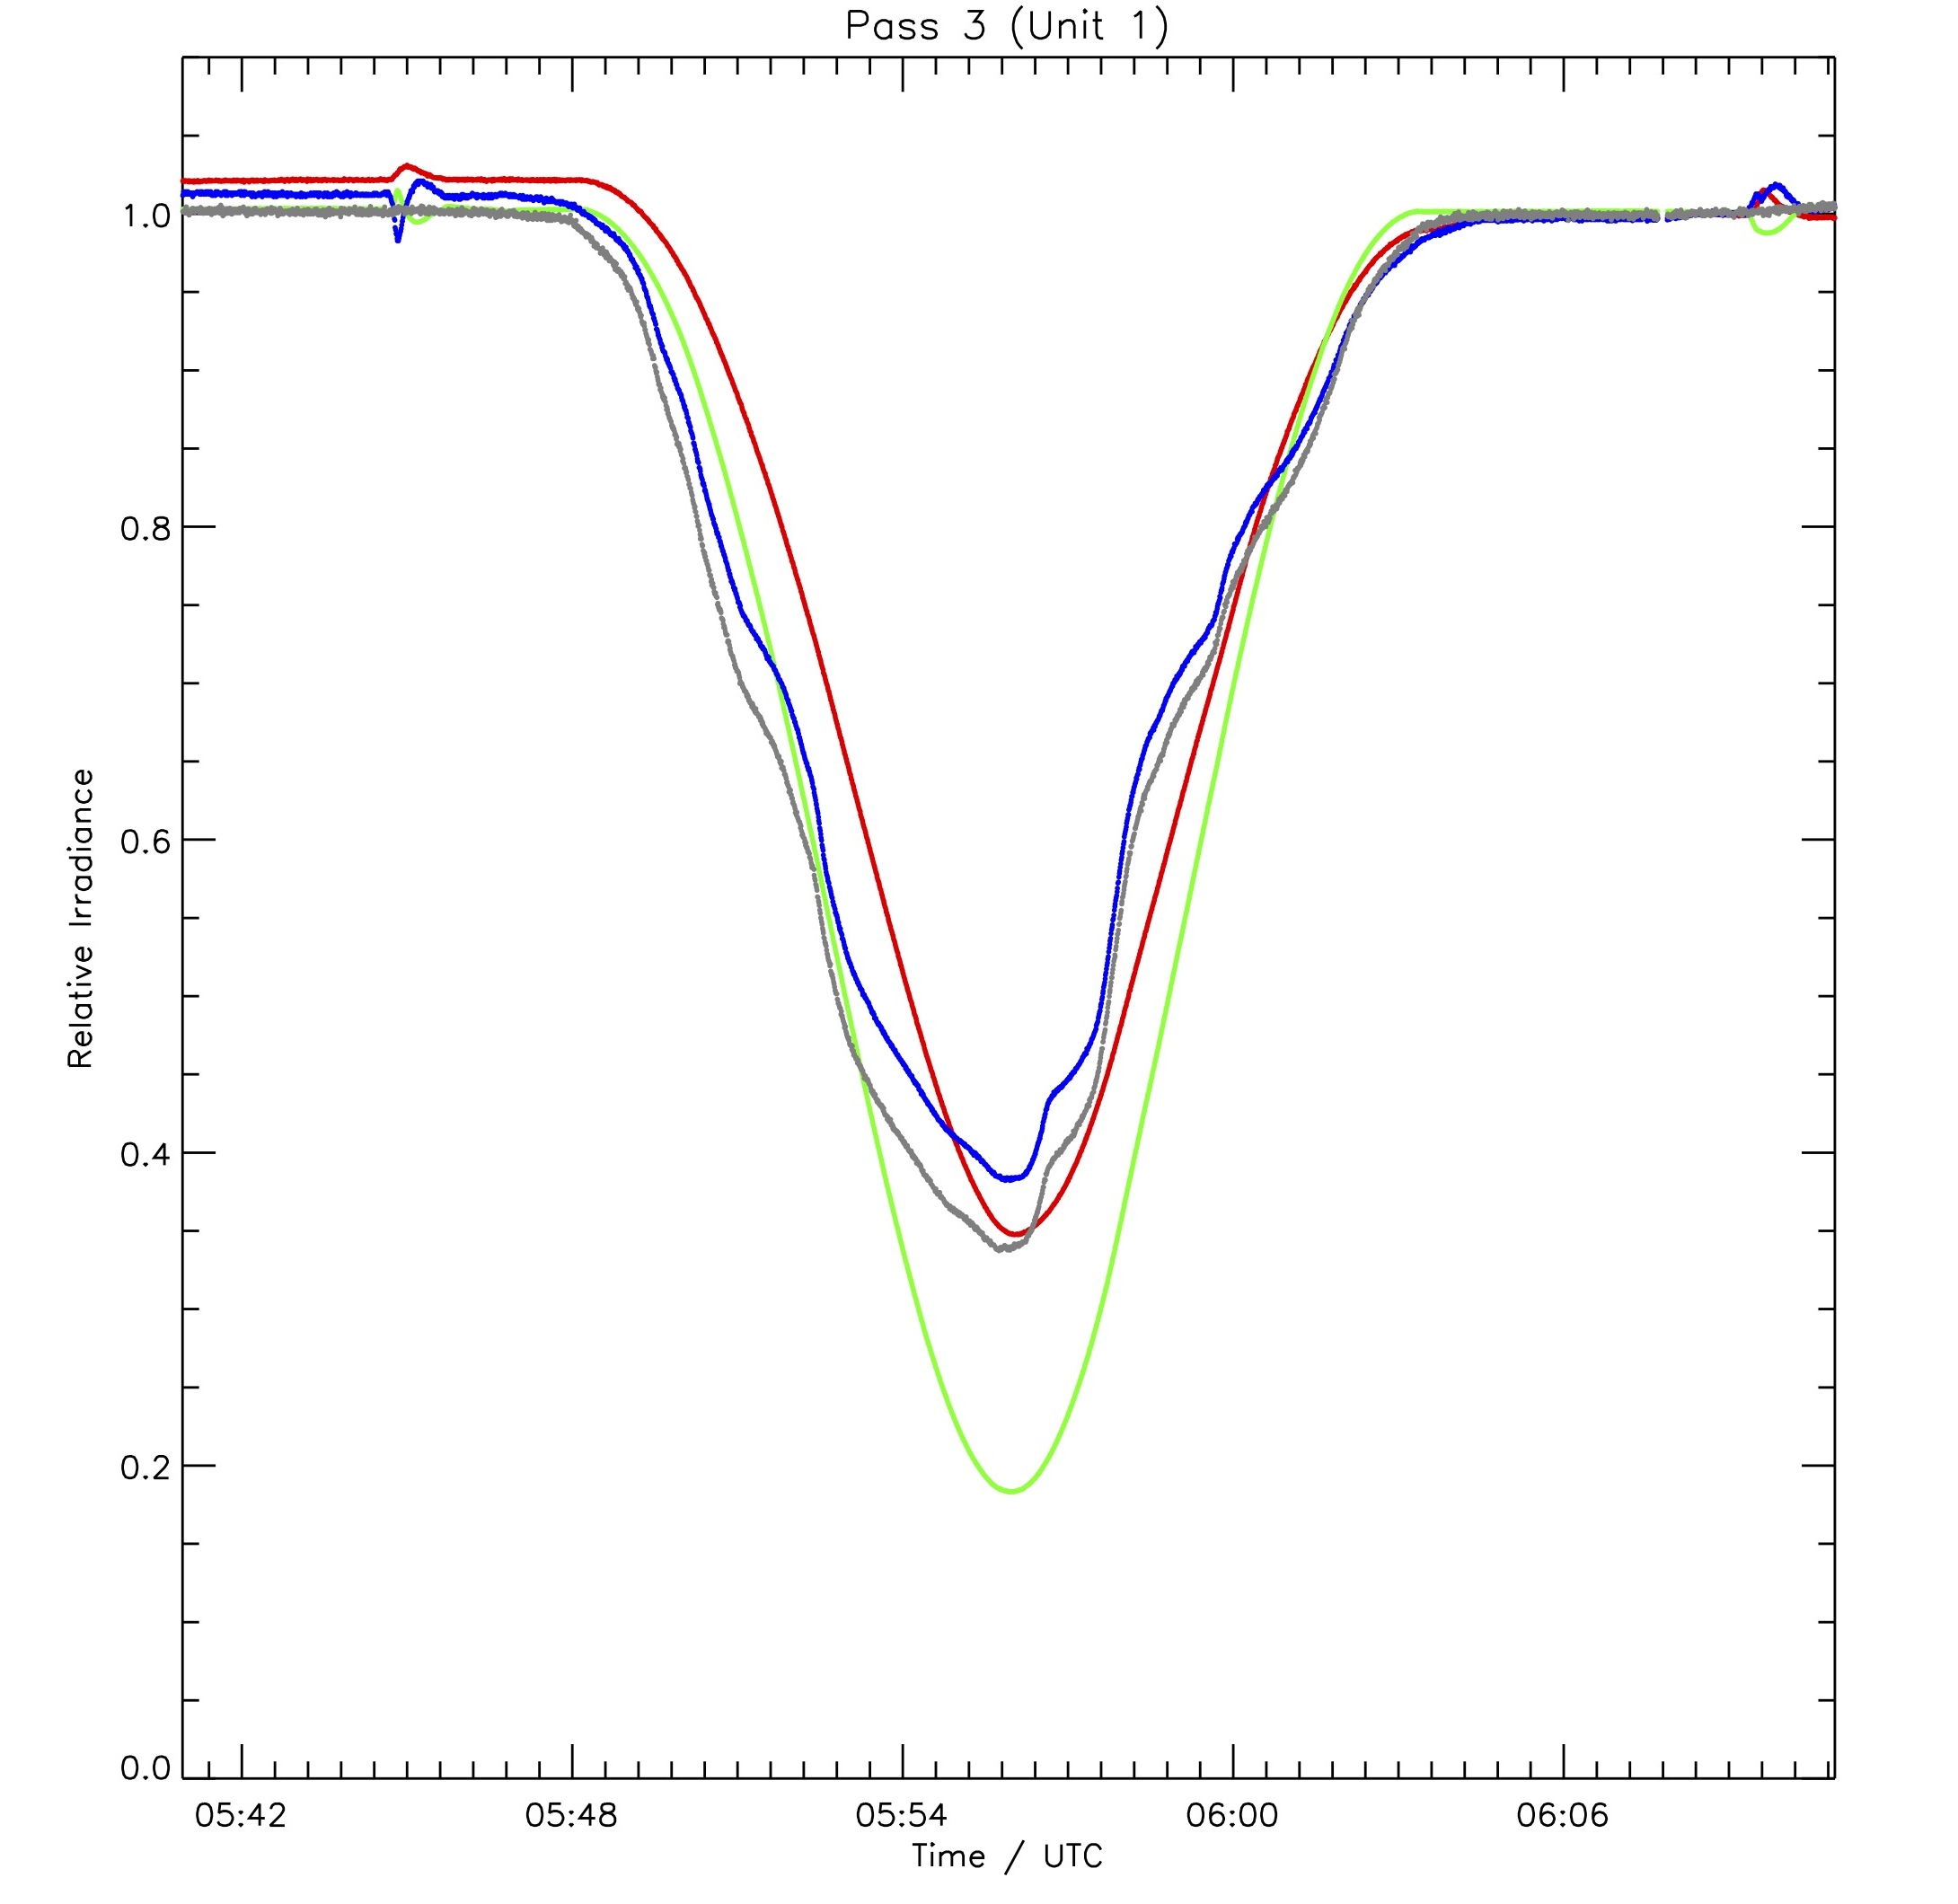
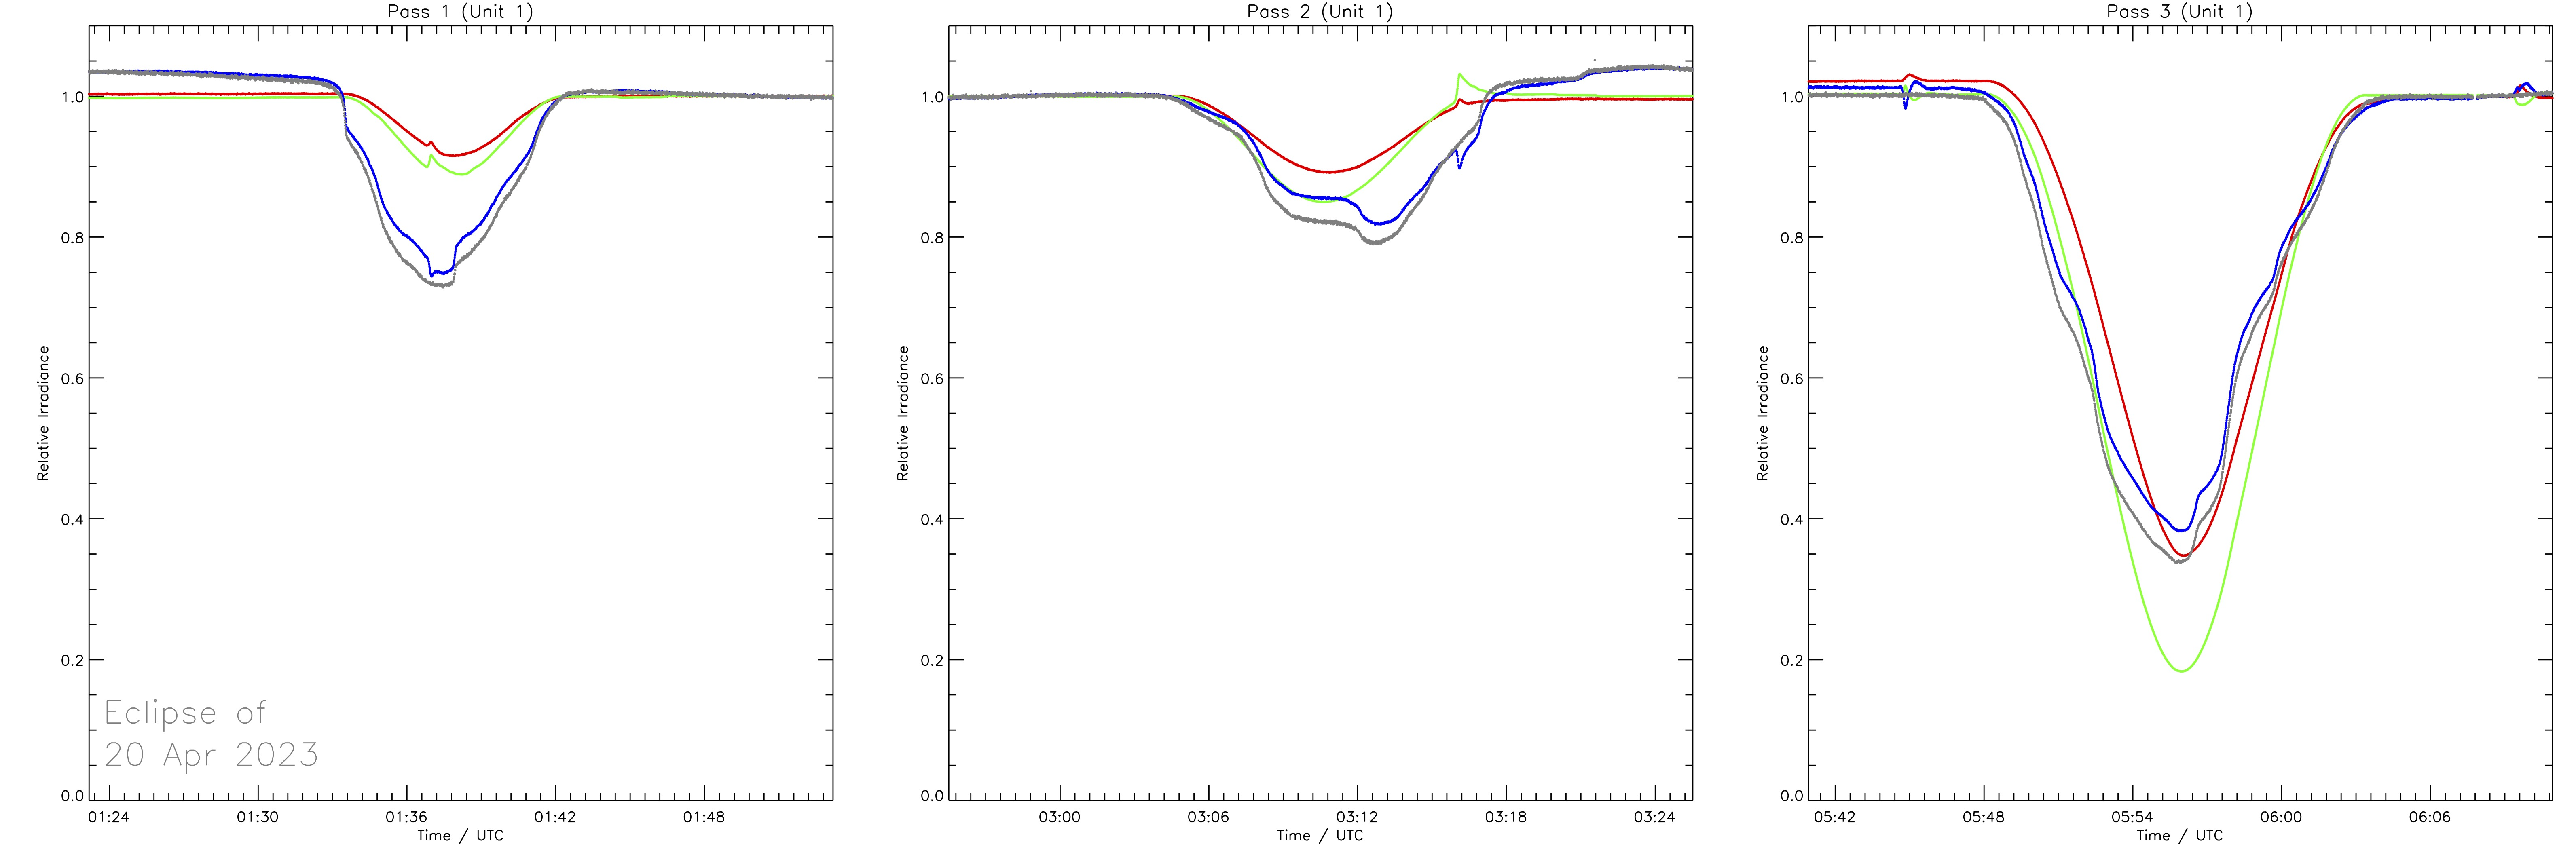
The occultations were also observed by LYRA's "calibration unit" (unit 1) in addition to the nominal one (unit 2). The plots above show normalized observations by LYRA during the three passes in the eclipse zone. During the third pass (bottom panel), the Moon was covering the Sun the most, hence the deeper decrease in irradiance as compared to the other two curves/passes (top panels). The colors correspond to the observations by the four channels of LYRA: red = Lyman-alpha, green = Herzberg, blue = Aluminum, black = Zirconium.
Friday April 21
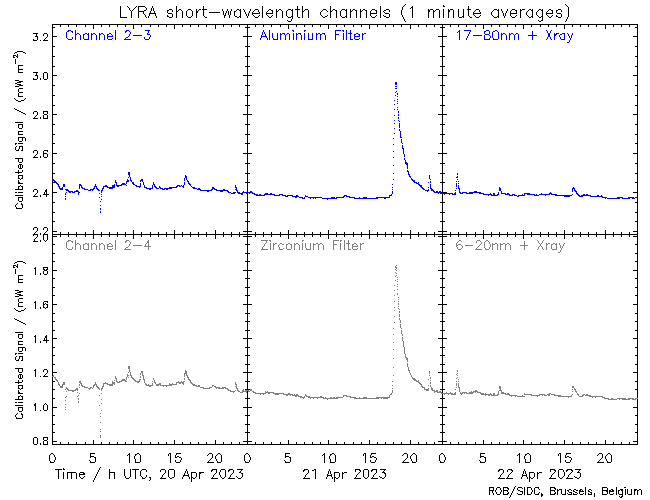
The largest flare of the week, an M1.7, was observed by LYRA (top panel) and SWAP (bottom panel). The flare occurred on 2023-Apr-21 (peak at 18:12 UT) close to the center of the Sun, and it was associated with NOAA AR3283.
Find a SWAP movie of the event here: https://proba2.sidc.be/swap/movies/20230421_swap_movie.mp4
International Sunspot Number by SILSO
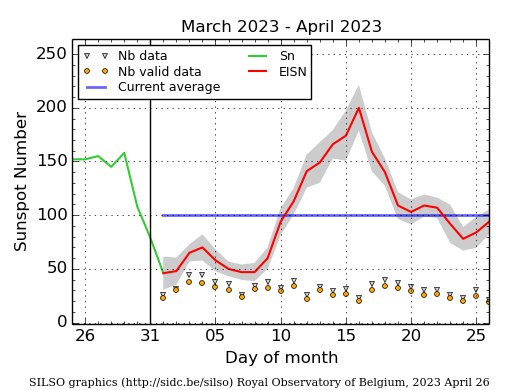
The daily Estimated International Sunspot Number (EISN, red curve with shaded error) derived by a simplified method from real-time data from the worldwide SILSO network. It extends the official Sunspot Number from the full processing of the preceding month (green line), a few days more than one solar rotation. The horizontal blue line shows the current monthly average. The yellow dots give the number of stations that provided valid data. Valid data are used to calculate the EISN. The triangle gives the number of stations providing data. When a triangle and a yellow dot coincide, it means that all the data is used to calculate the EISN of that day.
Noticeable Solar Events
| DAY | BEGIN | MAX | END | LOC | XRAY | OP | 10CM | TYPE | Cat | NOAA |
| 21 | 1744 | 1812 | 1844 | S22W11 | M1.7 | 2N | 110 | II/3V/3IV/2 | 61 | 3283 |
| LOC: approximate heliographic location | TYPE: radio burst type |
| XRAY: X-ray flare class | Cat: Catania sunspot group number |
| OP: optical flare class | NOAA: NOAA active region number |
| 10CM: peak 10 cm radio flux |
Geomagnetic Observations in Belgium
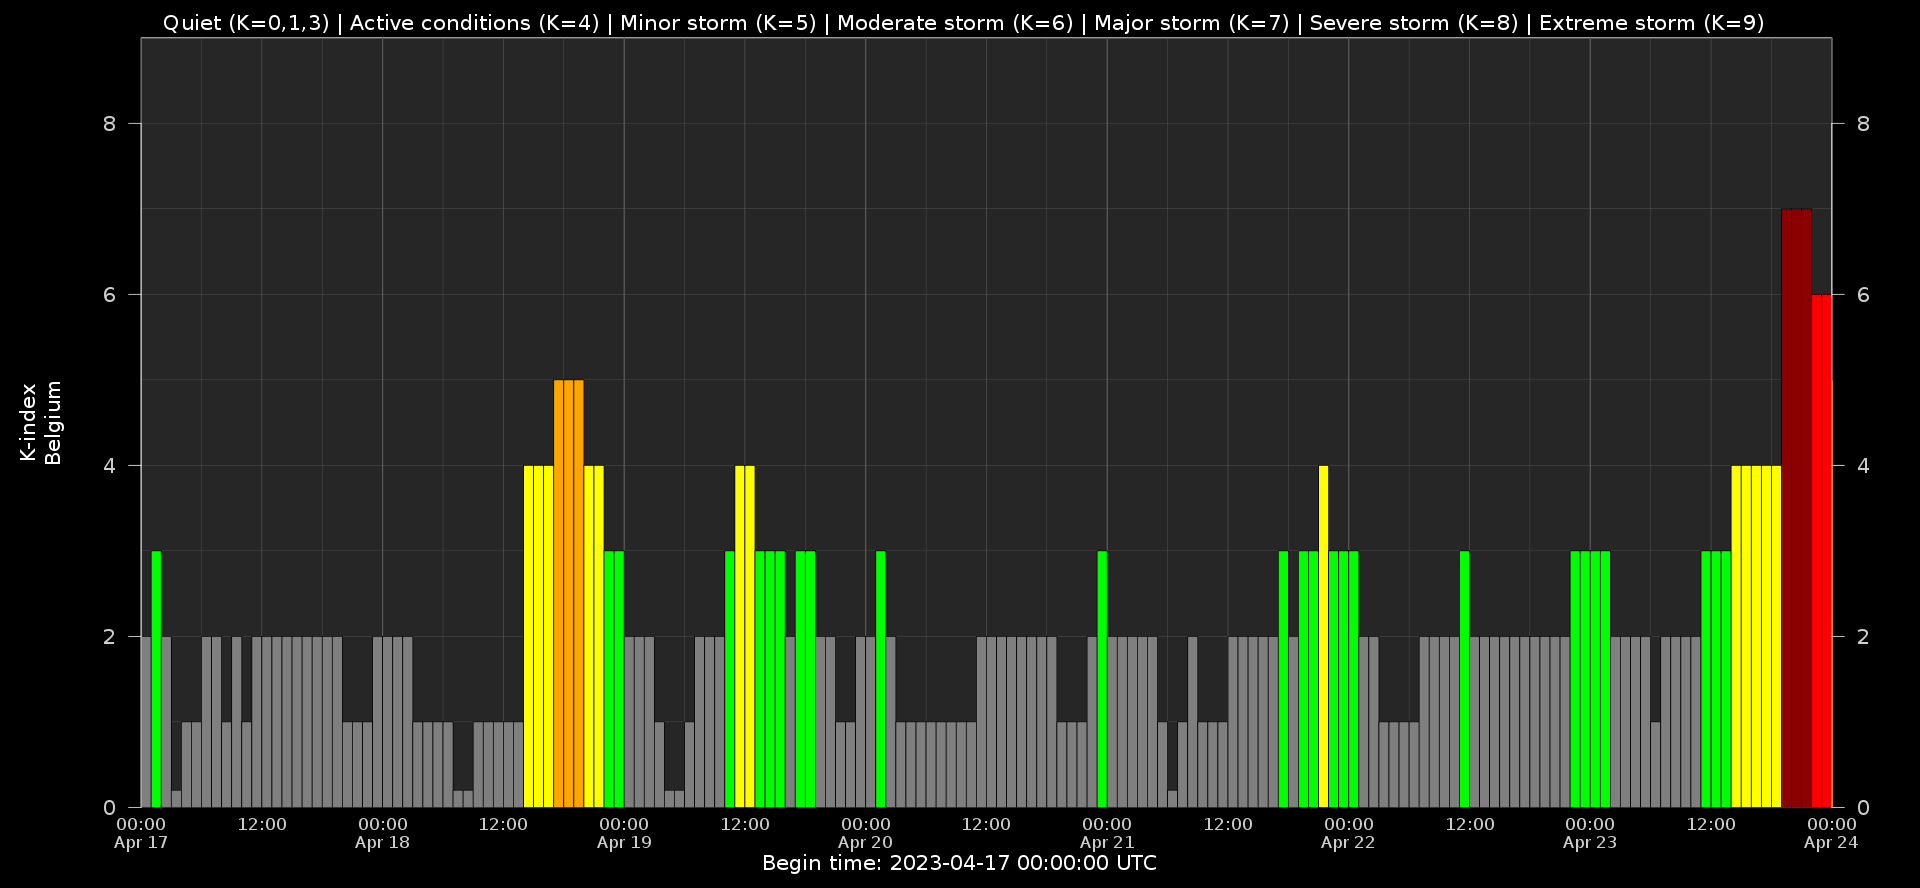
Local K-type magnetic activity index for Belgium based on data from Dourbes (DOU) and Manhay (MAB). Comparing the data from both measurement stations allows to reliably remove outliers from the magnetic data. At the same time the operational service availability is improved: whenever data from one observatory is not available, the single-station index obtained from the other can be used as a fallback system.
Both the two-station index and the single station indices are available here: http://ionosphere.meteo.be/geomagnetism/K_BEL/
The SIDC Space Weather Briefing
The Space Weather Briefing presented by the forecaster on duty from to . It reflects in images and graphs what is written in the Solar and Geomagnetic Activity report: https://www.stce.be/briefings/20230424_SWbriefing.pdf
If you need to access the movies, contact us: stce_coordination at stce.be
Review of ionospheric activity
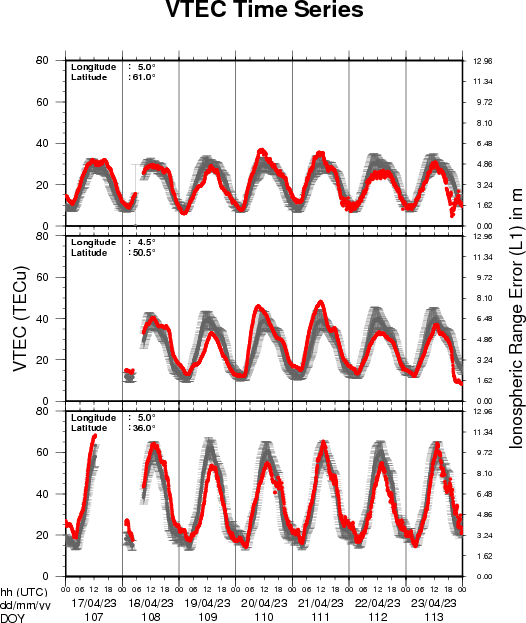
The figure shows the time evolution of the Vertical Total Electron Content (VTEC) (in red) during the last week at three locations:
a) in the northern part of Europe(N 61deg E 5deg)
b) above Brussels(N 50.5deg, E 4.5 deg)
c) in the southern part of Europe(N 36 deg, E 5deg)
This figure also shows (in grey) the normal ionospheric behaviour expected based on the median VTEC from the 15 previous days.
The VTEC is expressed in TECu (with TECu=10^16 electrons per square meter) and is directly related to the signal propagation delay due to the ionosphere (in figure: delay on GPS L1 frequency).
The Sun's radiation ionizes the Earth's upper atmosphere, the ionosphere, located from about 60km to 1000km above the Earth's surface.The ionization process in the ionosphere produces ions and free electrons. These electrons perturb the propagation of the GNSS (Global Navigation Satellite System) signals by inducing a so-called ionospheric delay.
See http://stce.be/newsletter/GNSS_final.pdf for some more explanations ; for detailed information, see http://gnss.be/ionosphere_tutorial.php
Agenda
Check out our activity calendar: activities and encounters with the Sun-Space-Earth system and Space Weather as the main theme. We provide occasions to get submerged in our world through educational, informative and instructive activities.
If you want your event in our calendar, contact us: stce_coordination at stce.be
* April 27, KUL/CmPA seminar: Why do we even care? Space weather effects 101, 200B 02.16 and online, Leuven, Belgium
* April 28, STCE seminar: Space Weather Tools in Support of Space Radiation Operations, Nicolet@spacepole and Teams, Brussels, Belgium
* May 4, STCE seminar: The impact of Multiple Eruptions from Active Region 10930 on the Broad Geospace System, Nicolet@spacepole and Teams, Brussels, Belgium
* May 16, KUL/CmPA seminar: Magnetohydrodynamic modelling of Alfvén waves in the solar corona, 200B 02.16 and online, Leuven, Belgium
* May 22-24, STCE Space Weather Introductory Course, Brussels, Belgium - FULL
* May 25, STCE seminar: Comparative study of a constant-alpha force-free field and its approximations in an ideal toroid, Meridian room@spacepole and zoom, Brussels, Belgium
* May 25, RMI Seminar: Towards a new hydrometeors identification tool at the RMI, conference room of the RMI, Brussels, Belgium
* May 29 - June 1, PITHIA-NRF Training School, Rome, Italy
Check: https://www.stce.be/calendar