The STCE's SC25 Tracking page has been updated to reflect the latest evolution of some critical space weather parameters for the ongoing solar cycle 25 (SC25). It covers various aspects of space weather, from sunspot numbers over geomagnetic indices all the way to cosmic rays. The multiple graphs allow for a comparison with previous solar cycles at similar stages in their evolution.
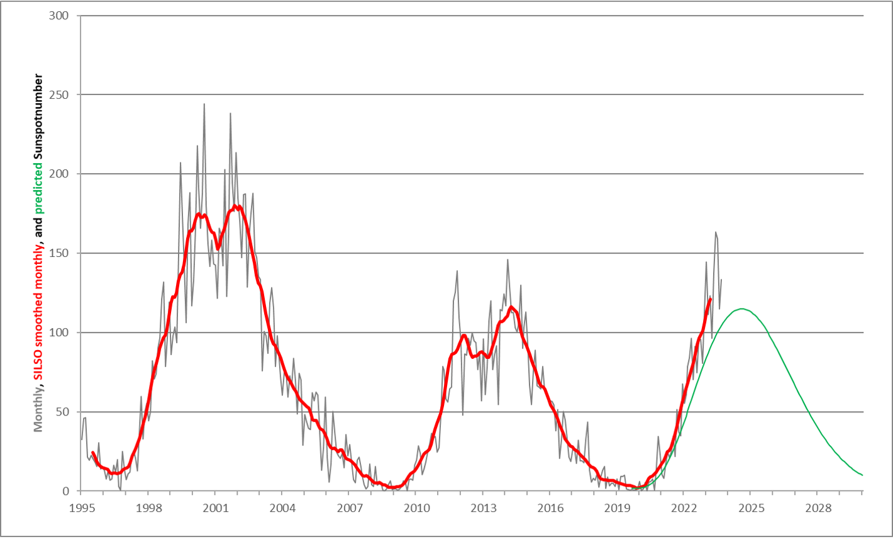
Solar activity remained enhanced with the highest (provisional) monthly sunspot numbers (SILSO) so far this solar cycle observed in June (163.4) and July (159.1) 2023. The smoothed provisional monthly sunspot number exceeded the smoothed maximum of the previous solar cycle in February 2023. Based on this surge in solar activity, the Solar Cycle Science webpage now gives a maximum for SC25 around 141 in October 2024 (best fitting curve for a single maximum). The results from the SILSO prediction methodologies (12-month window) are somewhat diverging, but favor sunspot numbers also above the ones initially predicted by the SC25 panel, i.e. well above 115. These numbers can further change pending the evolution of solar activity in the coming months. Also, there's still a good possibility that SC25 may have a similar outlook as SC24, i.e. with 2 moderate, well-separated maxima.
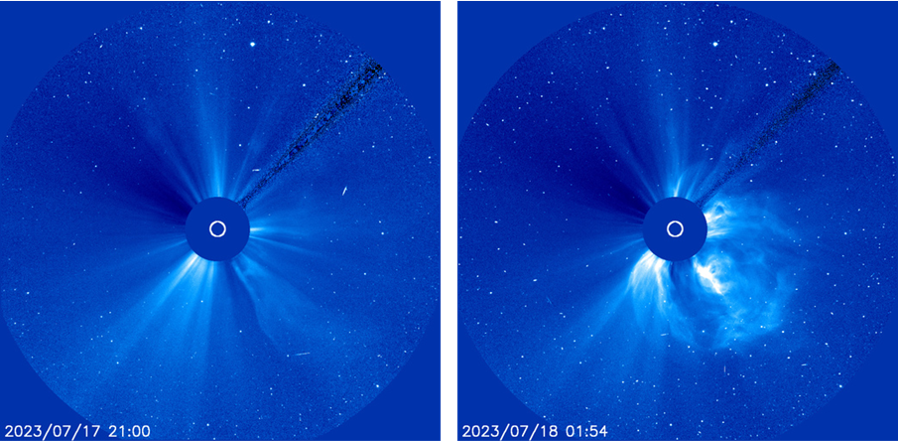
The increase in sunspot numbers was accompanied by a corresponding enhancement in other solar parameters, such as the solar radio flux and the number of solar flares. Also the smooted number of coronal mass ejections (CME) was near an average of 6/day. The first 2 moderate solar radiation storms (S2 on the NOAA scales) of SC25 were produced in July this year. The strongest proton event (620 pfu) was associated with an M5 flare produced by active region NOAA 3363 on 18 July 2023. The coronagraphic images (SOHO/LASCO) underneath show this event as an increase in noise ("white dots") in the images made by the CCD camera on board of the SOHO satellite and is due to the enhanced number of energetic protons impacting the pixels of the instrument. The image on the left was taken at 21:00 UTC about 3 hours before the M5 flare, and the image on the right was taken at 01:54 UTC about 2 hours after the flare with the proton event in full swing. The CME to the lower right was also associated with this flare.