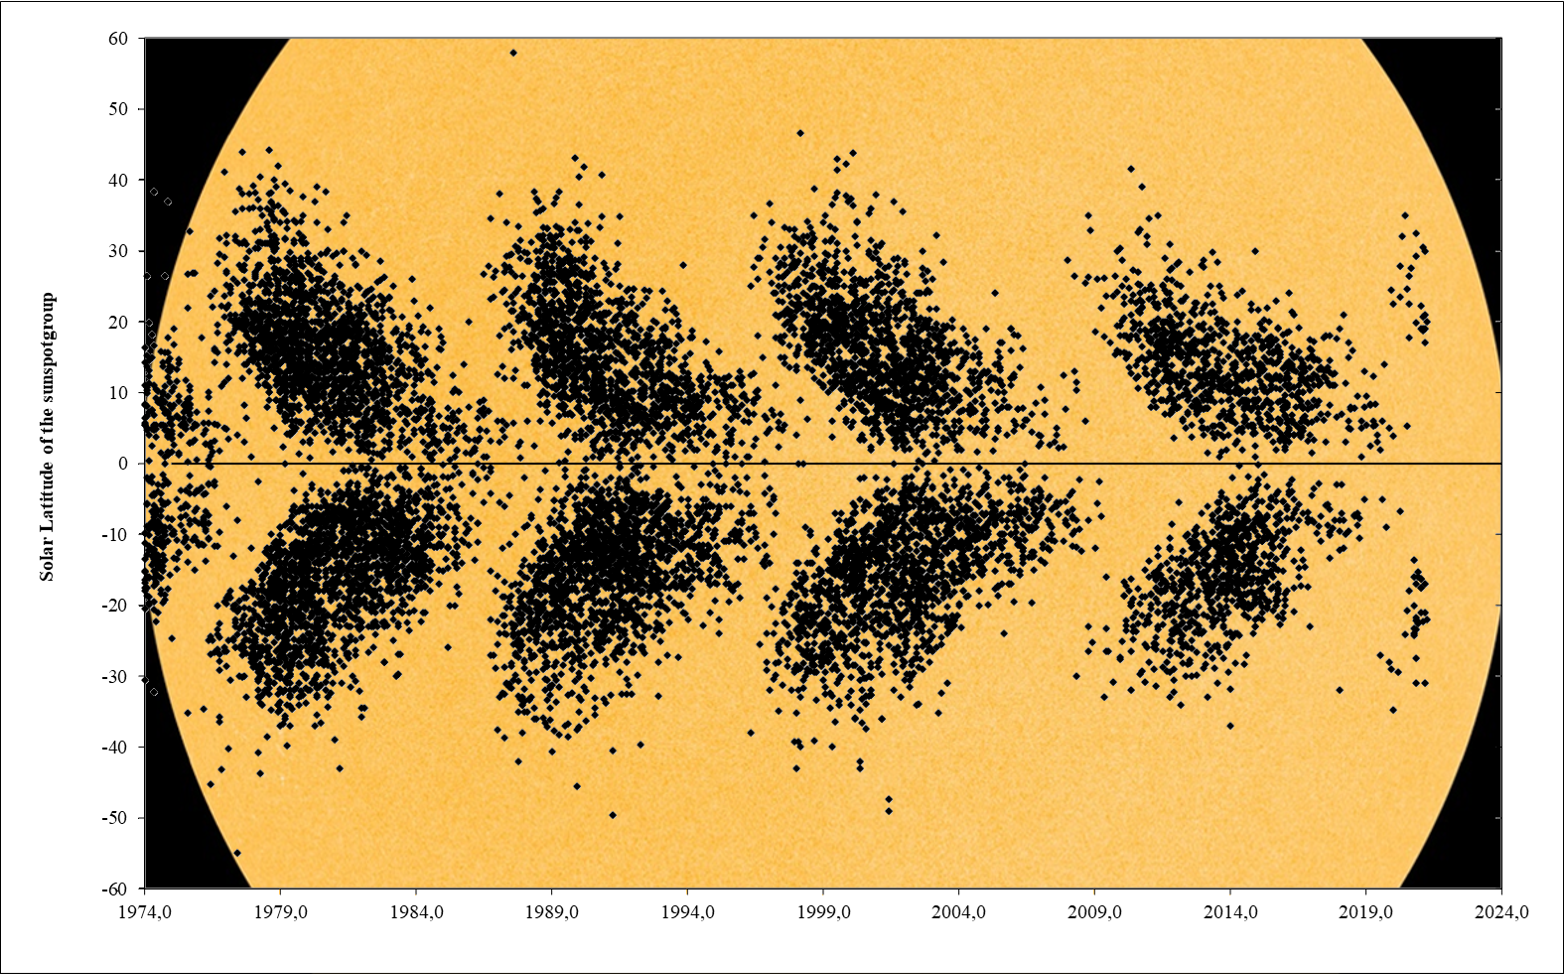
Solar cycle 25 (SC25) continues its glorious march to solar maximum, with 7 new groups both in January and March 2021. The sunspot regions were more or less evenly spread over both solar hemispheres, with a slightly more dominant southern hemisphere that has also displayed most of the largest sunspot regions so far. The distribution of the sunspot groups can be seen in the so-called butterfly diagram underneath, displaying for each month since 1974 the latitude of every individual sunspot group (NOAA number - See the Solar Cycle Science website) that has appeared. It clearly shows that during the period of solar cycle minimum, the sunspot groups appear ever closer to the solar equator, gradually becoming smaller and disappearing while the sunspots of the new solar cycle manifest themselves again at high latitudes. As the pattern resembles the wings of a butterfly, it is called a butterfly diagram. The first such butterfly diagram was published by E. Walter Maunder in the Monthly Notices of the Royal Astronomical Society in 1904. The sunspot groups that have emerged over the last few months all belong to the new SC25 and continue to reveal more of the outer tips of the new butterfly's wings. The highest latitude reached by sunspot groups in SC25 so far is 35 degrees, both in the northern (NOAA 12764, June 2020) as in the southern (NOAA 12755, January 2020) solar hemisphere.
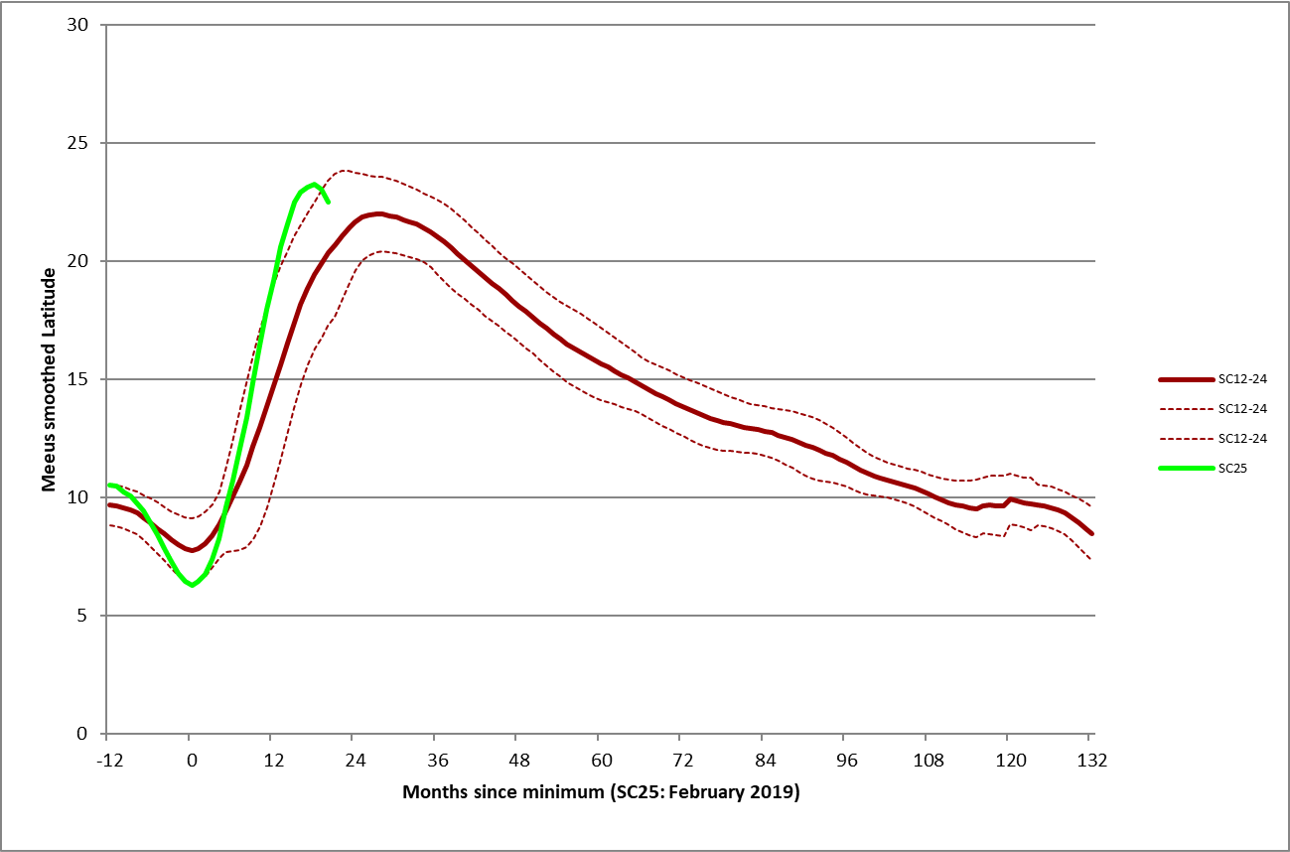
Though the sunspot region values for March/April 2021 are only preliminary/incomplete, the smoothed average latitude of the sunspot groups seems to have already reached its maximum. The graph underneath shows the smoothed average latitude of the sunspot regions from SC12 to 24 (brown; the thin dashed lines show the standard deviations), and for SC25 (green). The SC12-24 and SC25 latitudes are fit such that the months of lowest smoothed latitudes coincide (month "0"). SC25 latitude reached a minimum in February 2019 (6.3 degrees, so the active regions emerged very close to the solar equator), and seems to have peaked in August 2020 (23.3 degrees). The peak seems to have occured slightly earlier and to be slightly higher than the average SC12-14 values, but there's nothing out of the ordinary. The values can't be used for forecasting the upcoming amplitude of SC25 (no significant correlations), however, in the past, the timing when the smoothed average latitude reaches 16 degrees has been used to predict the timing of the solar cycle maximum (e.g. Schatten 2002). Based on the SC12-24 values, the smoothed average latitude descends under 16 degrees 58 months after its smoothed minimum. Also, this 16 degrees threshold happens to be reached 3 months before the solar cycle maximum (with an uncertainty of 10 months). Thus, SC25 may reach its maximum in March 2024 (February 2019 + 58 + 3 months), with an uncertainty of 10 months and assuming that the average latitude of the SC25 sunspot groups closely tracks the average SC12-24 values (brown curve). So for the moment, this sunspot latitude forecast provides only an idea of the timing of SC25 maximum, it's still a bit too early to make a firm prediction.