
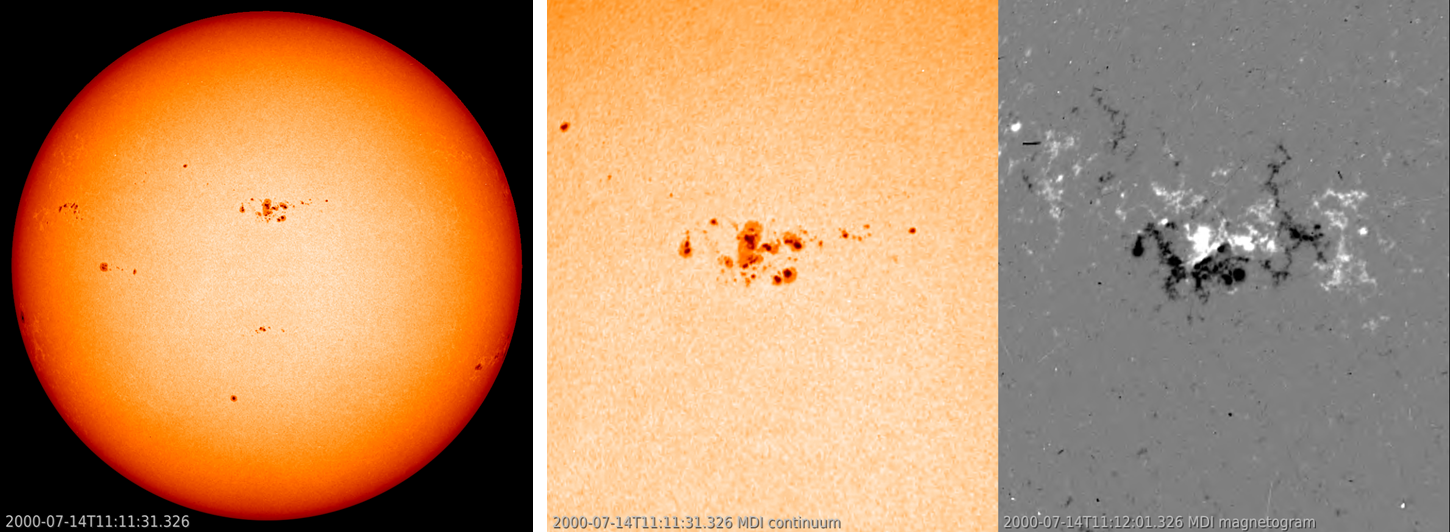
One of the most impressive solar eruptions of the 23rd solar cycle (SC23) took place on 14 July 2000. The eruption was aptly called the Bastille Day event, for the French national holiday. The source was active region NOAA 9077, located near the solar disk's centre (still). It was a moderate-sized region with a surface area of about 5 times the total surface area of the Earth. However, the region had a complex magnetic field with the main trailing spot containing a delta structure. This can be seen in the SOHO/MDI imagery underneath for 13 to 15 July (left: white light ; right: magnetogram) with sunspots of opposite magnetic polarity (white and black) within the same main penumbra.
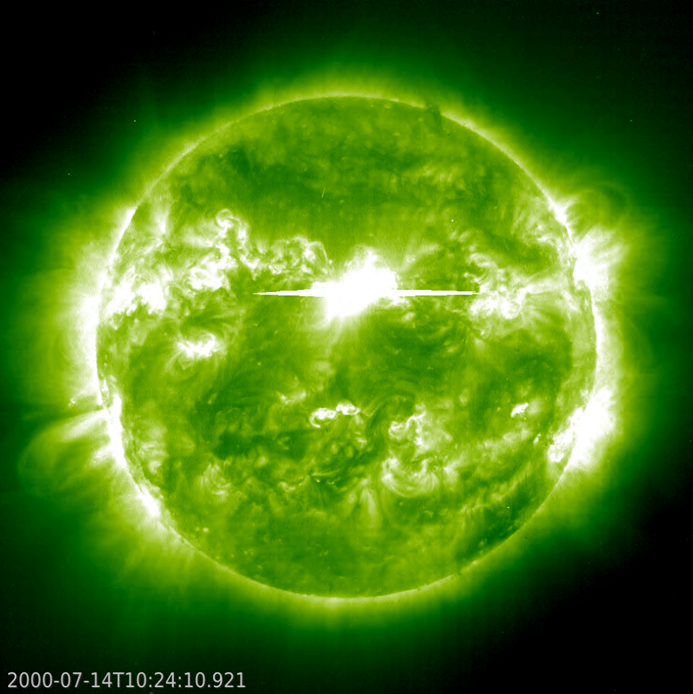
The magnetic interactions eventually lead to three X-class events, the strongest being an X5.7 flare peaking on 14 July at 10:24UTC. Nowadays, the flare's intensity would be upscaled to X8.1 following a correction as outlined in this NCEI/NOAA document. Also, in 2000, space weather forecasters did not have high-resolution, high-cadence images as they have today with SDO, but the SOHO instrumentation was at that time one of the finest top-technologies available and much appreciated by the space weather forecasters. The SIDC of the Royal Observatory of Belgium contributed in the development and calibration of SOHO's "Extreme ultraviolet Imaging Telescope" (EIT). The extreme ultraviolet (EUV) imagery by SOHO/EIT 195 underneath gave a good impression of the size and brightness of the X-class flare.

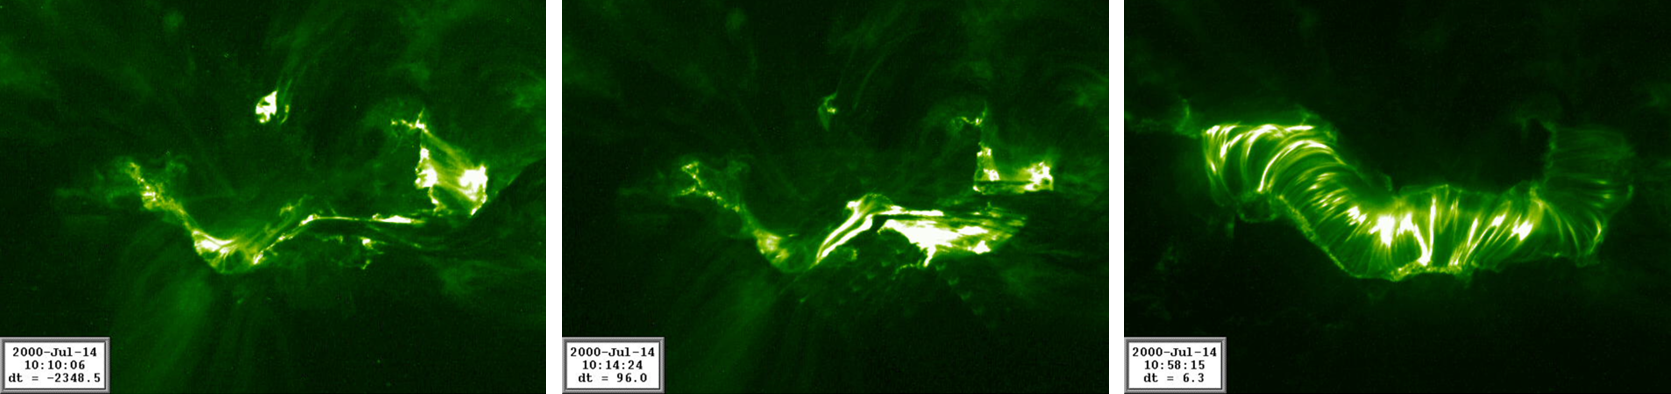
By a fortunate coincidence, the Transition Region And Coronal Explorer (TRACE) had this active region in its high-resolution field of view when the eruption took place. The EUV imagery underneath (LMSAL) shows an arcade, a series of post-flare coronal loops. Arcades are not uncommon, but the length of this particular arcade was an unusual 200.000 km, more than half the Earth-Moon distance! Each image spans 230.000 by 170.000 km. Note that the exposures have been rescaled to the same peak intensity to show the evolution of the central bright region. This causes the surroundings of the flare site to apparently dim markedly as the flare reaches peak brightness. These images helped a lot in understanding the science behind the development of a solar flare. The eruption was accompanied by moderately strong radio emissions, in particular in the 245 to 610 MHz radio band. The strong radio emission also interfered with the count of radio meteors, virtually dropping to zero for more than 20 minutes.
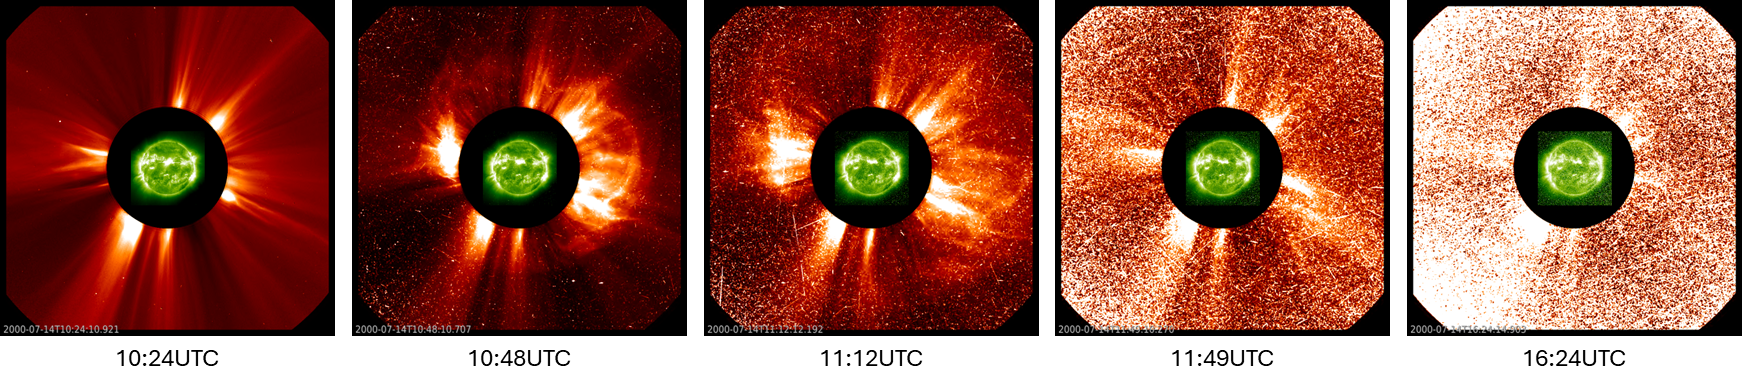
The X-class flare was accompanied by a severe proton event that started only 21 minutes after the flare's peak in soft-x-rays. In terms of greater than 10 MeV proton flux, its peak of 24.000 pfu (particle flux unit) still ranks as the 5th strongest over the entire 5 decades of solar observing by GOES. The particles interfered with High Frequency radio communication (HF Com - 3-30 MHz) over the polar regions, a so-called Polar cap Absorption (PCA). At the Zhongshan Station (Antarctica), the PCA event started at about 10:40UTC on 14 July and ended only at about 19:40UTC on 17 July, effectively lasting more than 3 days (Liu et al. - 2001). The noise in satellite solar images, generated by the impact of the particles onto the SOHO's cameras, can be seen in the SOHO images underneath showing a combination of EUV and white light coronagraphic imagery. Solar images and star-trackers became saturated by all the impacting particles (a so-called "white-out"), and thus virtually unusable. This raised -amongst others- a problem in the further monitoring of the solar activity from this active region. Other satellites were not able to gather any scientific data for several hours, e.g. the ACE spacecraft was bombarded with so many particles that it lost its ability to track solar wind density, temperature and velocity. These data remained unavailable from 11:00UTC until late 15 July (ACE page), thus effectively missing the arrival of the associated coronal mass ejection (CME).
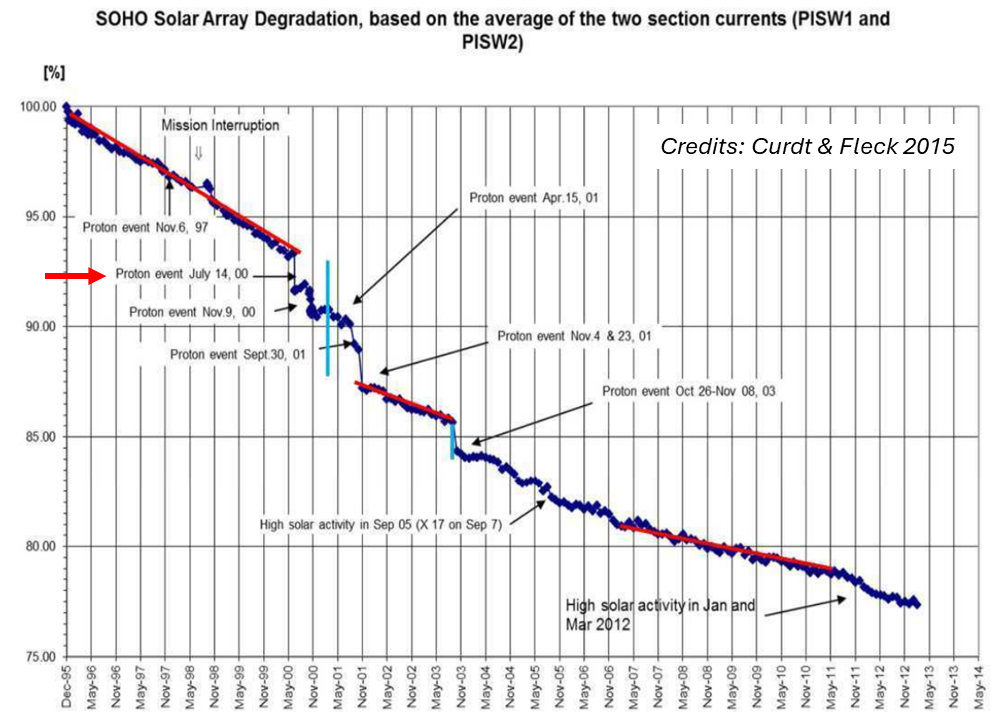
One of the radio transmitters on the Wind spacecraft permanently lost about a quarter of its power, forcing controllers to switch to a backup system (Carlowicz and Lopez - 2002 - ISBN 0-309-07642-0). Solar panels degraded significantly due to this proton storm. SOHO, located in the first Lagrange point which is well outside the protective Earth's magnetic field, lost 2% of its electricity generating power in just a single day (Curdt et al. - 2015)! If astronauts had been working at the International Space Station, they would have received a year's worth of radiation in just a few days. But fortunately, no astronauts were on board of the ISS or MIR, the Russian space station.
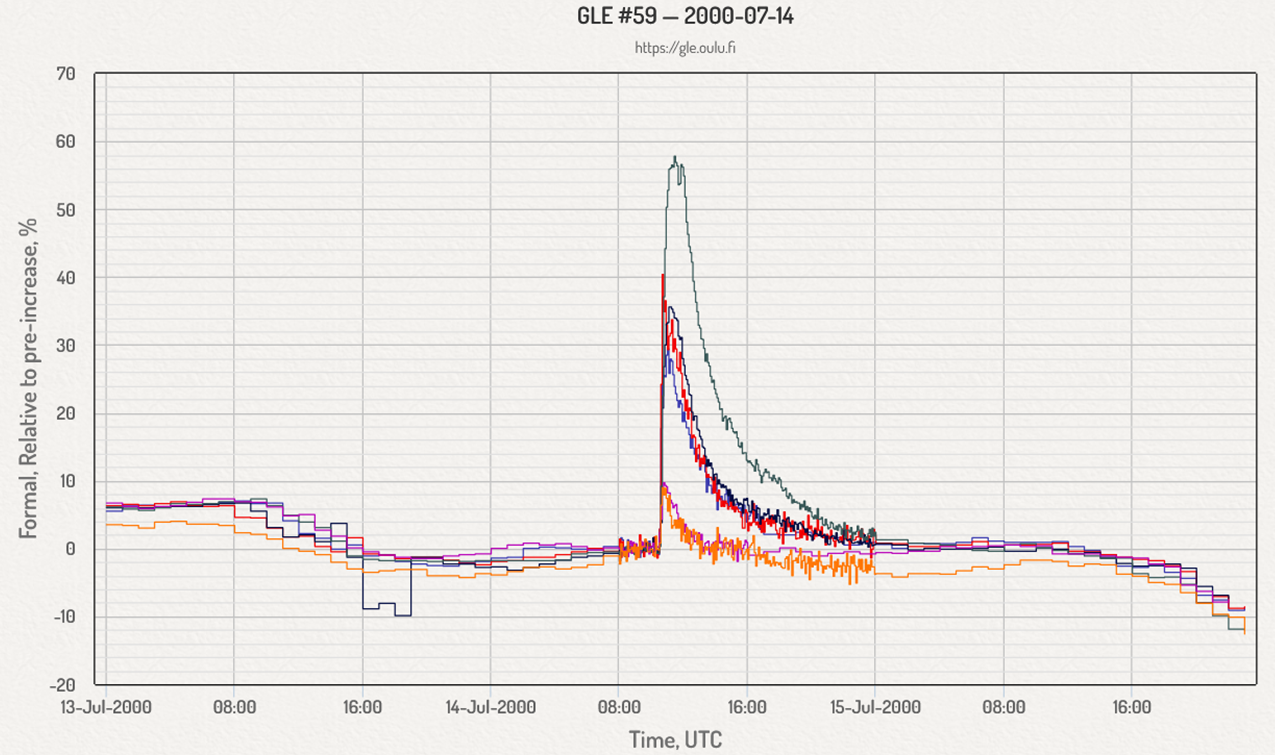
Finally, there were also many more energetic protons (several hundred MeV) accompanying this proton event, setting off a secondary particle shower in the Earth's upper atmosphere that was recorded by neutron monitors at the Earth surface, a so-called Ground Level Enhancement (GLE). Later analysis revealed that despite some of the particles having energies up to 7 GeV, the energy spectrum of the source particles was relatively soft (Belov et al. - 2001). This explains why the observed GLE increased the neutron flux by only 40-60%. See the graph underneath for some selected stations (Oulu GLE database).
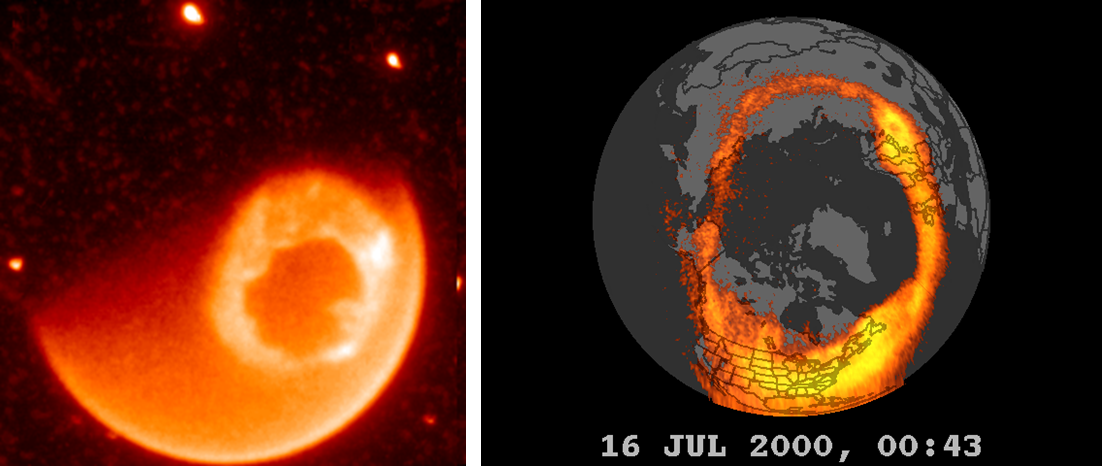
The coronal mass ejection (CME) associated with the X5 flare had an initial speed of 1673 km/s and was first observed at 10:54UTC (Denig et al. - 2018 ; Andrews - 2001). This fast, full halo CME was barely visible in the quickly saturating coronagraphic images by SOHO, due to the severe proton event. ACE recorded a shock in the solar wind on 15 July at 14:10UTC (Liu et al. - 2001), meaning that the interplanetary CME transited the Sun-Earth distance in about 27 hours. With a speed of more than 1000 km/s, it then jolted the Earth's magnetosphere at 14:37UTC on 15 July. A strong sudden impulse, i.e. a sudden increase in the strength of the geomagnetic field, of 112 nT was observed (Denig et al. - 2018), quite similar to that of the 10-11 May 2024 (108 nT). The subsequent geomagnetic storm reached extremely severe geomagnetic conditions (Kp = 9o) and was the largest storm since the storm in March 1989. It was also the first extreme geomagnetic storm observed with the armada of new solar (SOHO, TRACE) and solar wind (ACE, Wind) satellites. The power of the interplanetary CME pushed the magnetopause, i.e. the boundary of the Earth's magnetosphere, to well inside the geostationary orbits, exposing satellites such as GOES to the turbulent solar wind for several hours. Bz, the north-south component of the interplanetary field, reached -60 nT (Nishino - 2006), substantially stronger than the -50 nT during the May 2024 storm. These extreme values did not last as long as those from the May 2024 storm, explaining why Dst reached only -300 nT compared to the provisional -406 nT in May last year. Despite the full moon, aurora were reported from locations as far south as El Paso, Texas. The image underneath left shows the aurora as observed by the IMAGE satellite in the far ultraviolet (FUV) on 15 July 2000, and to the right by the POLAR satellite early on 16 July (POLAR/VIS John Sigwarth).
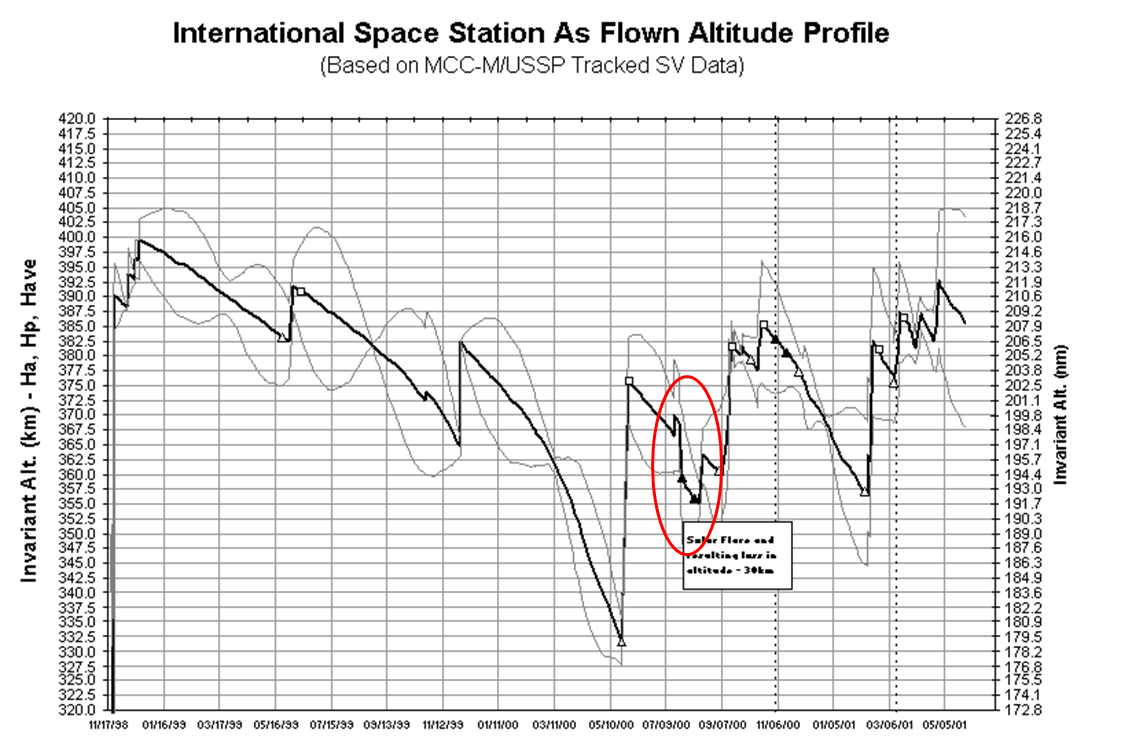
The increased drag in the Earth's upper atmosphere made the ISS loose 10-12 km in altitude (Odenwald et al. - 2006). This can be seen in the annotated graph underneath (Chad Hammons/CCAR). Japan’s Advanced Satellite for Cosmology and Astrophysics (ASCA) was not so fortunate. Earth’s upper atmosphere had expanded so much that the atmospheric drag began to pull the satellite down. The friction was so intense that it overwhelmed the momentum wheels that should have helped ASCA orient itself in space. Instead, the satellite went into a spin and lost power because its solar panels were no longer pointed toward the Sun. The tumbling satellite performed no further scientific observations and reentered the atmosphere on 2 March 2001 (Brekke - 2004). Also GPS systems were degraded for several hours (AMS - 2011), and a temporary third radiation belt around the Earth was created (Kim et al. - 2016). Electric currents in the Earth's crust induced by the geomagnetic storm caused voltage swings, tripping of capacitor banks, and damage to power transformers at more than a dozen electric power plants and companies in North America, but there were no blackouts such as in March 1989 (Carlowicz and Lopez - 2002 - ISBN 0-309-07642-0).
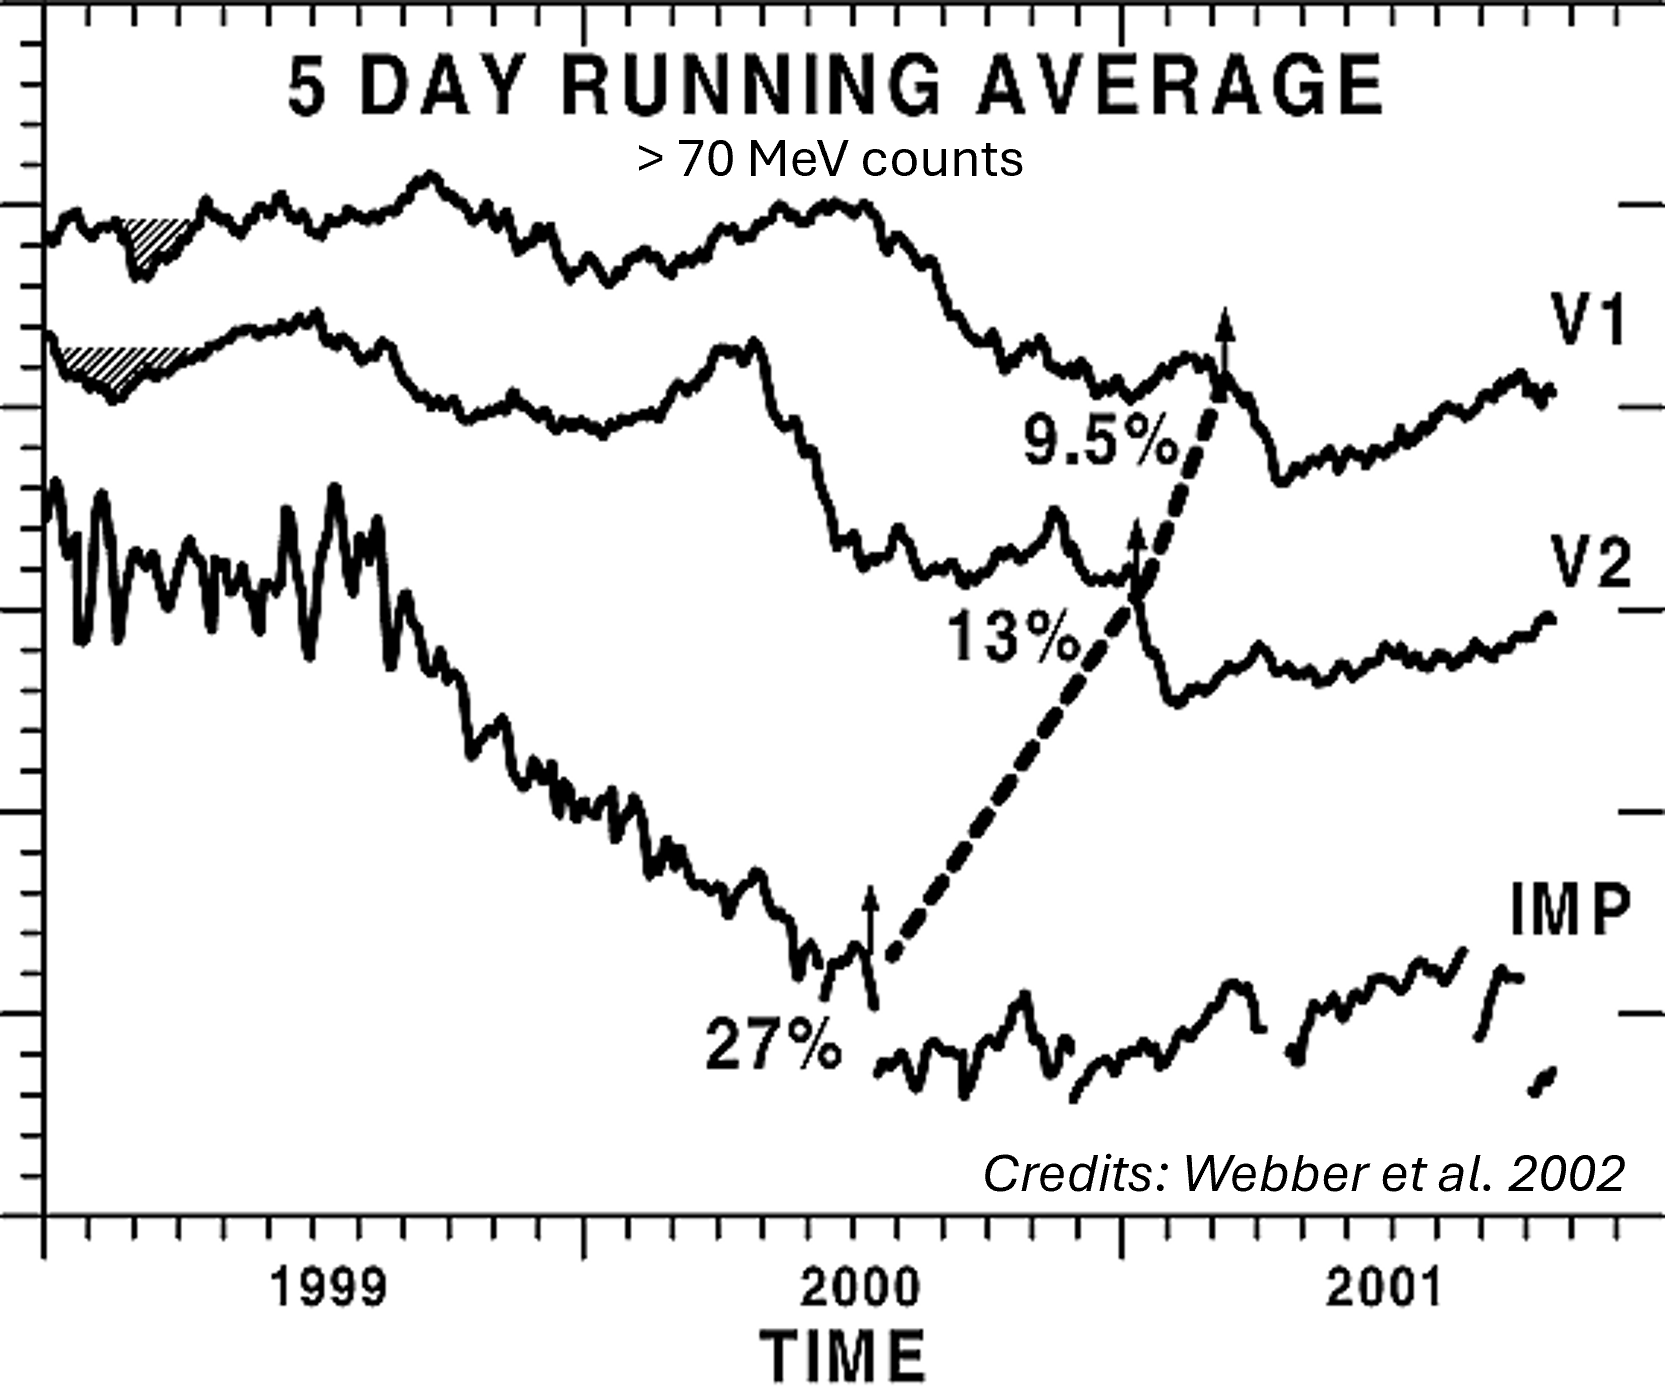
Based on the characteristics of this CME, several scientists accurately predicted that the remnants of this CME would be detected by the Voyager 1 (V1) and Voyager 2 (V2) spacecraft in the January- March 2001 time frame. These spacecraft were then respectively at 63 and 80 AU (astronomical unit, the average Sun-Earth distance) from the Sun. The large Bastille Day transient was first seen about 12 January 2001 (+/- 2 days) as a decrease in the >70 MeV cosmic ray data at V2 (a so-called Forbush decrease), some 180 days after the flare on the Sun and the decrease in cosmic rays seen at the Earth. During the event at V2, the peak solar wind speed was measured to be around 450 km/s. The total >70 MeV cosmic ray decrease at V2 was 13.1% making it one of the largest decreases seen this far out in the heliosphere. The passing of the Bastille Day CME at V1 was seen in the V1 >70 MeV cosmic ray data around 17 March 2001 (+/- 5 days), with the total cosmic ray decrease at V1 about 9.3% (Webber et al. - 2002). The graph underneath shows five-day running averages of the normalized V1 and V2 >70 MeV counting rates in the outer heliosphere and at the Earth (IMP 8 satellite) from 1999 to 2001. Time of onset of the cosmic ray transient decreases at the Earth (27%), V2 and V1 is indicated by arrows (from Webber et al. - 2002). With the passage of the interplanetary CME over these two spacecraft, the impact of the Bastille Day event had finally come to an end.
