On March 9, 2004 we could read in the space weather news broadcast by the SIDC the following:
"...The solar wind speed started to increase from 350 to 450 km/s. The recursive large coronal hole is pushing the velocity to higher levels. From February 10 onwards, we expect active to minor storm geomagnetic conditions."
Exactly 27 days ago, on February 12, the SIDC sent out a similar message:
"...From midnight, the wind speed showed a steady increase. This is a clear sign that we are under the influence of a coronal hole..."
|
|
|
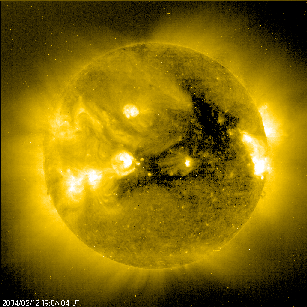
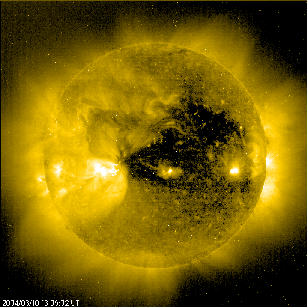
The EIT 284 picture above on the left dates from February 12, while the picture on the right dates from March 10.
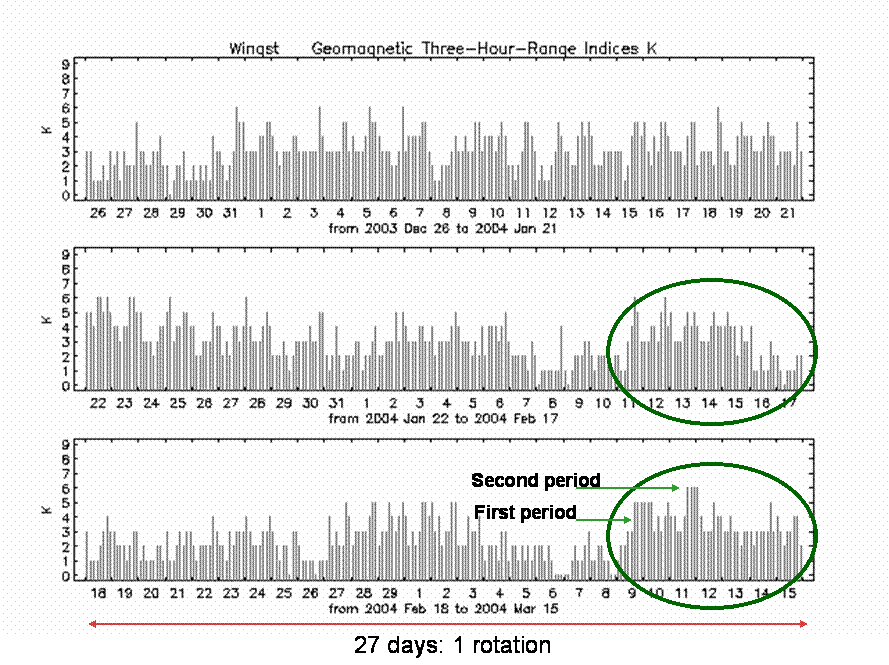
In the "K-index versus time"-graph (Figure above), visualizing the disturbances of the earth magnetic field in Wingst (Germany), you can see the recursive pattern of a coronal hole (indicated by the two green circles). A period of 27 days is approximately with the time the Sun needs to turn once around her axis.
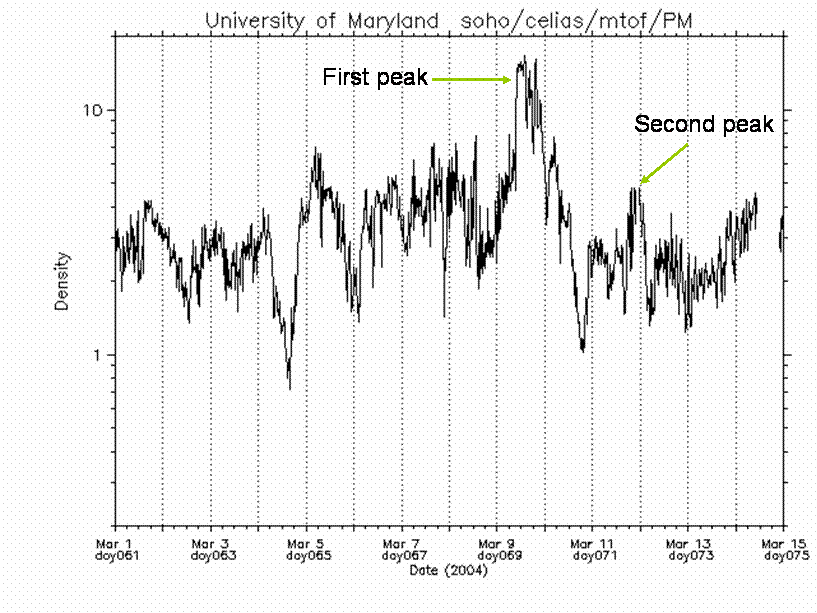
Checking the graphs of SOHO/CELIAS and ACE , we see that the peaks in the density graph (CELIAS, Figure above) and a more negative Bz component of the interplanetary magnetic field (ACE, Figure below) coincide with the 2 periods of geomagnetic disturbances. The second period was less fierce in terms of the length in time as the solar input was less strong: a smaller density peak and a less negative Bz component compared with the first period.
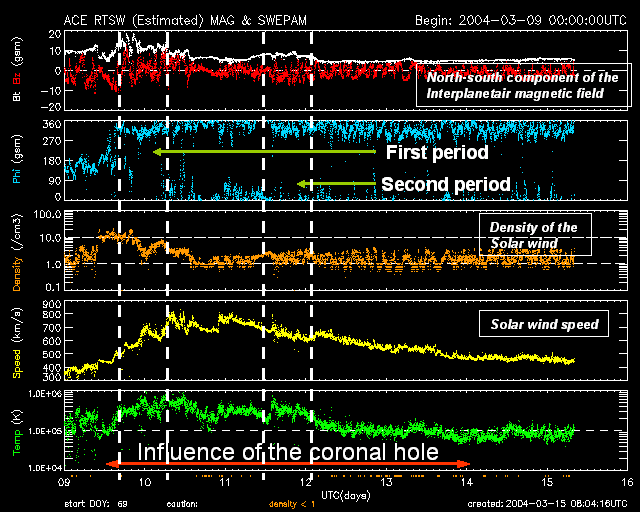
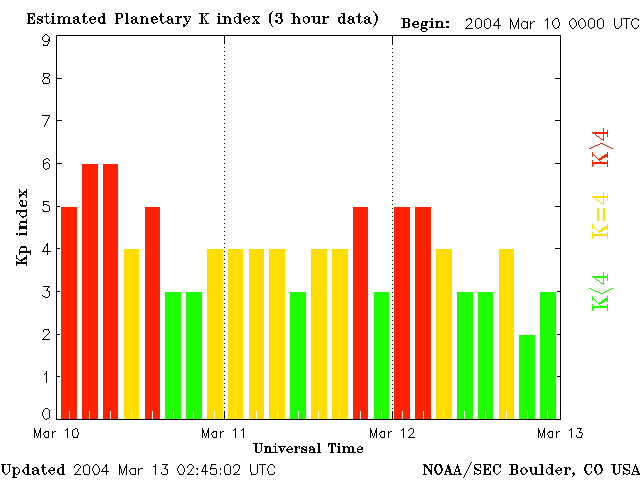
However, the K-index in Wingst reached the value of 6 compared with a 5 in the first period. The estimated Kp index from NOAA (Figure below) however behaved differently. The global index reached only a 5 during the second period compared with a 6 in the first period.
