
NOAA 1515 appeared at the southeastern solar limb on June 27th. With a maximum sunspot area of only about 5 times the total surface of the Earth, it certainly did not become the biggest sunspot group so far this solar cycle.
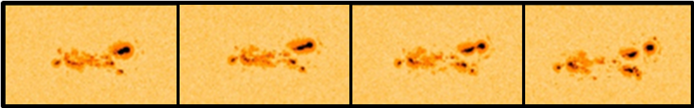
Nonetheless, the group was quite complex and showed interesting dynamics. For example, the images underneath taken by SDO/HMI on 1 and 2 July show the splitting of the main spot in less than 24 hours! Cytokinesis of solar proportions!
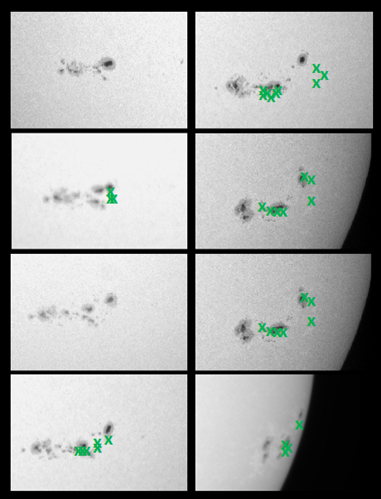
Over the next two days, the split-off sunspot moved towards and into the middle portion of the sunspot group. Crashing into these sunspots, this inevitably resulted in numerous medium class solar flares. The daily sunspot images underneath were taken on 1-8 July by the Uccle Equatorial Table - USET in white light. Superimposed on these images are the locations of the 30 M-flares (and 1 X-flare) that were produced by NOAA 1515. Clearly, one can see two regions of flare activity. The first one is to the west and south of the main spot. This region was active during most of the group's transit. The second flare-active region is in the middle portion and only became active after the split-off sunspot bumped into the middle portion (4 July and later).
On July 5th, the Sun produced 10 M-flares: 9 from NOAA 1515, and 1 from NOAA 1519. Though this is quite a lot for one day, the figure pales compared to the record 16 M-flares that were produced on 11 July 1982. That's 2 medium flares every 3 hours!
Obviously, the week from 2 to 8 July 2012 was also very flare-active, with 34 M- and 1 X-flare. One has to go back to March 1991 to get comparable figures. Not surprisingly, the week record dates back from July 1982, when -according to NOAA statistics- from 8 to 14 July 65 M- and 3 X-flares were produced!
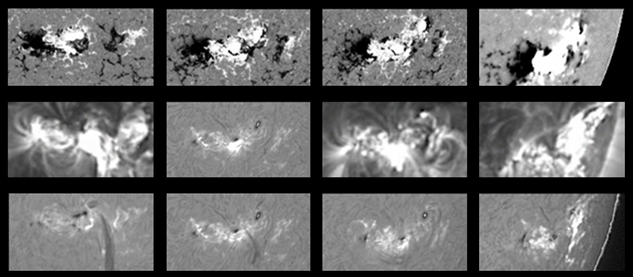
NOAA 1515 produced 5 high energetic flares (M5 or stronger) during its transit. Underneath images show 4 of these events: the M5.6 from 2 July, the M5.3 from 4 July, the M6.1 from 5 July, and the X1.1 from 6 July. For each event, the pre-flare magnetogram is shown (SDO/HMI and GONG), as well as the outlook during maximum flare intensity (PROBA2/SWAP and GONG), and in H-alpha 15 minutes after the flare's peak (GONG - http://halpha.nso.edu/ ). Event 1 and 4 took place near the group's main spot, while event 2 and 3 were located in the group's middle portion. The H-alpha images for the first 3 events also show dark ejected material over the solar disk. The fifth event, an M6.9 flare from 8 July, is discussed in a separate contribution.
 |
 |
