
The graph underneath could have been the profile of a mountain stage in the Tour de France, but no: it shows the evolution of the x-ray flux as it was observed by the GOES-15 satellite from 17 till 19 July 2012.
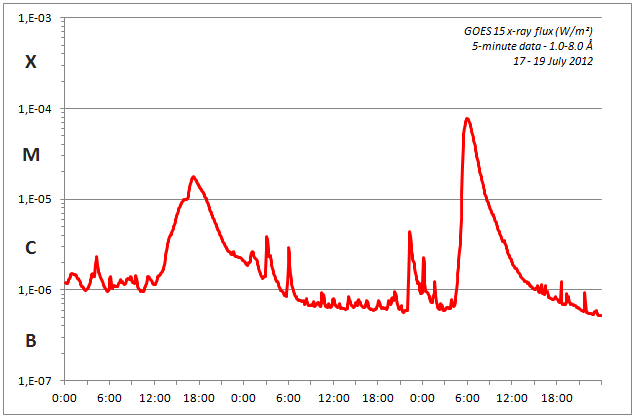
The two main events stand out prominently: An M1.7-flare on 17 July, and a high energetic M7.7-flare on 19 July. Both were produced by NOAA 1520, close to the southwestern solar limb. Especially the M7-flare got the solar observers scratching their head for a while, as it was nowhere to be seen on the solar surface!
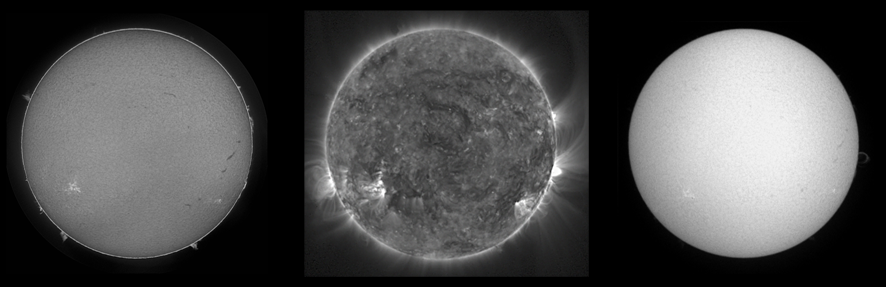
The event started in the early morning hours of 19 July, at 04:17UT. One hour later, the x-ray flux had already passed the M2-level, but still no sign of the eruption! This can be seen in the H-alpha image underneath on the left, which was taken at 05:20UT by GONG's observatory in Learmonth, Australia, (http://halpha.nso.edu/ ). Only then, and very gradually, one could see the rise of "post"-flare coronal loops from behind the western solar limb. This was neatly depicted by the PROBA2-satellite (image in the middle) at 06:00UT near the peak of the flare, and also the H-alpha telescope from the Uccle Solar Equatorial Table (see http://www.sidc.oma.be/uset/ ) was able to image these delicate loops (08:20UT image on the right). At their maximum, these fine structures rose up to 120.000 km above the solar surface, equivalent to 9 planet Earths side-by-side! The coronal loops were visible for the full remainder of the day (over 18 hours!), as can be seen in this PROBA2-movie
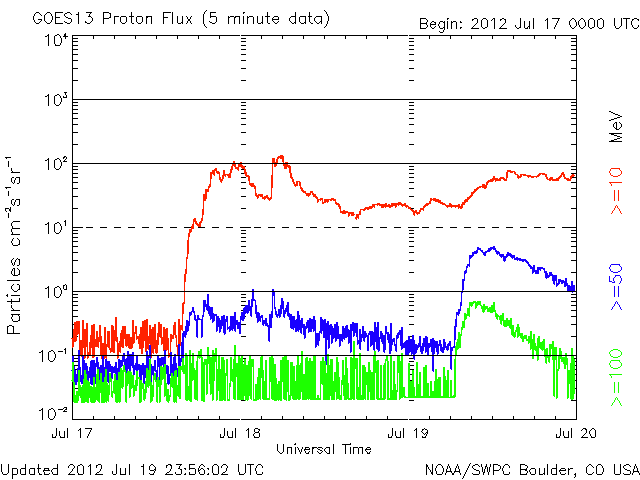
The M7-flare also managed to camouflage that it was actually a proton event, using the already elevated proton levels from the still ongoing event 2 days earlier (image underneath). Indeed, whether or not a proton enhancement becomes a proton event is based on the number of protons having an energy of 10 MeV or more (red curve). At the start, this proton flux also needs to be below the event threshold. In the case of the M7-flare, only a slight rise can be noted in an event that was still in progress. The graph does show that this M7-eruption was a lot richer in protons having higher energies (blue and green curves) than the M1-event. All in all, it concerned only mild radiation storms, but solar images made by satellites like SOHO did show a bit more white "dots" than usual.
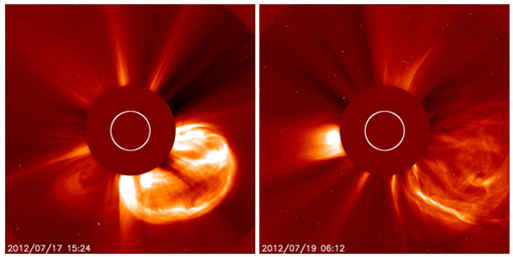
Both M-flares were also long duration events (LDE). An LDE is operationally defined by NOAA/SWPC as any flare that takes 30 minutes or more to decrease from its peak value to a level halfway between the peak and the preflare background flux (see glossary at http://www.swpc.noaa.gov/info/glossary.html ). With 109 and 58 minutes resp., both M-flares satisfy this criterion very well. In fact, the M1.7-flare lasted 7 hours and 1 minute in total, making this the longest lasting solar flare of the ongoing solar cycle 24! As the likelihood of a coronal mass ejection (CME) increases to a virtual certainty once the flare lasts a few hours or more, it should come as no surprise that both flares were accompanied by an impressive CME. The SOHO/LASCO C2 images underneath certainly testify of this!
 |
|
 |
