
Rise and shine: That's exactly what active region NOAA 2422 did last week. From nothing, it started to emerge on 22 September as a simple bipolar sunspot region. Over the next few days, it developed into a fully mature sunspot group, gradually increasing its magnetic complexity. Until the 26th, it produced only a handful of C-class flares. However, by then, it had developed significant delta structures, i.e. spots of opposite magnetic polarity within the same penumbra, in its middle portion. This resulted in the production of M-class ("medium") flares starting on 27 September, with a major M7 flare on 28 September peaking at 14:58UT. The party continued on 29 September, with multiple M-class flares from this very active region.

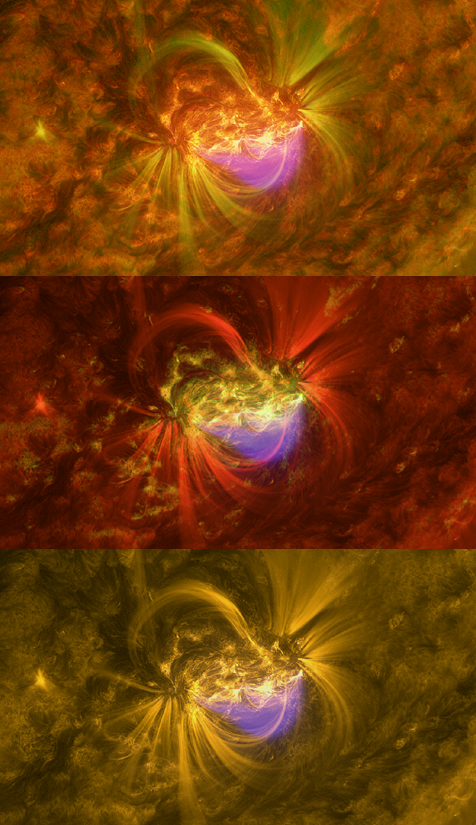
The image above shows the complex magnetic configuration of NOAA 2422 during the afternoon of 28 September. A magnetogram is laid over the continuum ("white light") image. The red color means a positive magnetic field, i.e. field lines coming out of the solar surface, whereas the blue color represents a negative magnetic field. The two delta structures, resp. the main middle spots and the structure to the lower left of the main leading spot, can easily be recognized. The graph underneath shows the evolution of NOAA 2422's sunspot area (blue line), as well as the daily number of C- and M-class flares it produced. The sunspot area is expressed in millionths of a solar hemisphere (MH), with 1000 MH corresponding to about 6 times the total surface area of the Earth.

A movie concerning NOAA 2422 can be seen here. The first clip shows the general evolution of the sunspot region in white light as it transits the solar disk (22-29 September). It is followed by a movie of the magnetogram (see above for the color code) lasting from 14:00 till 24:00UT on 28 September. Then follow 3 clips, each lasting from 14:00 till 19:00UT, and showing mainly the M7.6 flare and subsequent post-flare coronal loops as seen in SDO's extreme ultraviolet filters. The first 2 clips differ little from each other, as both are based on AIA 304 ("cool" temperatures of about 80.000 degrees; reddish colors), AIA 171 (around 700.000 degrees; greenish colors), and AIA 131 (several million degrees; bluish colors). However, in the second clip, the red and green components of the AIA 304 and 171 filters have been switched, with the red colors now displaying the post-flare coronal loops, adding to a rather dramatic effect. The third clip only shows the medium (AIA 171; yellowish colors) and high temperatures (AIA 131; bluish). Underneath is a still from each of the three clips (always at 15:29UT), and the "dramatic" clip. Notice the "blue" blob of very hot plasma hovering over NOAA 2422. Also interesting is that, so far, most of these M-class flares were not associated with an obvious coronal mass ejection.

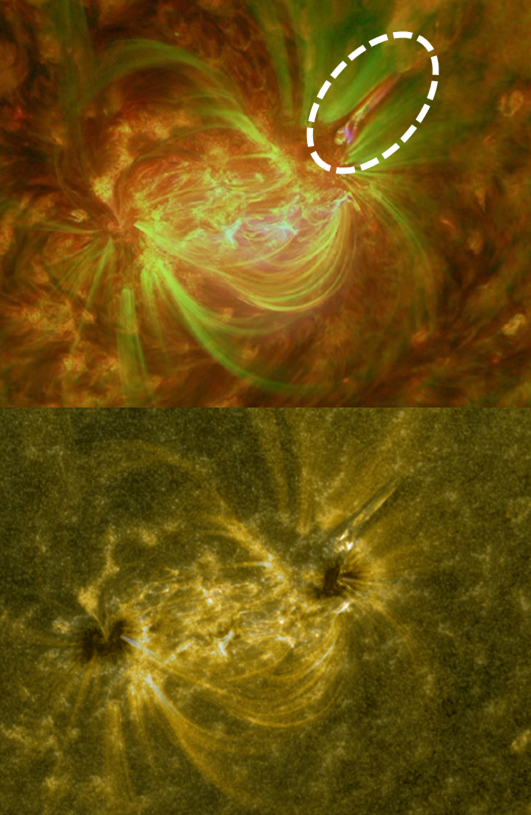
Another interesting feature is the series of jet-like eruptions to the north of the leading spot, such as e.g. around 17:41UT (image underneath). The movie shows at least 6 obvious jets in a timeframe of only 5 hours. They seem to be related to a small spot of opposite polarity near the northern edge of the leading spot's penumbra (see also the magnetogram above). More on jets can be found in the 05 February 2015 news item.
Credits - Imagery for the movie clips were taken from SDO and (J)Helioviewer.
 |
 |
