
Last week, NOAA 2567 continued its growth in magnetic complexity and sunspot area. Early on 21 July, this active region produced an M1.2 flare which was the first "medium" event since the M6 flare on 18 April this year by NOAA 2529 (see the 19 April news item). NOAA 2567 would produce a total of 7 M-class flares, the strongest being an M7.6 event on 23 July which was the most powerful since the M7.9 flare by NOAA 2371 more than a year ago (see this 5 August 2015 news item).
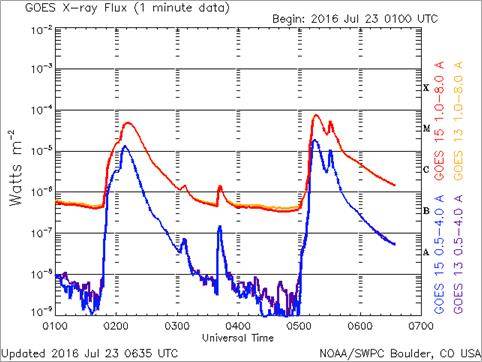
Closer examination of the GOES x-ray flux curve revealed that this M7.6 flare was closely followed by another M-class flare (see the red curve above). The double-peaked event started at 05:00UT with the M7 flare reaching its peak intensity at 05:16UT. It was in the aftermath of this flare that an impulsive M5.5 flare peaked only 15 minutes later. It lasted barely 6 minutes, but that was enough to strongly disturb a whole range of radio frequencies (245 MHz to 15.4 GHz). The M7/M5 pair slightly enhanced the greater than 10 MeV proton flux, and was associated with a coronal mass ejection directed away from the Earth.
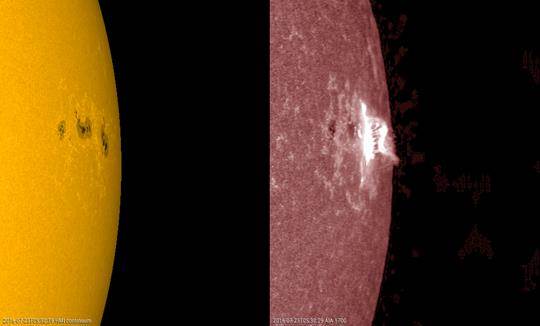
Using SDO imagery, a movie of the event was created with each clip spanning the period from 04:30UT till 07:30UT, at a cadence of 1 image per minute. The screen shot above compares a view of the sunspot cluster in white light with a view in far ultraviolet (AIA 1700), the latter corresponding to the temperature minimum in the solar atmosphere at a height slightly above the visible solar "surface". The timing of the picture almost coincides with that of the peak x-ray intensity of the M5.5 flare. The imagery shows that the flaring events are taking place along the magnetic inversion line (the "borderline") between NOAA 2567 and NOAA 2565 (see last week's news item). A parallel ribbon flare (two elongated parallel bright patches) can be recognized in both cases.
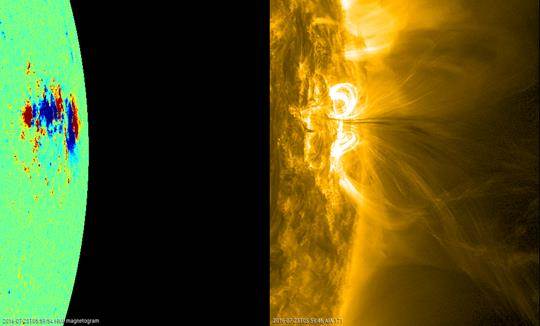
The next clip compares the magnetogram of the sunspot groups with extreme ultraviolet (EUV) images from the AIA 171 channel, which shows the upper transition zone at temperatures near 700.000 degrees. The clip emphasizes the dramatic outlook of the flaring events, in particular from the M5.5 flare. Material is being ejected along twisted magnetic field lines, but also dark ("colder") material can be seen flowing back to the Sun, some of which along a relatively narrow magnetic funnel ending near NOAA 2567's main spot. Also the post-flare coronal loops to the north and south of NOAA 2567's main spot are clearly visible.
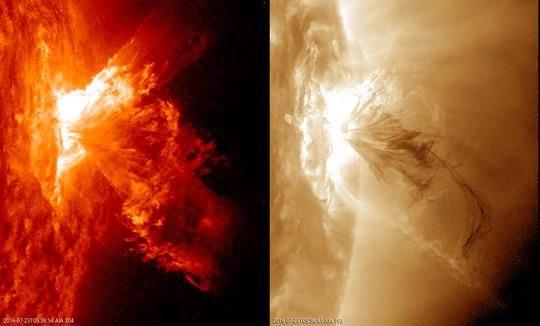
The last clip provides the most spectacular view on the flaring event, with EUV images in the AIA 304 (left) and AIA 193 (right) channel. These channels give a view on resp. the lower transition zone and the corona, at temperatures around resp. 80.000 and 1.5 million degrees. The whirling spraylike ejection of material as well as the downflow of cold material are standing out! The movie closes with a AIA 304 clip but with the imagery 90-degrees rotated (the flaring event is now on top), adding to the already dramatic outlook.

