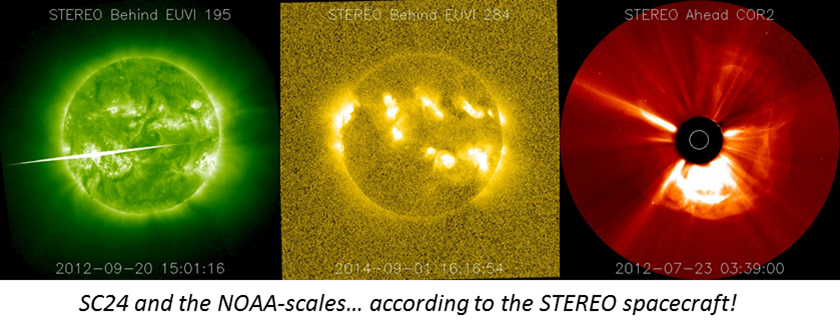
Once again, solar activity has been very low last week. One could wonder how poor the performance of ongoing solar cycle 24 (SC24) has been compared to the previous solar cycles. For that, one could use the famous NOAA-scales which link objective solar parameters such as the x-ray flux to all kinds of practical space weather effects such as on radio communication. More details can be found on the NOAA/SWPC webpage.
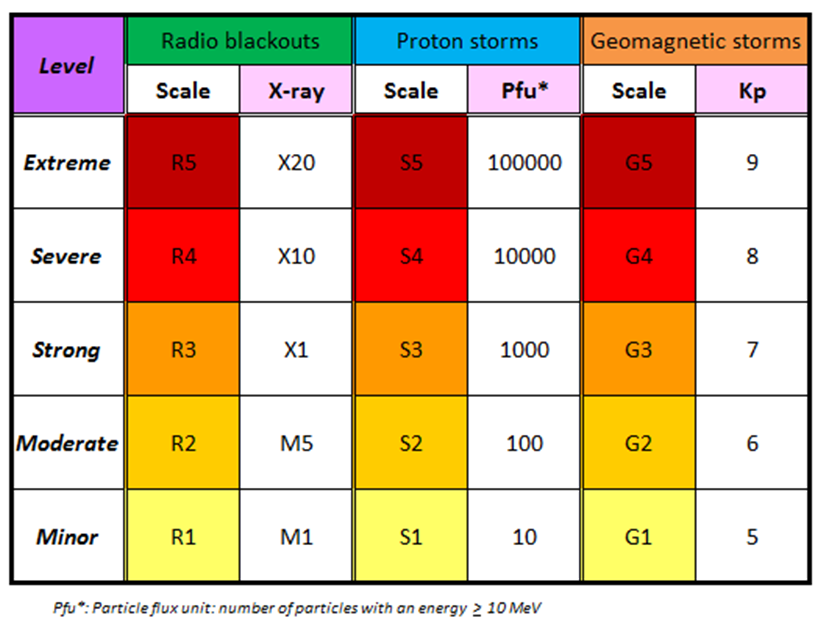
The scales describe three types of environmental disturbances: radio blackouts (R-scale), solar radiation storms (S-scale) and geomagnetic storms (G-scale). For these, three physical parameters are used, resp. solar flares (x-ray flux), proton storms (number of protons with energies greater than 10 MeV), and the Kp-index. All scales consists of 5 levels (1 to 5), conveying the intensity of the event (minor to extreme). The table above provides a summary of scales and intensities. A few examples. An X6.9 flare would be rated as an R3 event, a proton flare with a peak flux of e.g. 350 pfu would be rated as an S2 event (between 100 and 1000 pfu), and a severe geomagnetic storm (Kp=8) as a G4 event.
Systematic satellite observations of the Sun started in 1976 with GOES. For each year and for each disturbance type, one can count for every level the number of events. E.g. so far for 2016, we've had only 10 R1 events (flares with intensity between M1 and M5) and 4 R2 events (intensity between M5 and X1). Data can be retrieved at resp. NGDC/NOAA, NASA/NOAA, and WDC Kyoto, and run through mid-October 2016.
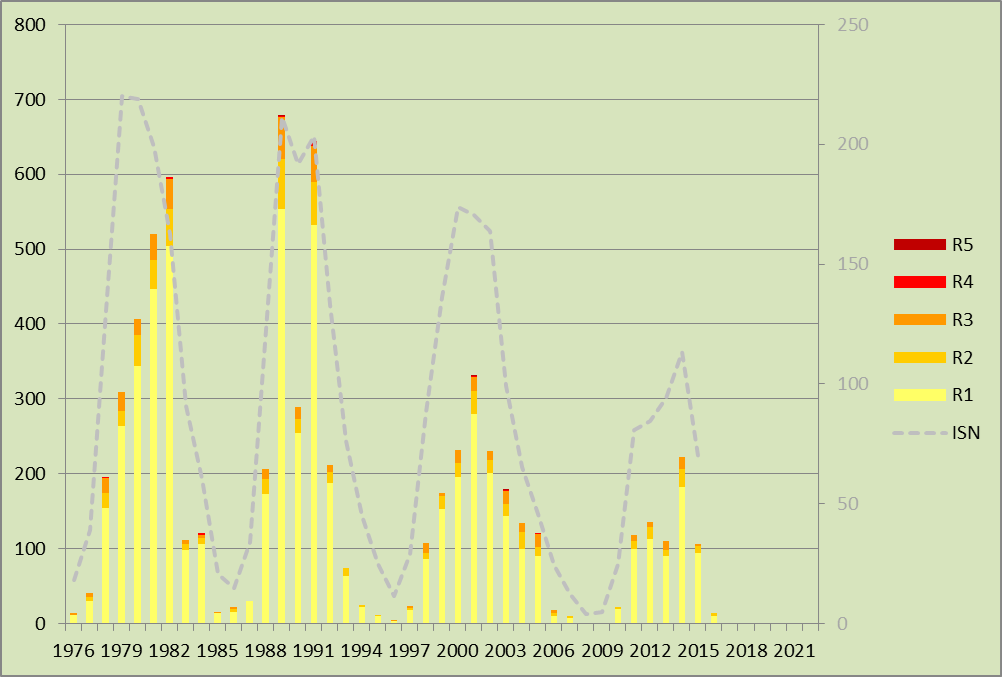
Each graph shows the yearly accumulation of the events, with the yearly International Sunspot Number (SILSO) superposed on it as the gray dashed line. E.g. in the chart above, for 2014 -the year of SC24 maximum-, the number of radio blackouts amounted to 222, consisting of 183 minor (R1), 23 moderate (R2), and 16 strong (R3) events. This is clearly less than during previous solar cycles such as e.g. in 1989 when there were no less than 679 radio blackouts including 59 strong or more intense events! Also, SC24 has not produced any severe or extreme event so far, i.e. X10 or stronger flare.
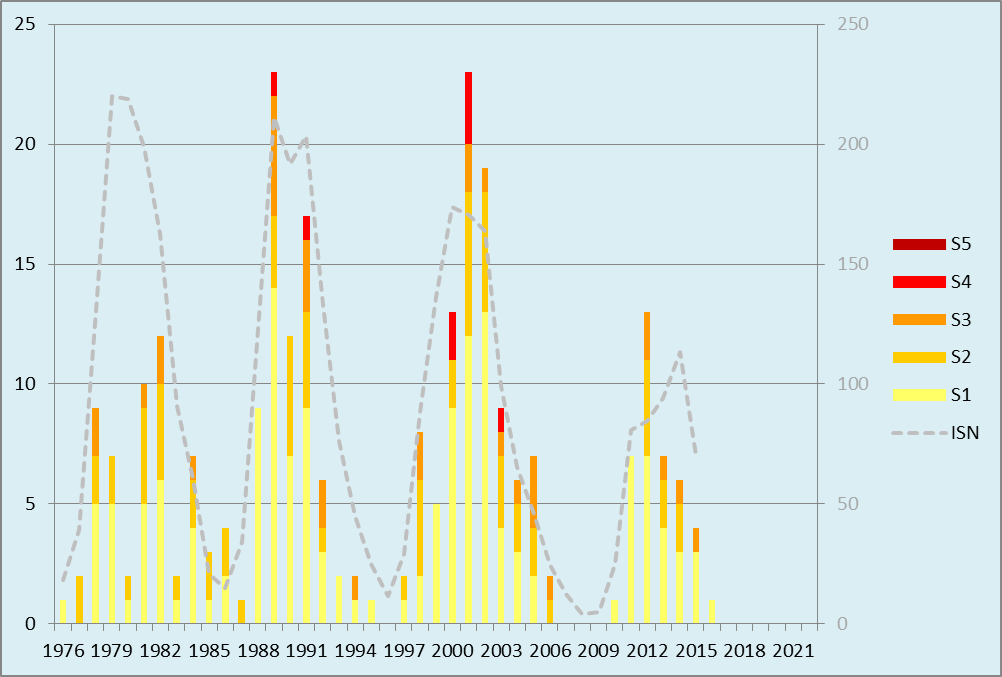
Concerning the number of solar radiation storms (proton storms), it is no surprise that SC24 is again the least active. Interestingly, it is not that much lower in number (39 vs. 59) and intensity (max. S3 events) than SC21 despite the large difference in maximum yearly sunspot number (220 vs. 113). Also remarkable is that 2012 is the year with the most and most intense radiation storms during SC24, and not 2014, the year of solar cycle maximum.
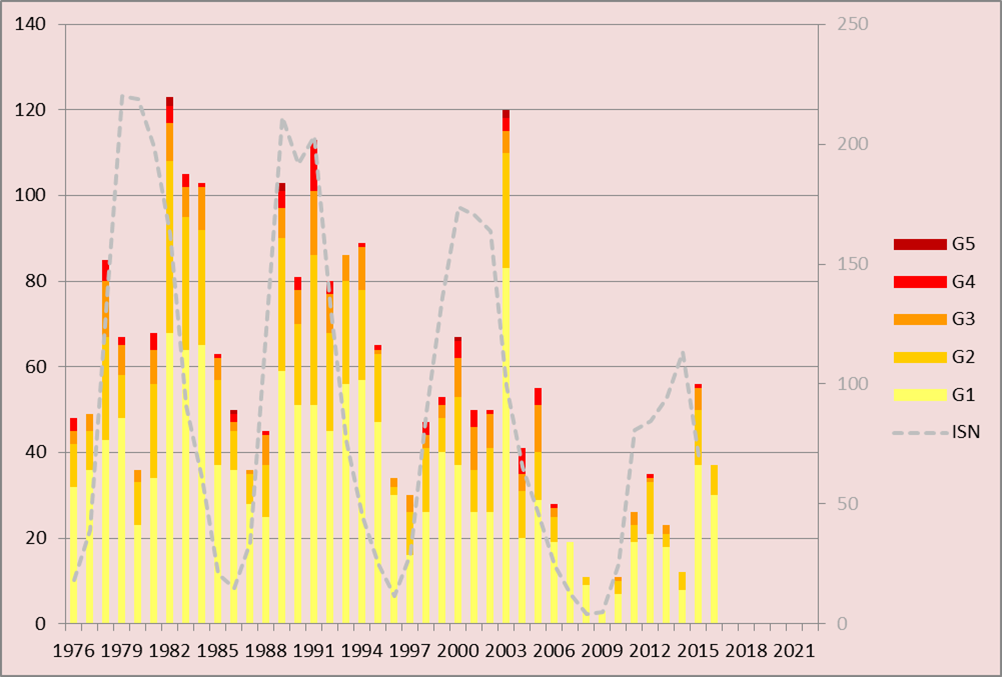
The plot of the geomagnetic storm days bears much less resemblance with the evolution of the sunspot number than in the previous two charts. This is because minor to strong geomagnetic disturbances can also be caused by the high speed solar wind streams (HSS) from coronal holes, hence distorting the familiar outlook of the sunspot cycle. Nonetheless, even then it is very clear that SC24 has been quite disappointing when it comes to the number and intensity of geomagnetic storms, with no extreme storms (G5) so far and precious few severe events (G4). Worse, the numbers even get depressingly low when one compares to other years such as e.g. the 120 storming days in 2003. Interestingly, the number of geomagnetic storm days is peaking in 2015-2016, so after the SC24 maximum in 2014. This is particularly due to the HSS from numerous coronal holes, and is a well-known aspect of this stage of a solar cycle.