Solar Cycle 24 (SC24) is gradually approaching its minimum. Over the last few years, its weakness has been pointed out several times (see e.g. this STCE news item). In fact, most scientists currently alive have never seen such a weak cycle. In this article, SC24 will be compared to the three previous cycles (SC21, SC22 and SC23) covering more than 40 years in total, basically since the start of systematic observations by the GOES satellites in 1976.
The solar cycles are evaluated in various domains. There's the international sunspot number (ISN v2.0) provided by SILSO, the sunspot area (NOAA), the 10.7 cm radio flux (Penticton), the number of eXtreme solar flares (X-class flares, NGDC/NOAA), proton events (particle energy > 10 MeV, NASA/NOAA), Ground Level Enhancements (GLE, from Oulu), and geomagnetic indices such as Kp and Dst which are provided by the Kyoto World Data Center for Geomagnetism.
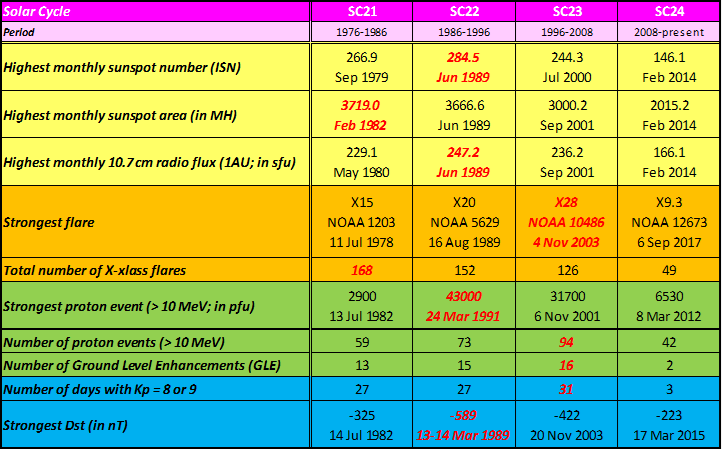
In short, these are the typical parameters that space weather forecasters and monitors keep an eye on every day. The table above provides a summary for each of the four solar cycles, with text in red highlighting the record. SC24 has no red text at all, already indicating that this cycle was a wimp compared to the three previous ones.
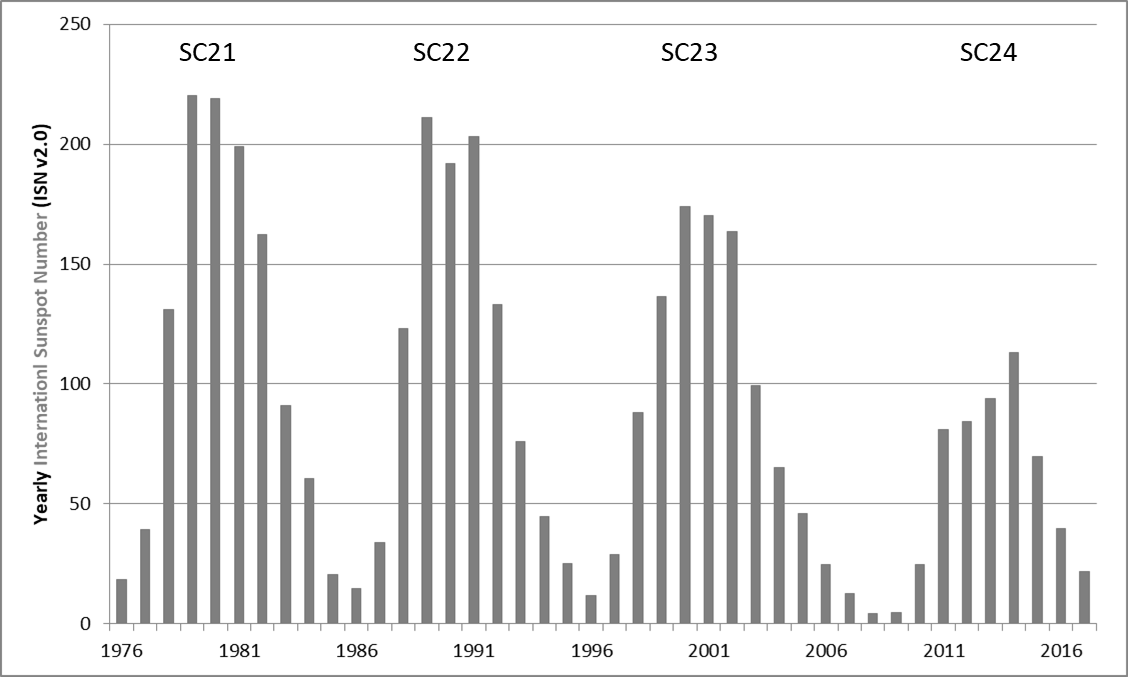
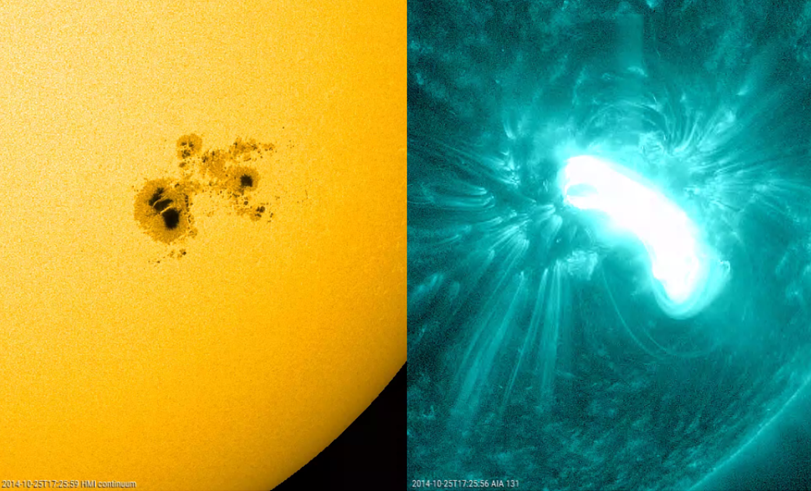
Sunspot wise, SC21 and SC22 are topping the list having very similar values. SC21 has slightly higher yearly sunspot numbers in 1979 and 1980 near 220 than SC22 (210), whereas the highest monthly sunspot number occurred in June 1989 with an astonishing 284.5. The numbers for the ongoing SC24 are significantly lower, with the yearly ISN only at 113.3 in 2014. Similar conclusions when considering the monthly sunspot area, with SC21 at 3719 MH (MH: millionths of a solar hemisphere, with the total area of the Earth corresponding to almost 170 MH) in February 1982, whereas SC24 reached only 2015 MH in February 2014, that is barely half! In its defense, SC24 produced the largest sunspot group in more than 20 years (NOAA 2192, see this news item).
The 10.7 cm solar radio flux, which measures activity in the upper chromosphere and at the base of the corona, is ideal for monitoring solar activity (see e.g. this news item). But is shows the same results, e.g. the highest monthly radio flux in SC24 (166.1 sfu; solar flux units, with 1 sfu = 10-22 W m-2 Hz-1) was almost a third lower than the maximum values during the previous cycles.
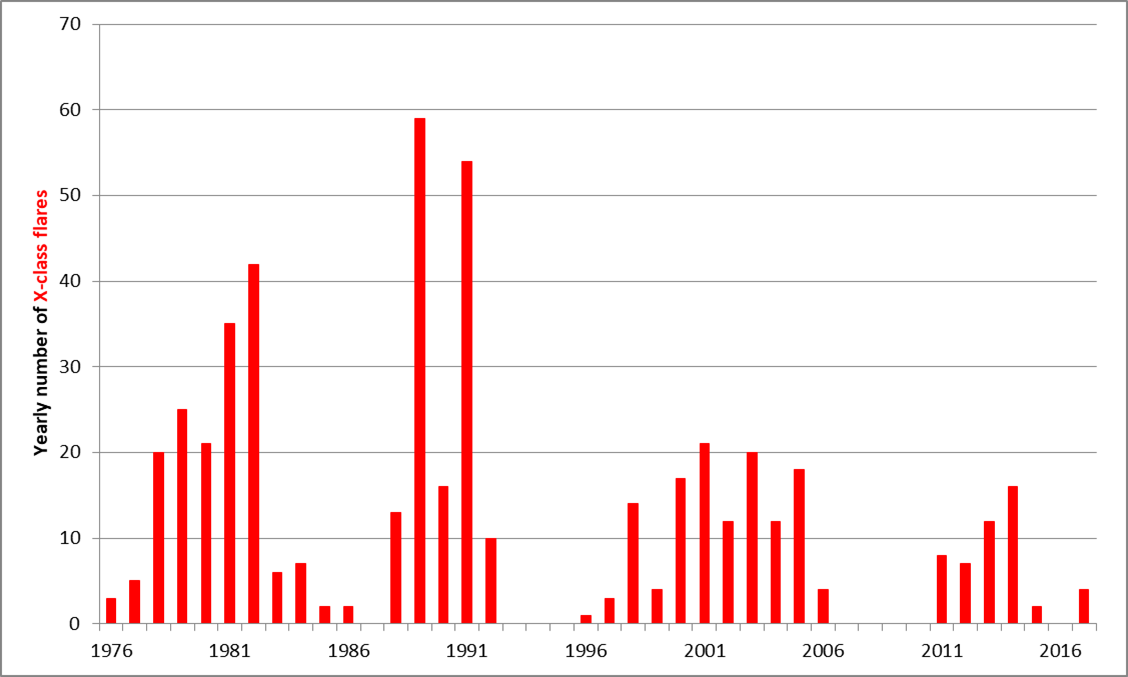
We're just getting started, it's going to be a lot worse. Taking a look for example at the number of X-class flares, SC24 produced only 49 "eXtreme" events, or about a third compared to SC21 and SC22 which easily topped 150. Also the strength of these flares was lower, with no flares above the X10 level during SC24 yet. NOAA 2673 produced the strongest flare of the solar cycle (X9 on 6 September 2017), standing in the shadow of the spectacular X28 that was produced during SC23 on 4 November 2003. NOAA 2192 produced 6 X-class flares during its transit in October 2014, which is a good result but again a bit meager compared to e.g. the 11 X-class events produced by NOAA 5395 in March 1989.
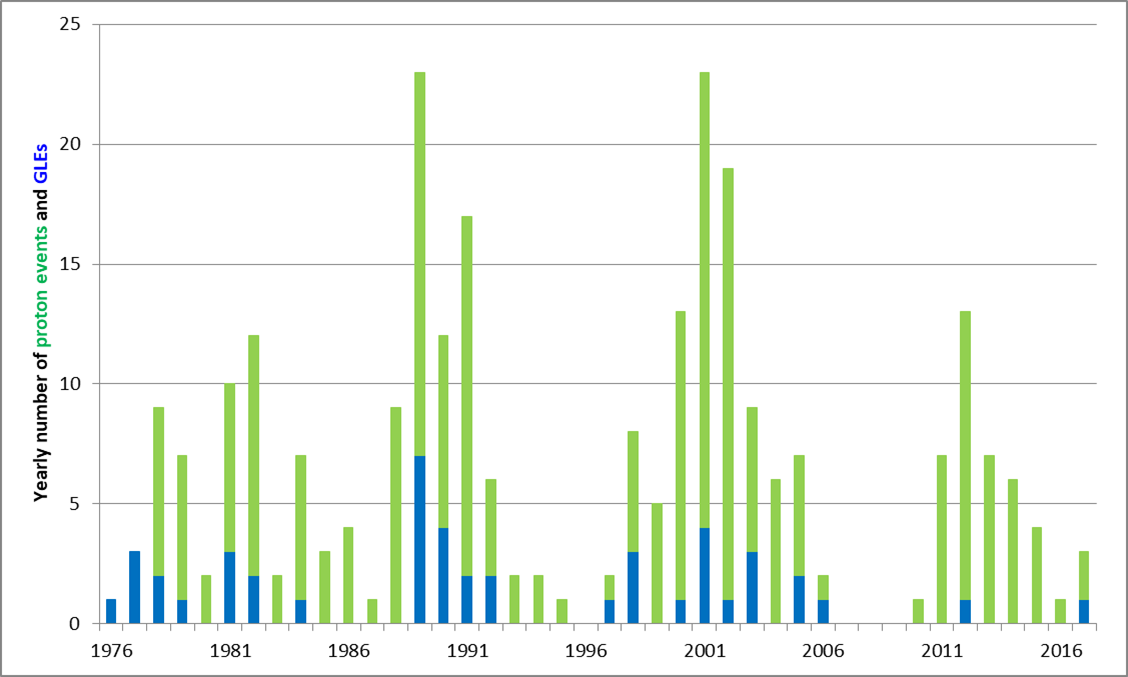
Proton events (see this news item for units and intensities) is the domain where SC24 is doing relatively well. The number of events is not that much lower than SC21 (42 vs. 59), and it tops SC21 when it comes to the intensity of strongest proton events (6530 pfu vs. 2900 pfu). SC22 holds the record of strongest proton event since 1976 (43000 pfu!), and SC23 produced the most proton events in one solar cycle (94, or more than double of what we have seen during SC24). Unfortunately, SC24 does a poor job when it comes to Ground Level Enhancements (GLE). These occur during a proton event that is associated with particles having an energy well above the "regular" 10 MeV, rather in the neighbourhood of around 1 GeV. When these particles collide with particles in the Earth's upper atmosphere, they can create a shower of secondary particles which can be detected by neutron monitors on ground such as in Dourbes. Several conditions (number of stations, percentage increase above background) need to fulfilled before an increase in the observed neutron counts is validated as a genuine GLE. Since the start of the measurements in the 1940s, only 72 such events have been recorded. For SC21 to 23, about 13-16 events per solar cycle have been recorded. For SC24, the count stops at 2... : one on 17 May 2012, and the other on 10 September 2017 which was associated with the 2nd strongest flare of SC24 (X8).
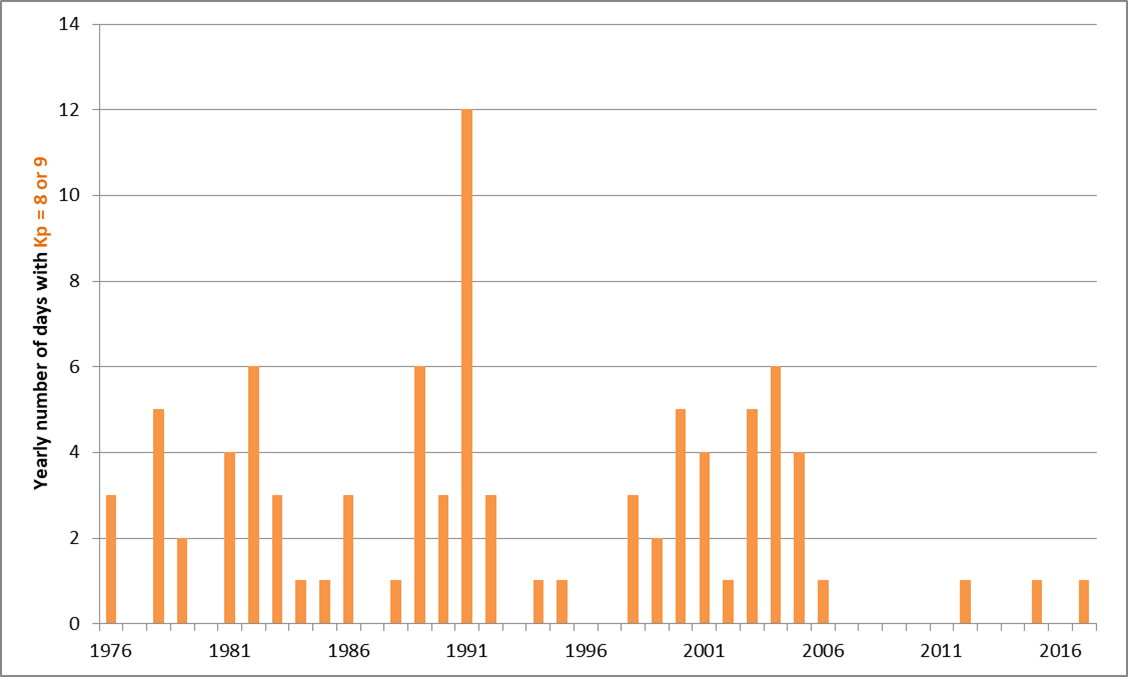
The depressing statistics continue also in the domain of the geomagnetic disturbances. When counting the days with severe or extremely severe geomagnetic disturbances (Kp = 8 or 9), the counter for SC24 stops already at 3: 9 March 2012, 22 June 2015 and 8 September 2017. So far, no days with Kp = 9 have been recorded during SC24. For the 3 previous solar cycles, there were always between 27 and 31 days with (extremely) severe geomagnetic disturbances. The plot above clearly shows how absent strong geomagnetic activity has been during this solar cycle. Intensity wise, only during the geomagnetic storms of 17 March 2015 and 22 June 2015 reached the Dst index (Disturbance storm-time index; see news item) values below -200 nT. The Dst index is often used for gauging the intensity of a geomagnetic storm. Compared to the previous solar cycles, there have been much more intense cases such as on 13-14 March 1989 (Dst = -589 nT!) when the province of Québec in Canada experienced a power grid failure that lasted for several hours.
So, in basically every domain SC24 has been outperformed by its three predecessors. The SC24 activity is most likely comparable to the solar cycles in the late 19th and early 20th century, but most of the above mentioned parameters were not available at that time, preventing definite conclusions.