
Active region NOAA 2733 started its development late on 21 January, remaining all-in-all a relatively small sunspot group. The trailing portion showed some magnetic mixing, with (small) sunspots of opposite magnetic polarity close to each other. This was the source location of the first C5 flare on 26 January (C5.0 peaking at 13:22UT). The active region then simplified, getting a more open structure and becoming less active. However while approaching the Sun's west limb, some new opposite polarity flux appeared south of the main leading spot, which had continued to grow over these few days. The new flux rejuvenated the flaring activity in NOAA 2733, which produced several C-class flares on 29 and 30 January. The strongest of the series was a C5.2 flare peaking on 30 January at 06:11UT. These were the strongest flares since the C8.1 flare produced by NOAA 2699 on 7 February 2018. None of the flares were associated with coronal mass ejections.
Underneath some imagery to illustrate the events of the last few days, courtesy SDO/HMI and AIA, and JHelioviewer.

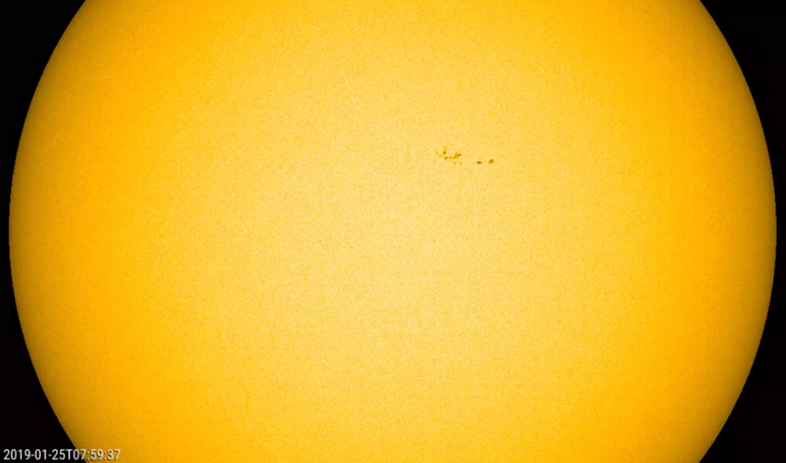
Imagery showing the development of active region NOAA 2733 during the period 22-27 January, being magnetically most complex around 25-26 January. Note the continued growth of the leading spot.
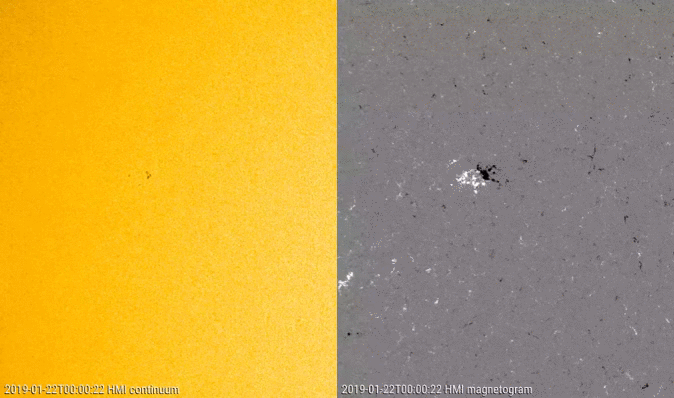
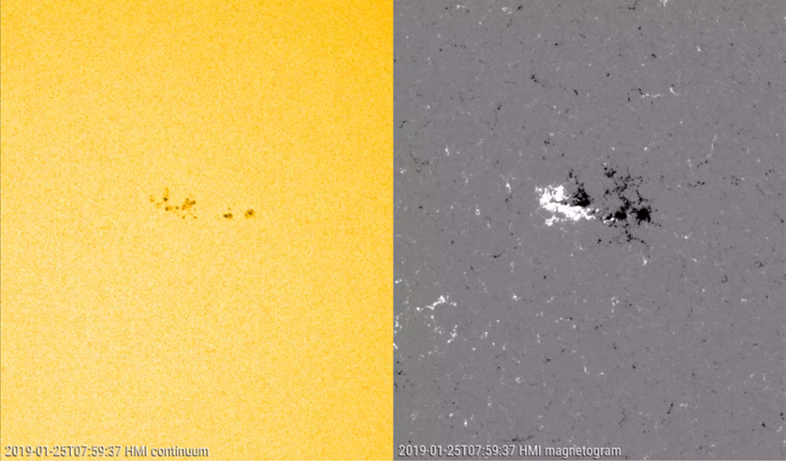
Imagery showing a magnified view of NOAA 2733 in white light as well as a magnetogram for the same period, with white meaning magnetic field lines coming out of the Sun, and black meaning field lines returning to the solar interior. Note the small spots of opposite polarity close to each other in the trailing section of the region on 25 and 26 January.

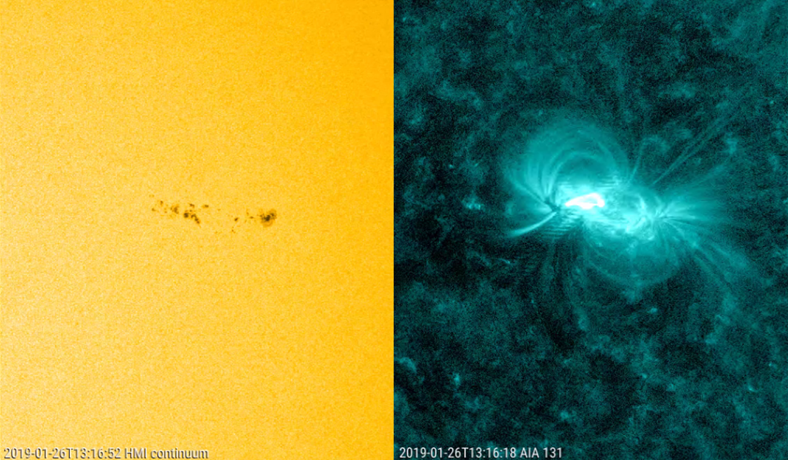

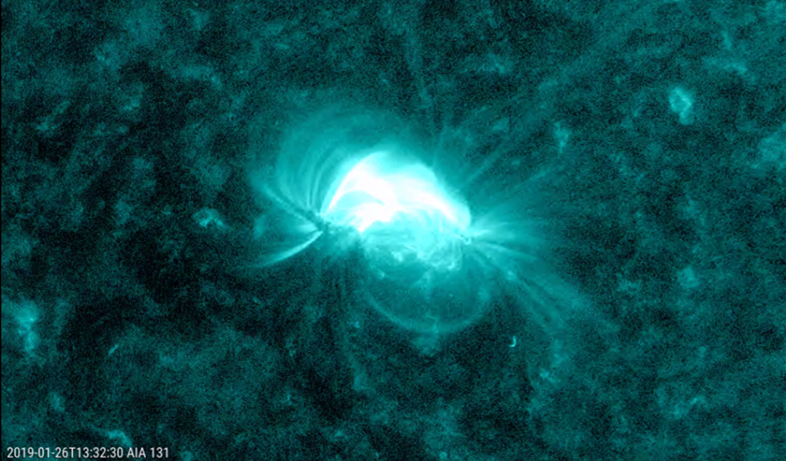
Imagery displaying the first C5 flare, with white light images teamed with extreme ultraviolet (EUV) images from SDO/AIA 131 showing the hot corona at 10 million degrees. The still images show the onset of the C5 flare -clearly in the trailing portion of the region- and a zoom of the flaring region in EUV shortly after the flare's peak.
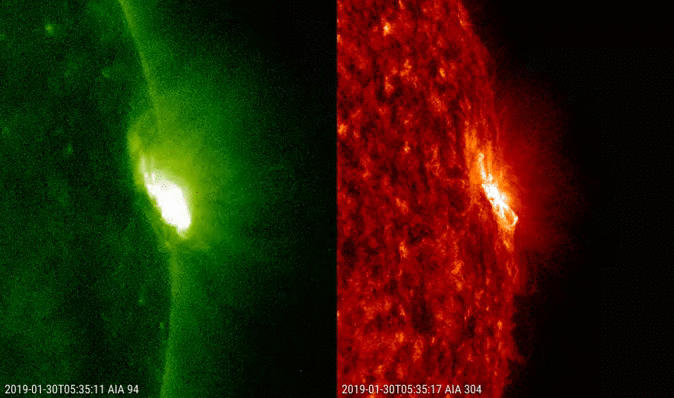
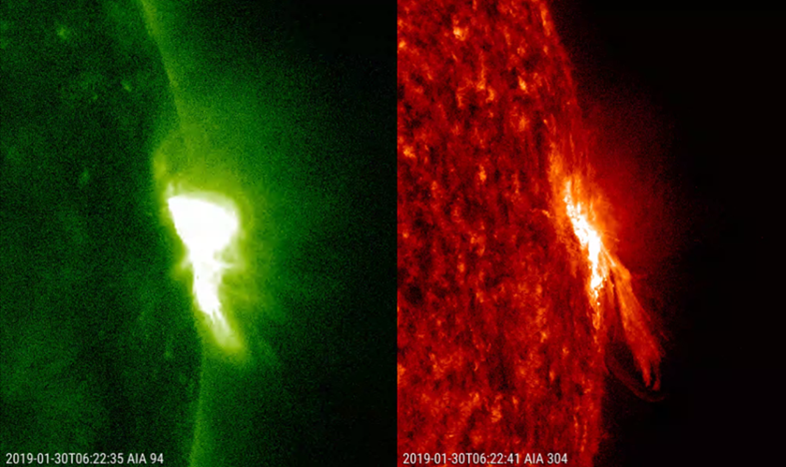
Another magnified view, this time combining EUV images taken by SDO/AIA 094 ("hot" corona at temperatures of about 6 million degrees) and SDO/AIA 304 ("cold" temperatures of only about 80.000 degrees). Displayed is the C5.2 flare shortly after its peak intensity showing a "cold" jet to the south (AIA 304) and a hot area more to the north of the active region.

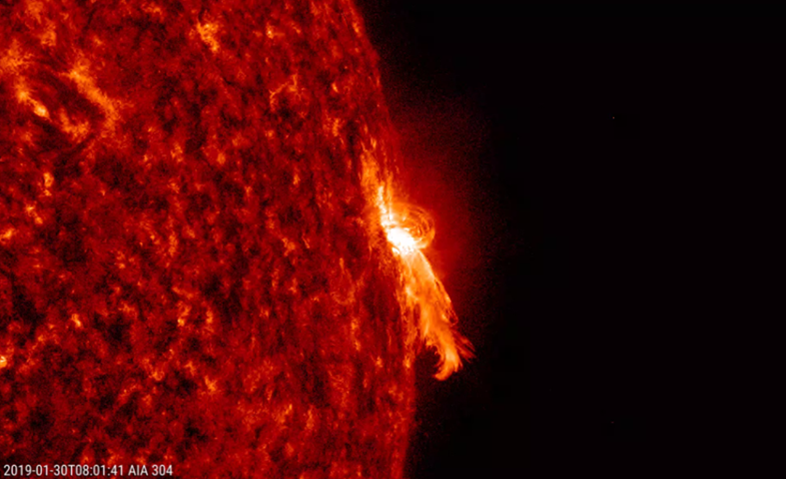
The final images show the event in EUV at low temperatures (SDO/AIA 304, 80.000 degrees), about 1.5 hours after the peak of the C5.2 flare. Post-flare coronal loops can be seen to the north of the region, as well as another jet to the south. The appearance of these jets seem to indicate that the magnetic environment in NOAA 2733 may have changed compared to the first C5 flare a few days earlier when nu such jets were observed in AIA 304.
